Datos de muestra
El siguiente data frame contiene una variable numérica que representa el conteo de cierto evento y la etiqueta o grupo correspondiente para cada valor.
df <- data.frame(value = c(10, 23, 15, 18),
group = paste0("G", 1:4))| value | group |
|---|---|
| 10 | G1 |
| 23 | G2 |
| 15 | G3 |
| 18 | G4 |
Diagrama de sectores con geom_bar o geom_col y coord_polar
Pie chart básico
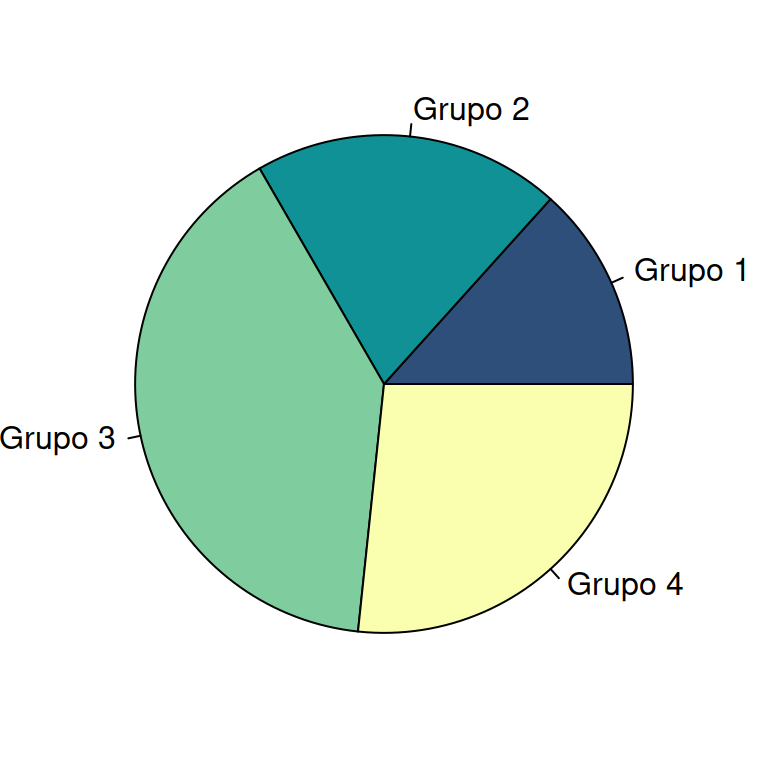
Un gráfico de sectores en ggplot2 es un gráfico de barras en coordenadas polares. Puedes usar geom_bar o geom_col y theta = "y" dentro de coord_polar.
# install.packages("ggplot2")
library(ggplot2)

ggplot(df, aes(x = "", y = value, fill = group)) +
  geom_col() +
  coord_polar(theta = "y")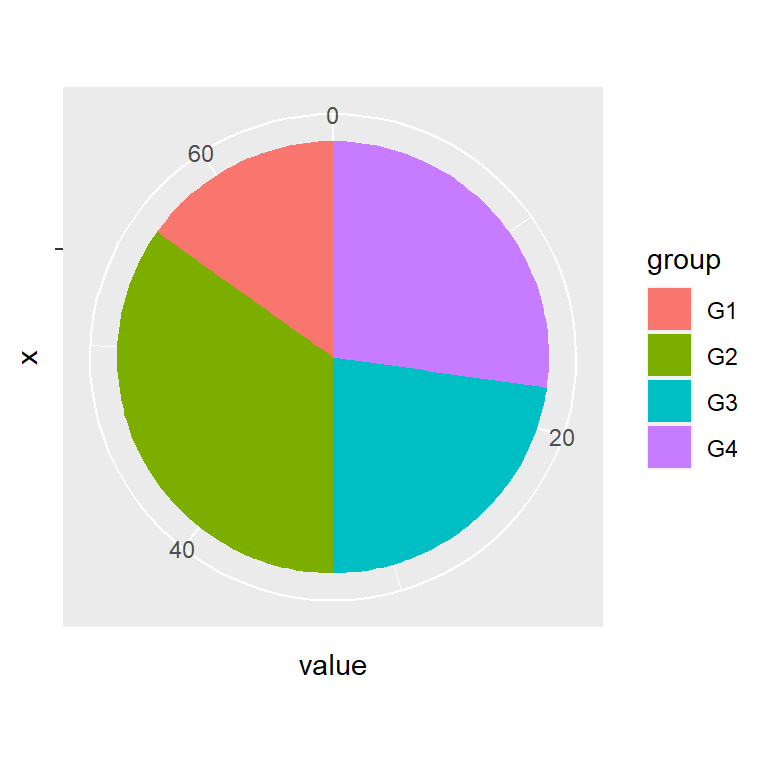
Color de las líneas
Los bordes de los sectores se pueden cambiar con el argumento color de la función geom_bar o geom_col.
# install.packages("ggplot2")
library(ggplot2)

ggplot(df, aes(x = "", y = value, fill = group)) +
  geom_col(color = "black") +
  coord_polar(theta = "y")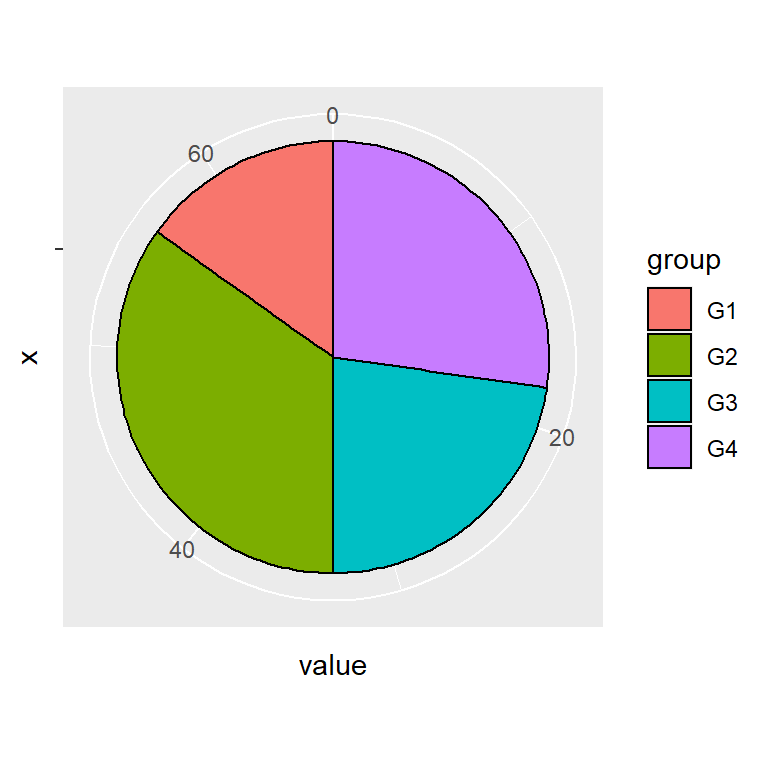
Texto y etiquetas
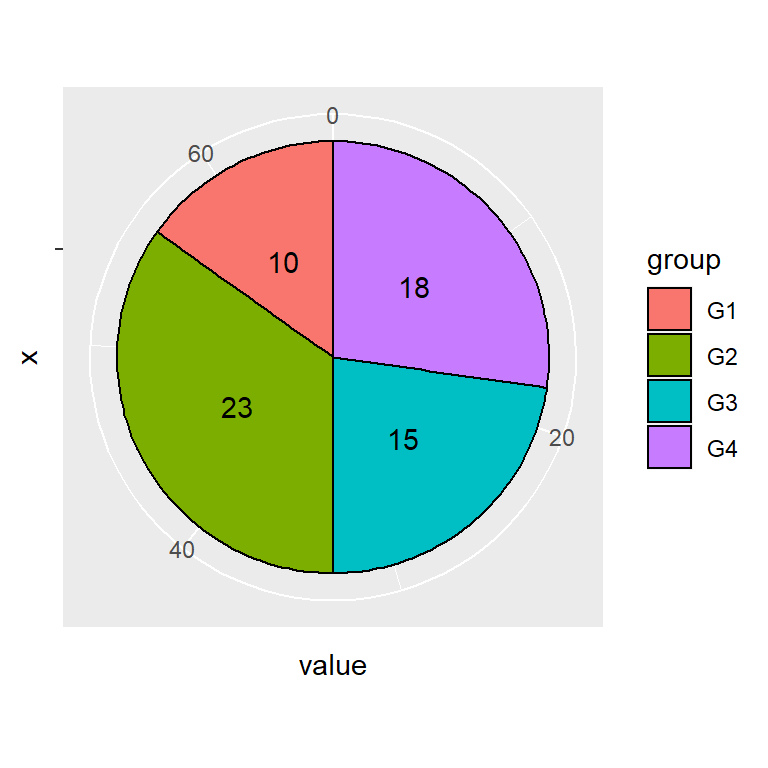
Agregar texto
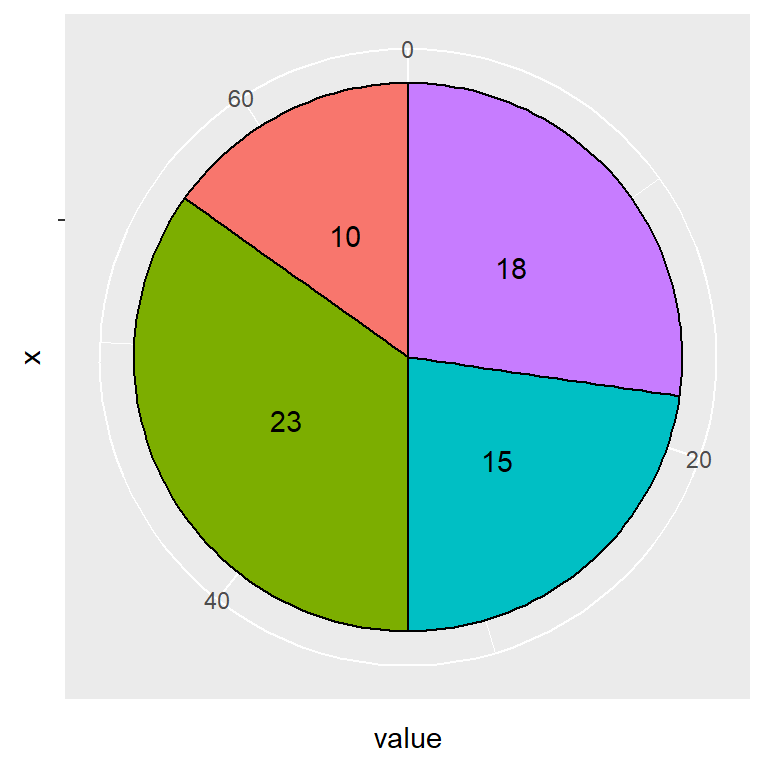
Por defecto, los valores no se muestran dentro de cada porción. Puedes añadirlos con geom_text. Ten en cuenta que position_stack(vjust = 0.5) agregará los textos en la posición correcta.
# install.packages("ggplot2")
library(ggplot2)

ggplot(df, aes(x = "", y = value, fill = group)) +
  geom_col(color = "black") +
  geom_text(aes(label = value),
            position = position_stack(vjust = 0.5)) +
  coord_polar(theta = "y")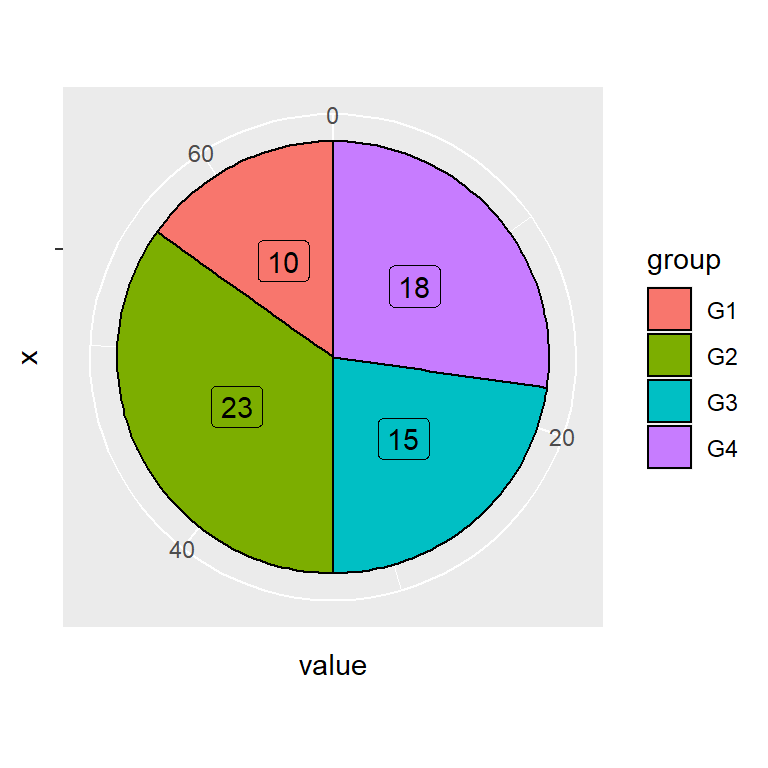
Agregar etiquetas
Una alternativa a geom_text es usar geom_label, que agrega un borde alrededor de los valores. Si estableces esto la leyenda mostrará una letra “a” dentro de las cajas, por lo que hemos sobrescrito este comportamiento con show.legend = FALSE.
# install.packages("ggplot2")
library(ggplot2)

ggplot(df, aes(x = "", y = value, fill = group)) +
  geom_col(color = "black") +
  geom_label(aes(label = value),
             position = position_stack(vjust = 0.5),
             show.legend = FALSE) +
  coord_polar(theta = "y")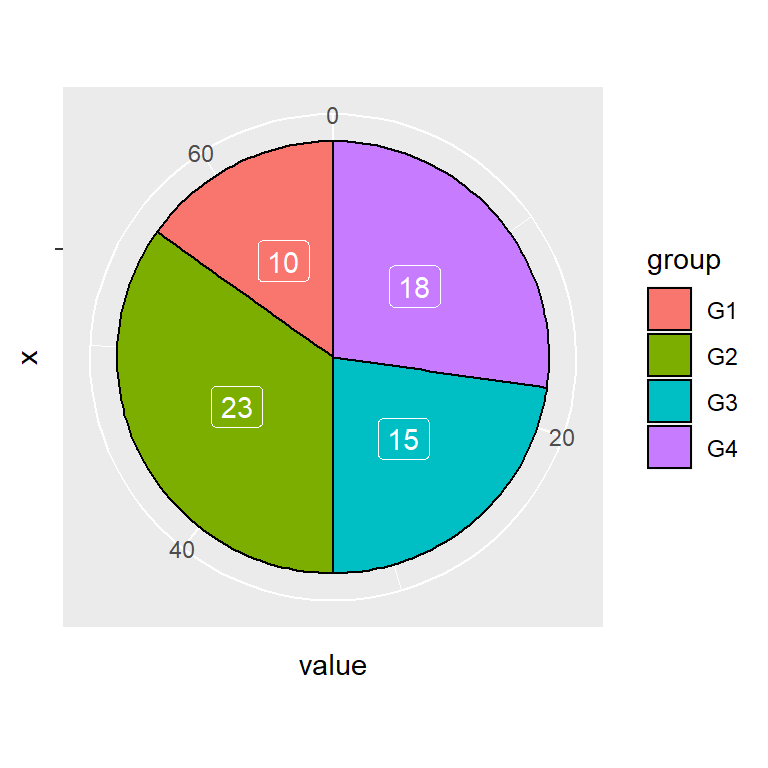
Color de las etiquetas
Ten en cuenta que puedes cambiar el color de las etiquetas con color.
# install.packages("ggplot2")
library(ggplot2)

ggplot(df, aes(x = "", y = value, fill = group)) +
  geom_col(color = "black") +
  geom_label(aes(label = value),
             color = "white",
             position = position_stack(vjust = 0.5),
             show.legend = FALSE) +
  coord_polar(theta = "y")
Personalización de los colores
Paleta de colores
La paleta de colores por defecto se puede cambiar con una paleta de colores predefinida, como scale_fill_brewer o scale_fill_viridis_d.
# install.packages("ggplot2")
library(ggplot2)

ggplot(df, aes(x = "", y = value, fill = group)) +
  geom_col(color = "black") +
  geom_text(aes(label = value),
            position = position_stack(vjust = 0.5)) +
  coord_polar(theta = "y") +
  scale_fill_brewer()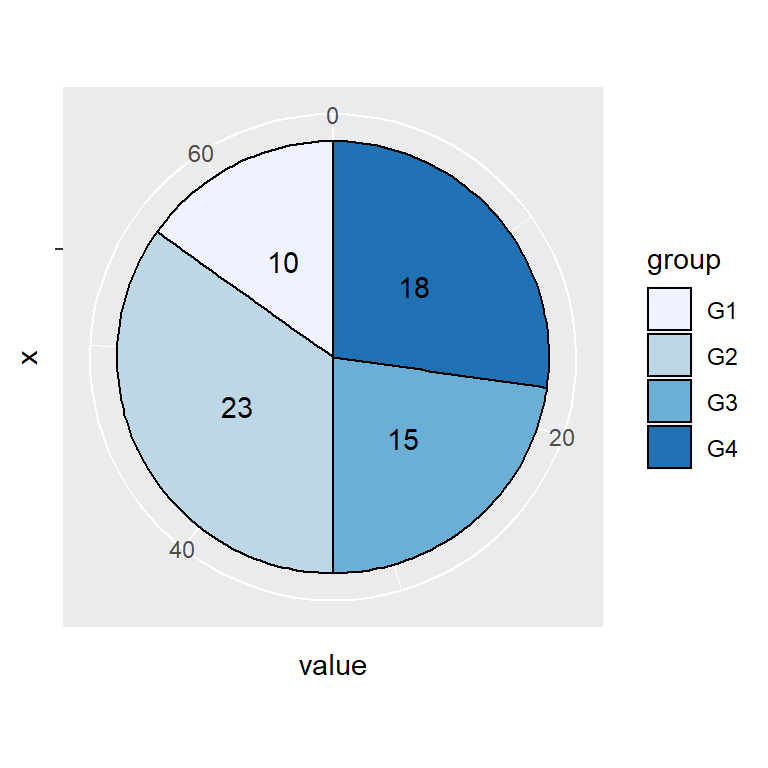
Colores personalizados
Si prefieres elegir tú mismo los colores puedes usar scale_fill_manual y pasar los colores correspondientes.
# install.packages("ggplot2")
library(ggplot2)

ggplot(df, aes(x = "", y = value, fill = group)) +
  geom_col(color = "black") +
  geom_text(aes(label = value),
            position = position_stack(vjust = 0.5)) +
  coord_polar(theta = "y") +
  scale_fill_manual(values = c("#BE2A3E", "#EC754A",
                               "#EACF65", "#3C8D53"))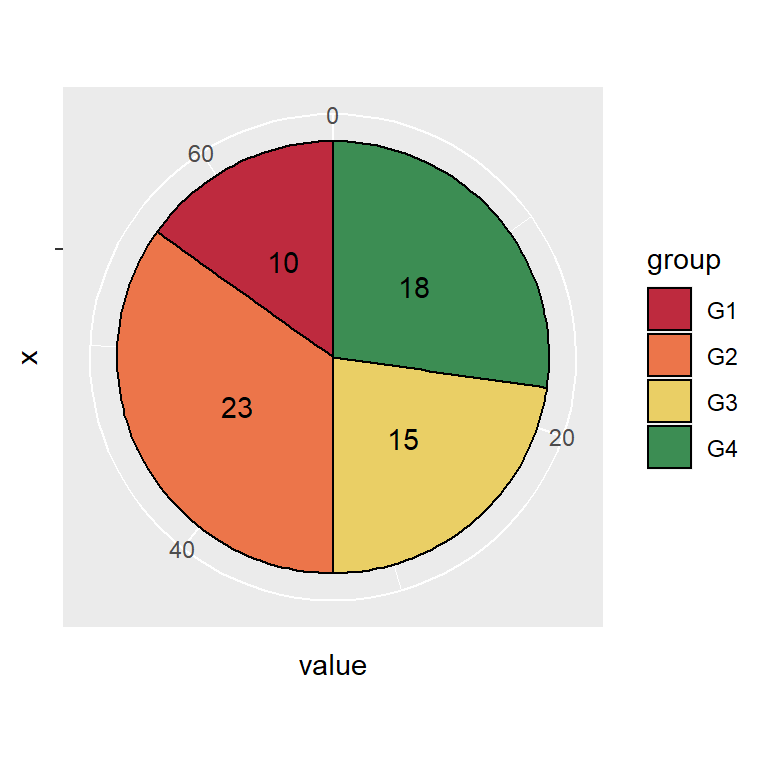
Personalización del tema
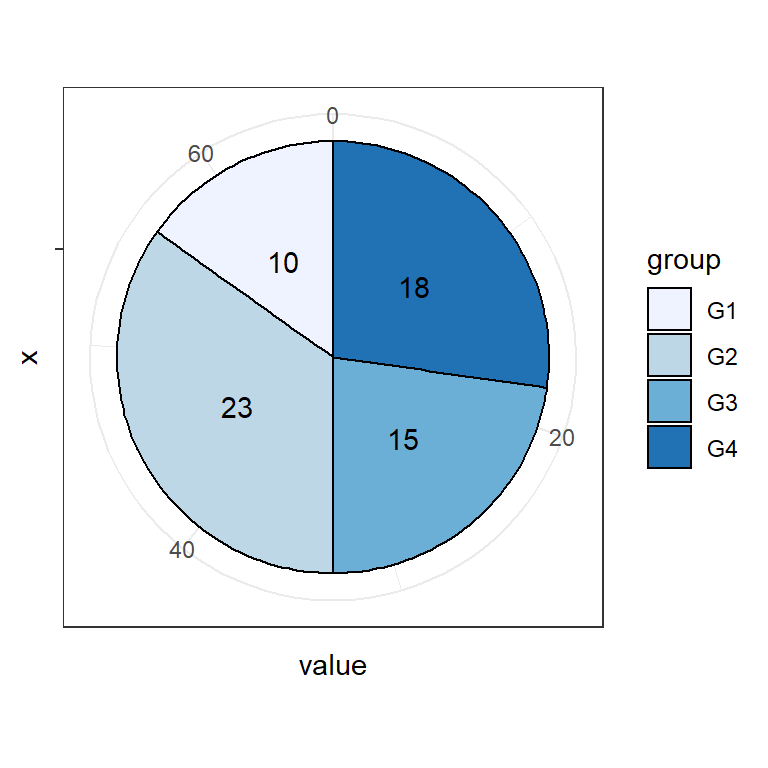
El estilo del diagrama de sectores en ggplot2 se puede cambiar cambiando el tema.
# install.packages("ggplot2")
library(ggplot2)

ggplot(df, aes(x = "", y = value, fill = group)) +
  geom_col(color = "black") +
  geom_text(aes(label = value),
            position = position_stack(vjust = 0.5)) +
  coord_polar(theta = "y") +
  scale_fill_brewer() +
  theme_bw()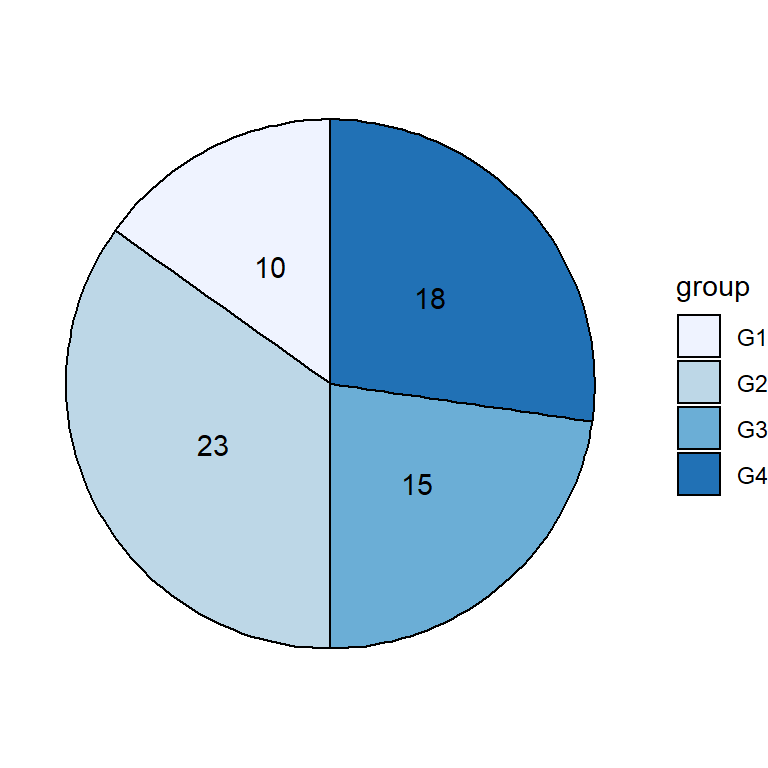
También puedes eliminar por completo el tema con theme_void.
# install.packages("ggplot2")
library(ggplot2)

ggplot(df, aes(x = "", y = value, fill = group)) +
  geom_col(color = "black") +
  geom_text(aes(label = value),
            position = position_stack(vjust = 0.5)) +
  coord_polar(theta = "y") +
  scale_fill_brewer() +
  theme_void()
Otra alternativa es crear un estilo personalizado modificando los componentes de la función theme. Ten en cuenta que puedes crear un tema personalizado si quieres reproducir el estilo más veces.
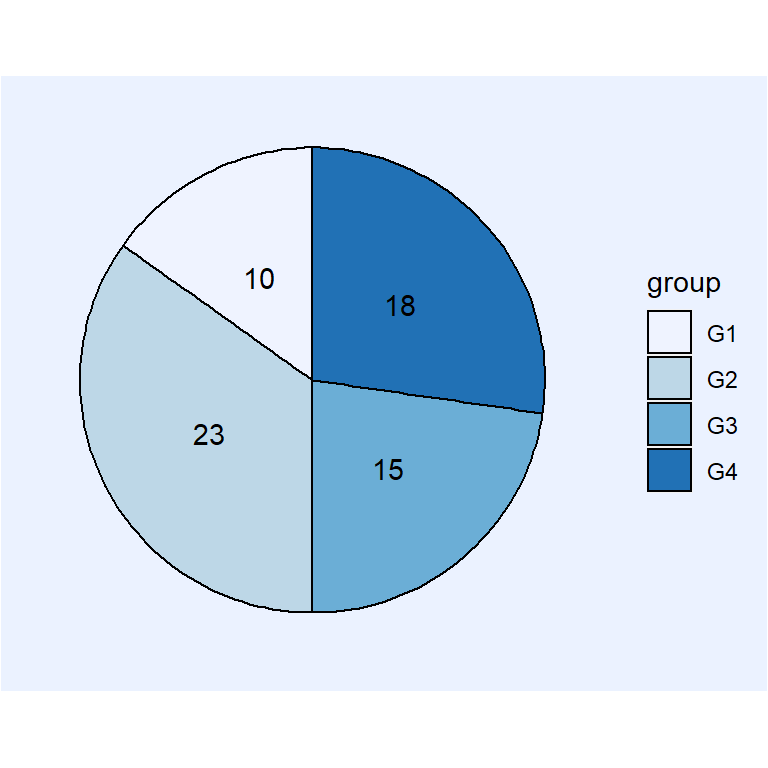
# install.packages("ggplot2")
library(ggplot2)

ggplot(df, aes(x = "", y = value, fill = group)) +
  geom_col(color = "black") +
  geom_text(aes(label = value),
            position = position_stack(vjust = 0.5)) +
  coord_polar(theta = "y") +
  scale_fill_brewer() +
  theme(axis.text = element_blank(),
        axis.ticks = element_blank(),
        axis.title = element_blank(),
        panel.grid = element_blank(),
        panel.background = element_rect(fill = "#ebf2ff"),
        plot.background = element_rect(fill = "#ebf2ff"),
        legend.background = element_rect(fill = "#ebf2ff"))
Personalización de la leyenda
Título de la leyenda
El título por defecto de la leyenda es el nombre de la variable categórica del data frame de entrada. Cámbialo como se muestra en el siguiente ejemplo.
# install.packages("ggplot2")
library(ggplot2)

ggplot(df, aes(x = "", y = value, fill = group)) +
  geom_col(color = "black") +
  geom_text(aes(label = value),
            position = position_stack(vjust = 0.5)) +
  coord_polar(theta = "y") +
  guides(fill = guide_legend(title = "Título"))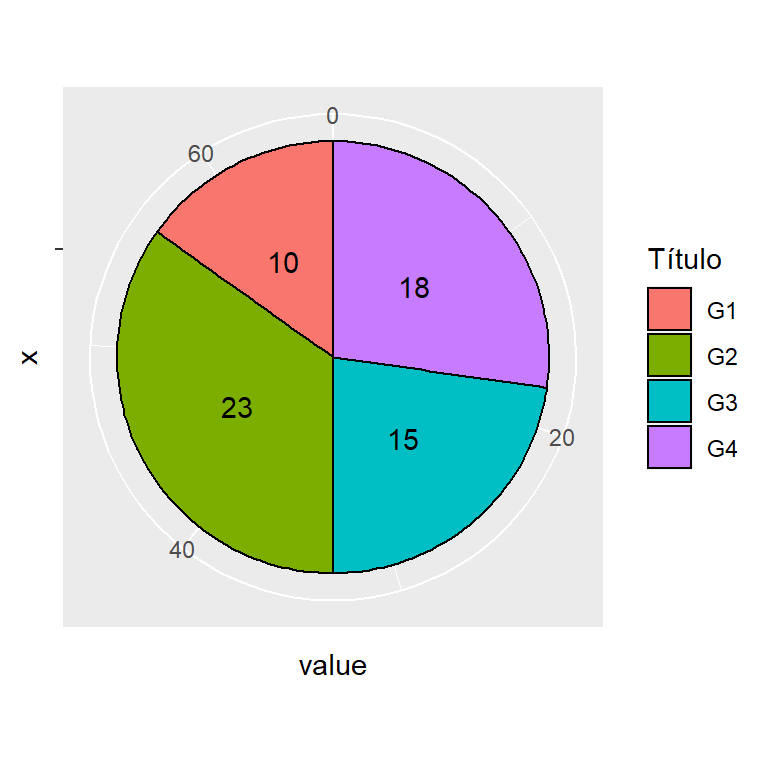
Etiquetas de la leyenda
Las etiquetas de la leyenda también se pueden personalizar. Usa el argumento labels de scale_fill_discrete o scale_fill_manual.
# install.packages("ggplot2")
library(ggplot2)

ggplot(df, aes(x = "", y = value, fill = group)) +
  geom_col(color = "black") +
  geom_text(aes(label = value),
            position = position_stack(vjust = 0.5)) +
  coord_polar(theta = "y") +
  scale_fill_discrete(labels = c("A", "B", "C", "D"))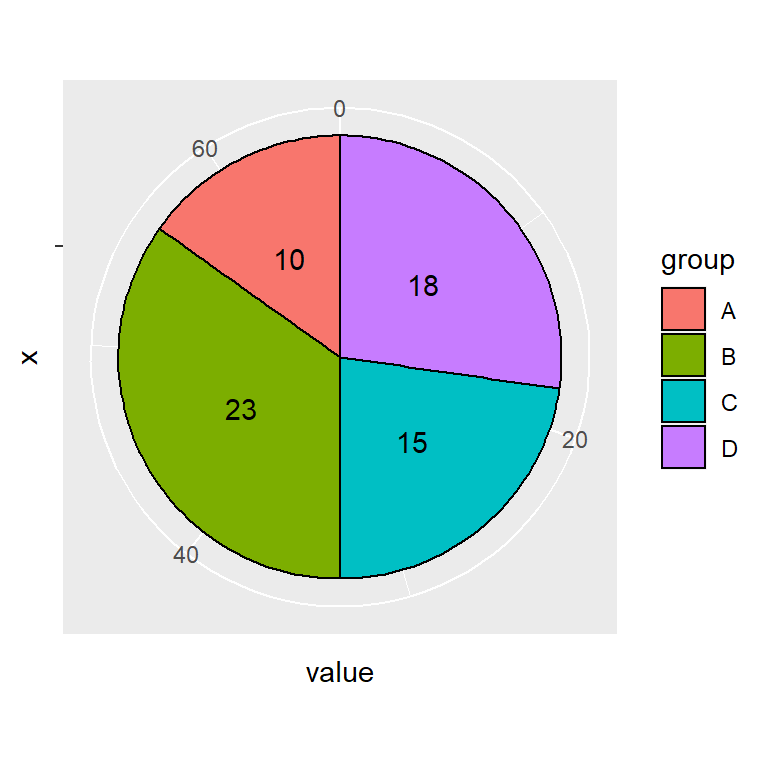
Posición de la leyenda
La leyenda se puede poner en varias posiciones con el componente legend.position de la función theme. Los posibles lugares son "bottom" (abajo), "left" (izquierda), "top" (arriba) y "right" (derecha, por defecto).
# install.packages("ggplot2")
library(ggplot2)

ggplot(df, aes(x = "", y = value, fill = group)) +
  geom_col(color = "black") +
  geom_text(aes(label = value),
            position = position_stack(vjust = 0.5)) +
  coord_polar(theta = "y") +
  theme(legend.position = "bottom")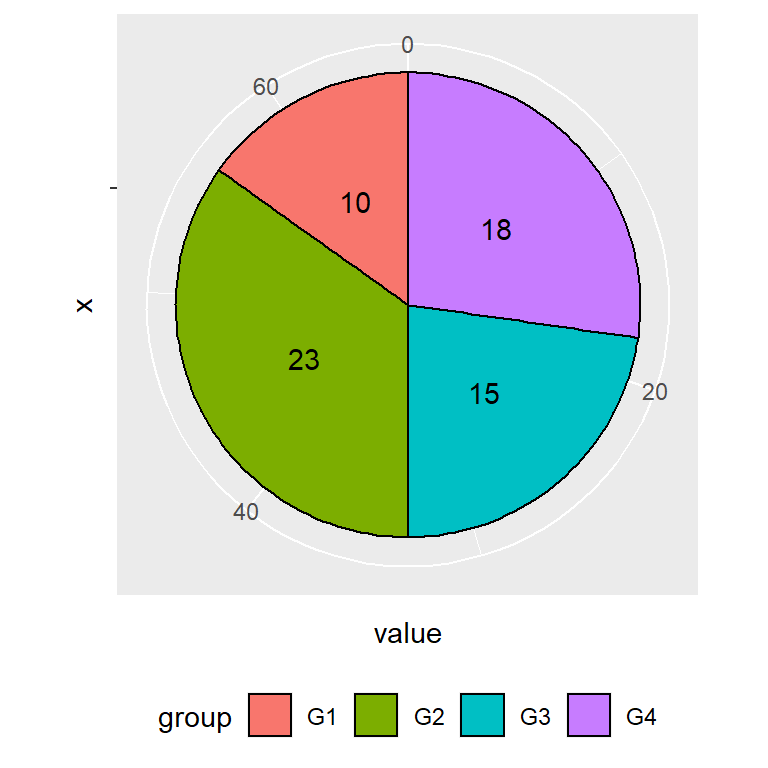
Eliminar la leyenda
Si prefieres eliminar la leyenda establece su posición a "none".
# install.packages("ggplot2")
library(ggplot2)

ggplot(df, aes(x = "", y = value, fill = group)) +
  geom_col(color = "black") +
  geom_text(aes(label = value),
            position = position_stack(vjust = 0.5)) +
  coord_polar(theta = "y") +
  theme(legend.position = "none")