Datos de muestra
Considera el siguiente subconjunto del data frame newgdp de la librería CGPfunctions, que también contiene la función que usaremos en este tutorial.
# install.packages("CGPfunctions")
library(CGPfunctions)

df <- newgdp[16:30, ]
La función newggslopegraph del paquete CGPfunctions
Dado un data frame con al menos tres columna que representan el tiempo (eje X), la medida (eje Y) y los grupos puedes crear un gráfico de pendientes en ggplot2 haciendo uso de la función newggslopegraph de la librería CGPfunctions pasando el data frame y especificando los nombres de las columnas:
# install.packages("CGPfunctions")
library(CGPfunctions)

newggslopegraph(dataframe = df,
                Times = Year,
                Measurement = GDP,
                Grouping = Country)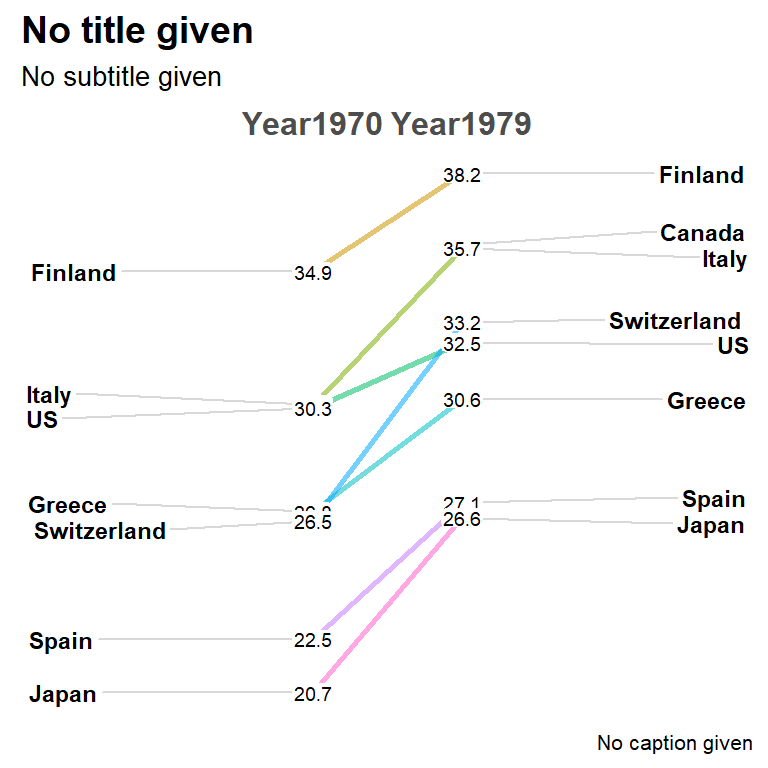
El argumento Data.label es un argumento opcional que puede ser usado para pasar una columna de caracteres para sobrescribir los valores que se muestran en el gráfico. Por defecto la columna pasada a Measurement se convierte en carácter y se usa.
Agregando títulos
La función muestra unos títulos por defecto. Si quieres cambiarlos usa los siguientes argumentos. Ten en cuenta que si los estableces como NULL puedes borrarlos.
# install.packages("CGPfunctions")
library(CGPfunctions)

newggslopegraph(df, Year, GDP, Country,
                Title = "Evolución del PIB",
                SubTitle = "1970-1979",
                Caption = "R CHARTS")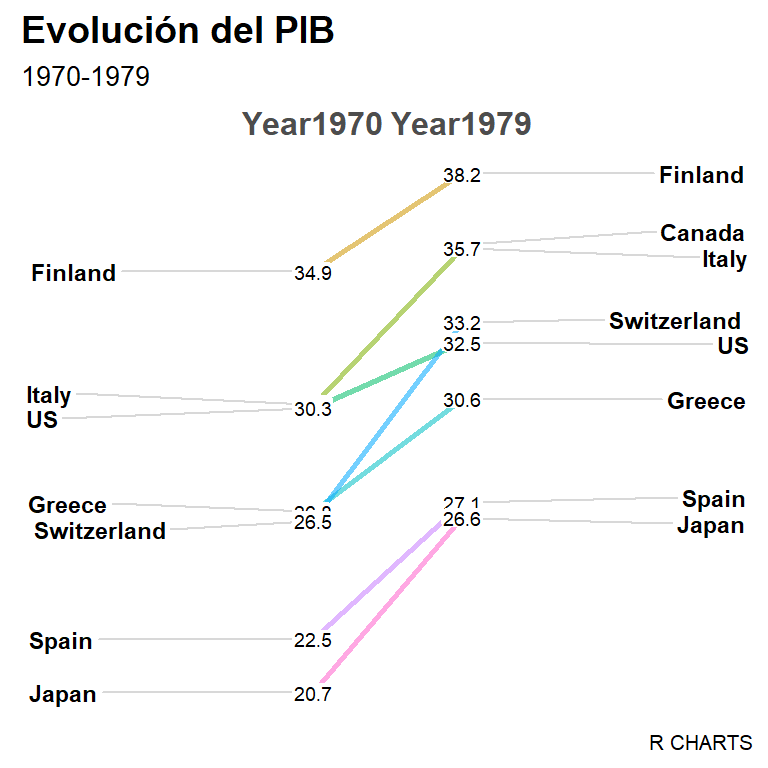
Tamaño y justificado de los textos
La función también proporciona muchos argumentos para personalizar el tamaño y la alineación de los textos.
# install.packages("CGPfunctions")
library(CGPfunctions)

newggslopegraph(df, Year, GDP, Country,
                Title = "Evolución del PIB",
                SubTitle = "1970-1979",
                Caption = "R CHARTS",
                XTextSize = 18,    # Tamaño textos eje X
                YTextSize = 2,     # Tamaño grupos
                TitleTextSize = 14,    # Tamaño título
                SubTitleTextSize = 12, # Tamaño subtítulo
                CaptionTextSize = 10,  # Tamaño caption
                TitleJustify = "right",    # Justificado título
                SubTitleJustify = "right", # Justificado subtítulo
                CaptionJustify = "left",   # Justificado caption
                DataTextSize = 2.5) # Tamaño de los valores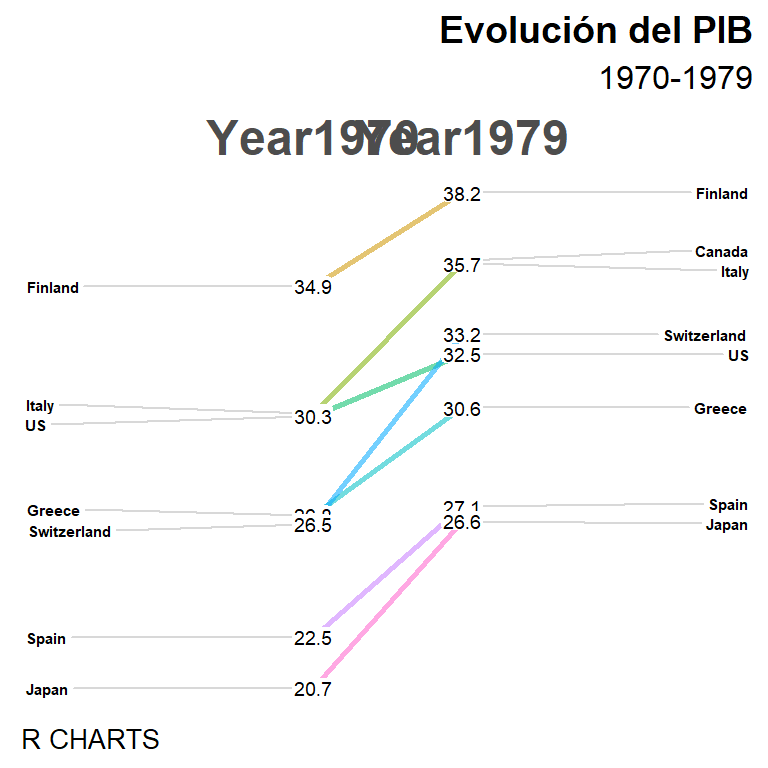
Invertir los ejes
Ten en cuenta que también puedes invertir los ejes. Escribe ?newggslopegraph para obtener detalles adicionales.
# install.packages("CGPfunctions")
library(CGPfunctions)

newggslopegraph(df, Year, GDP, Country,
                Title = "Evolución del PIB",
                SubTitle = "1970-1979",
                Caption = "R CHARTS",
                ReverseYAxis = TRUE,
ReverseXAxis = FALSE) 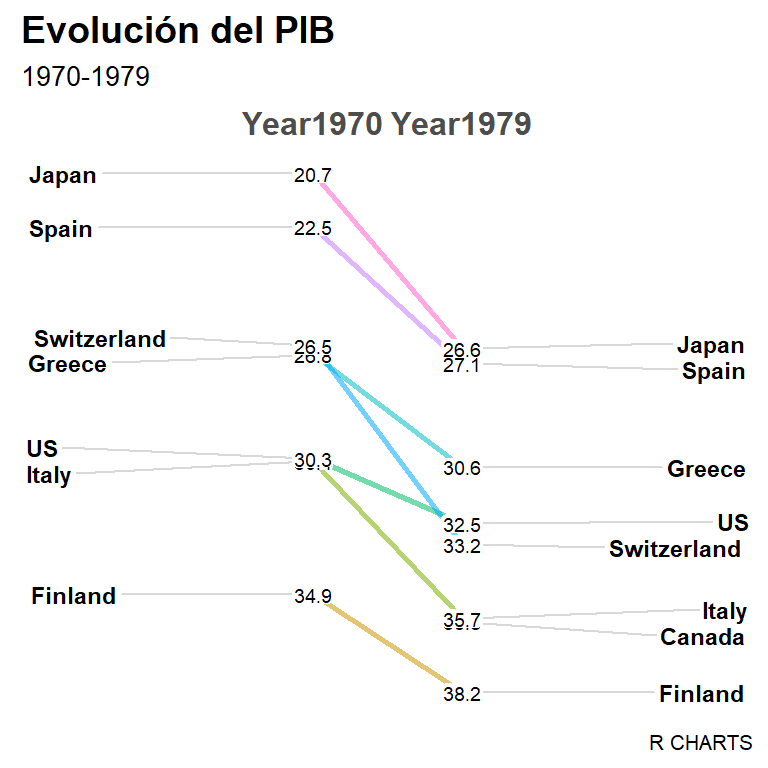
Colores y personalización de las líneas
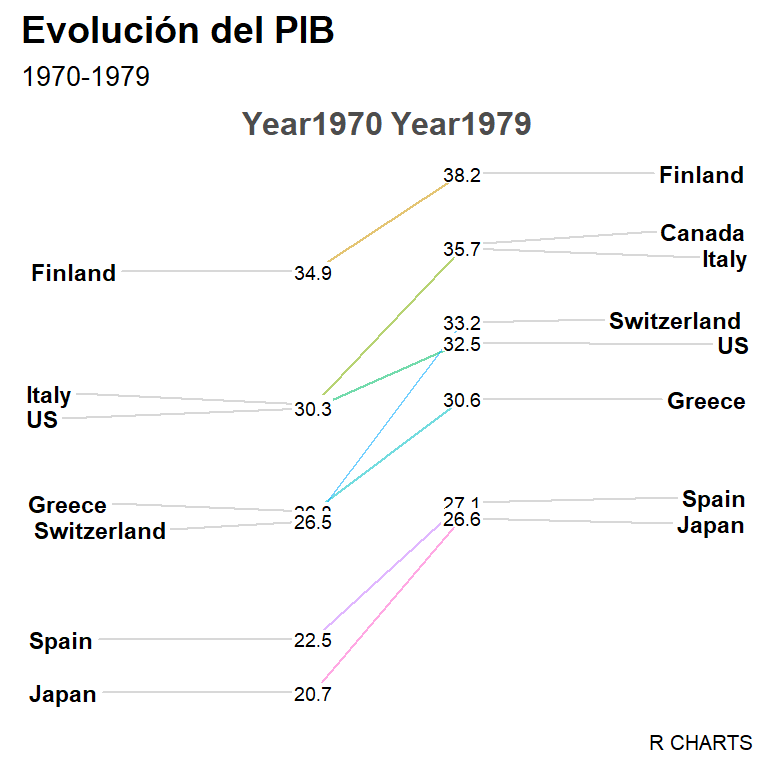
Grosor de las líneas
Por defecto, el ancho de las líneas de los gráficos es igual a 1, pero puedes cambiarlo con el argumento LineThickness.
# install.packages("CGPfunctions")
library(CGPfunctions)

newggslopegraph(df, Year, GDP, Country,
                Title = "Evolución del PIB",
                SubTitle = "1970-1979",
                Caption = "R CHARTS",
LineThickness = 0.5) 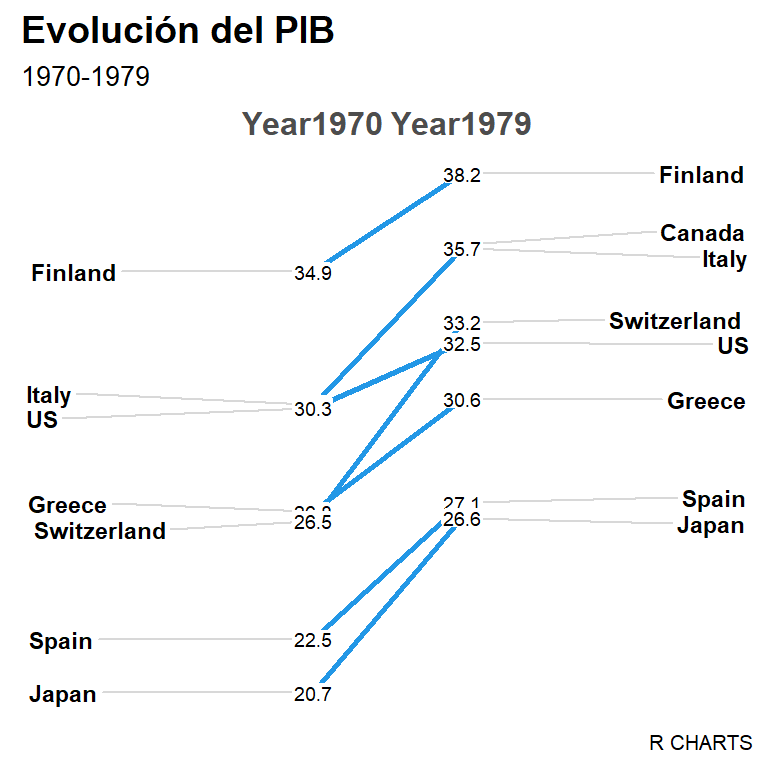
Color de las líneas (un color)
La función usa la paleta de colores clásica de ggplot2 de manera predeterminada. Si quieres sobrescribir esta paleta puedes pasar un color al argumento LineColor.
# install.packages("CGPfunctions")
library(CGPfunctions)

newggslopegraph(df, Year, GDP, Country,
                Title = "Evolución del PIB",
                SubTitle = "1970-1979",
                Caption = "R CHARTS",
LineColor = 4) 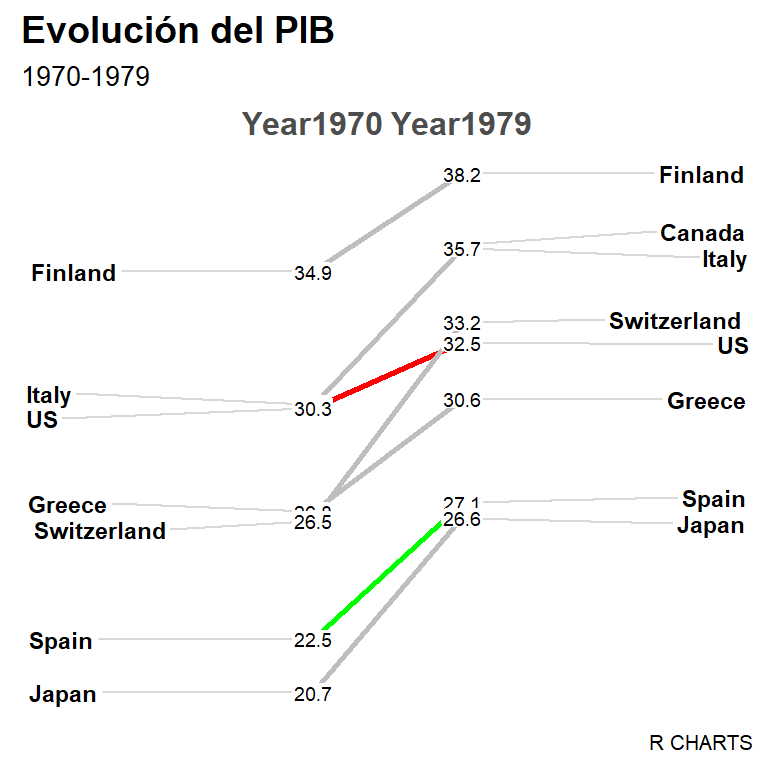
Color de las líneas (varios colores)
Si quieres personalizar el color de cada línea tendrás que crear un vector con nombres con los nombres de los grupos. Esto puede ser usado para destacar algunos grupos, como en el ejemplo siguiente.
# install.packages("CGPfunctions")
library(CGPfunctions)

cols <- c("Finland" = "gray", "Canada" = "gray",
          "Italy" = "gray", "US" = "red",
          "Greece" = "gray", "Switzerland" = "gray",
          "Spain" = "green", "Japan" = "gray")

newggslopegraph(df, Year, GDP, Country,
                Title = "Evolución del PIB",
                SubTitle = "1970-1979",
                Caption = "R CHARTS",
LineColor = cols) 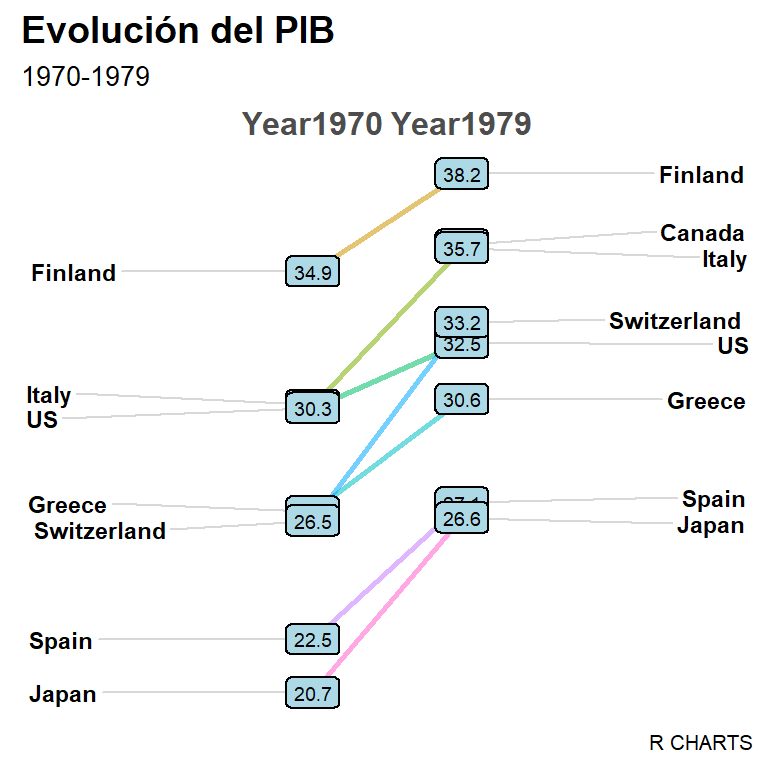
Color de fondo de las etiquetas
Si por alguna razón quieres destacar los valores del gráfico puedes agregarles un color de fondo. Como el relleno por defecto es 0 también puedes incrementarlo para que las etiquetas se vean mejor.
# install.packages("CGPfunctions")
library(CGPfunctions)

newggslopegraph(df, Year, GDP, Country,
                Title = "Evolución del PIB",
                SubTitle = "1970-1979",
                Caption = "R CHARTS",
                DataLabelPadding = 0.2,
                DataLabelLineSize = 0.5,
                DataLabelFillColor = "lightblue")
Temas
Por último, la función también proporciona el argumento ThemeChoice para modificar el tema. El valor por defecto es "bw" y las otras posibles opciones se muestran a continuación.
Tema “ipsum” theme
# install.packages("CGPfunctions")
library(CGPfunctions)
# install.packages("hrbrthemes")

newggslopegraph(df, Year, GDP, Country,
                Title = "Evolución del PIB",
                SubTitle = "1970-1979",
                Caption = "R CHARTS",
                ThemeChoice = "ipsum")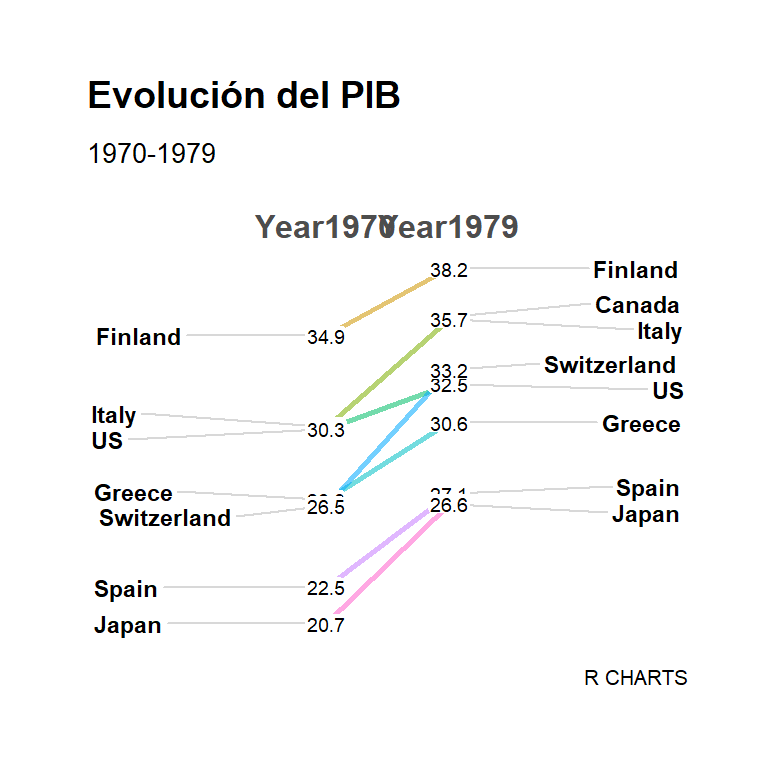
Tema “econ”
# install.packages("CGPfunctions")
library(CGPfunctions)
# install.packages("ggthemes")

newggslopegraph(df, Year, GDP, Country,
                Title = "Evolución del PIB",
                SubTitle = "1970-1979",
                Caption = "R CHARTS",
                ThemeChoice = "econ")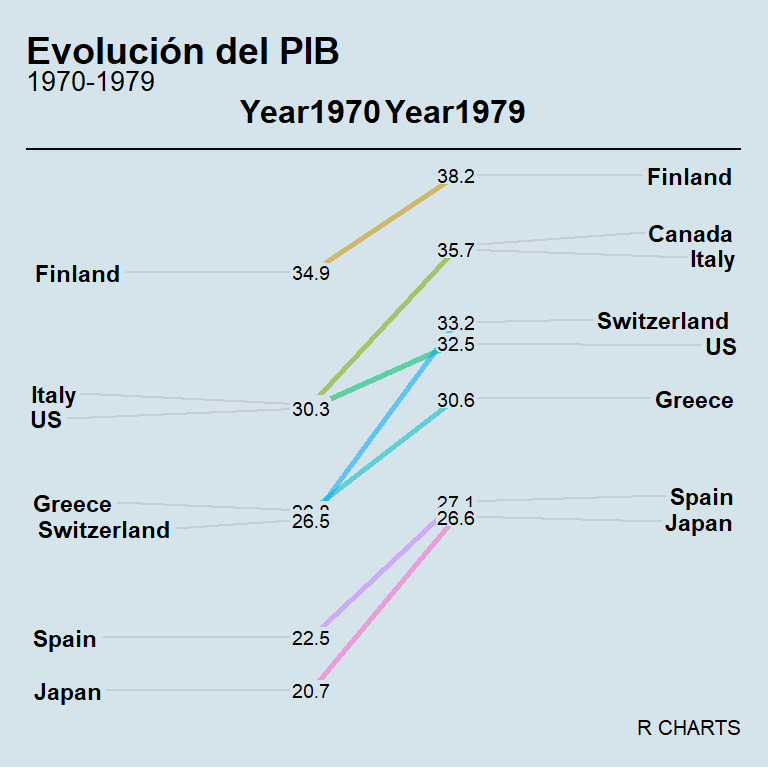
Tema “wsj”
# install.packages("CGPfunctions")
library(CGPfunctions)
# install.packages("ggthemes")

newggslopegraph(df, Year, GDP, Country,
                Title = "Evolución del PIB",
                SubTitle = "1970-1979",
                Caption = "R CHARTS",
                ThemeChoice = "wsj")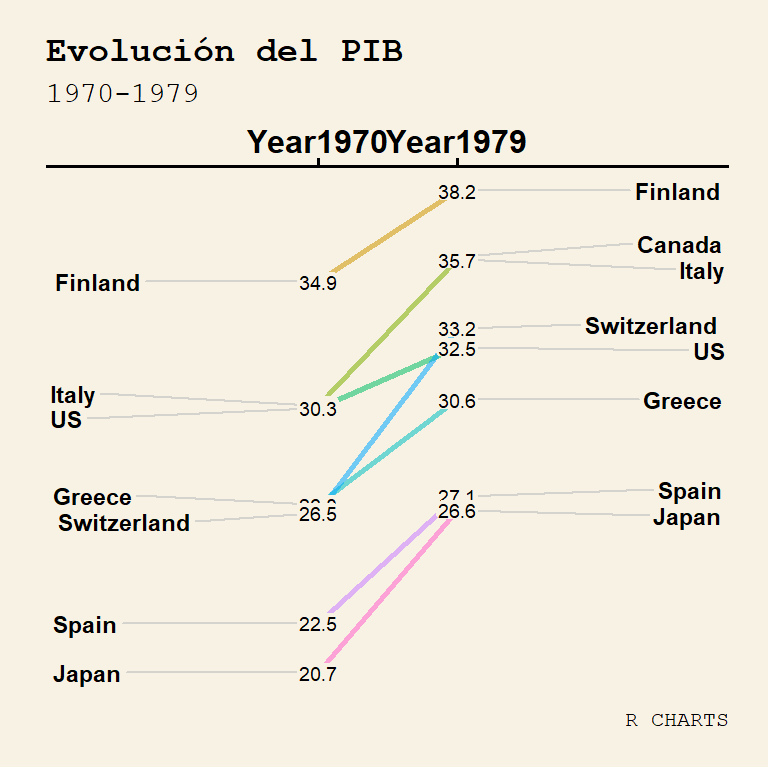
Tema “gdocs”
# install.packages("CGPfunctions")
library(CGPfunctions)
# install.packages("ggthemes")

newggslopegraph(df, Year, GDP, Country,
                Title = "Evolución del PIB",
                SubTitle = "1970-1979",
                Caption = "R CHARTS",
                ThemeChoice = "gdocs")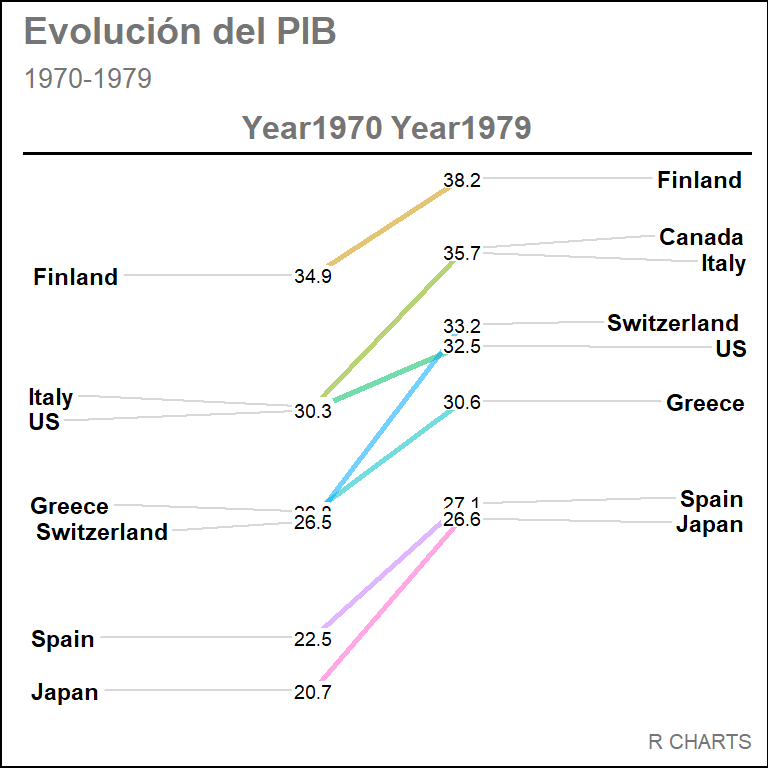
Tema “tufte”
# install.packages("CGPfunctions")
library(CGPfunctions)
# install.packages("ggthemes")

newggslopegraph(df, Year, GDP, Country,
                Title = "Evolución del PIB",
                SubTitle = "1970-1979",
                Caption = "R CHARTS",
                ThemeChoice = "tufte")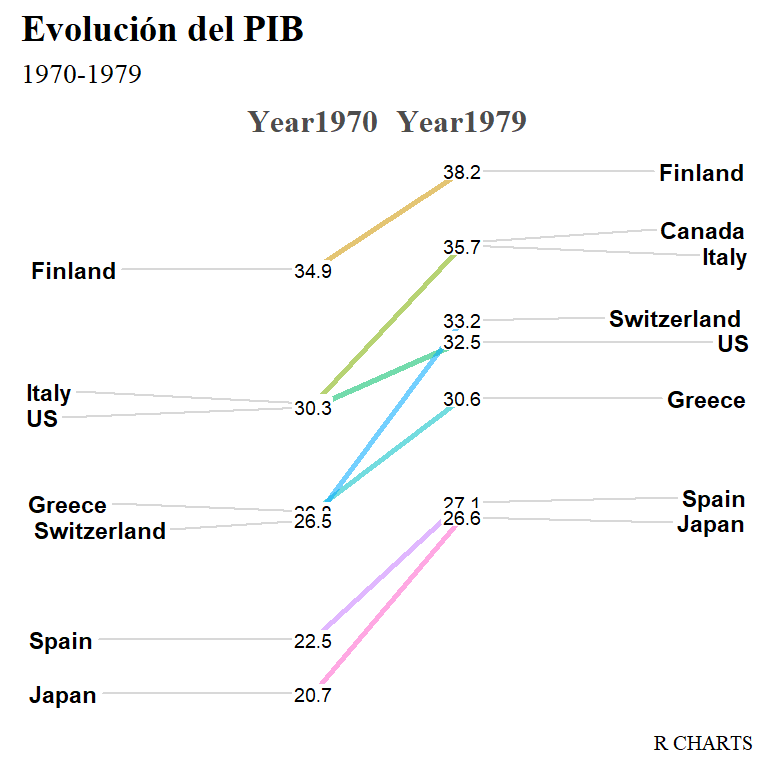
Otros temas
Como la función se basa en ggplot2 también puedes usar otros temas agregando una nueva capa. En el siguiente ejemplo estamos pasando el tema por defecto de ggplot2.
# install.packages("CGPfunctions")
library(CGPfunctions)
# install.packages("ggplot2")
library(ggplot2)

newggslopegraph(df, Year, GDP, Country,
                Title = "Evolución del PIB",
                SubTitle = "1970-1979",
                Caption = "R CHARTS") +
                theme_gray() +
                theme(legend.position = "none")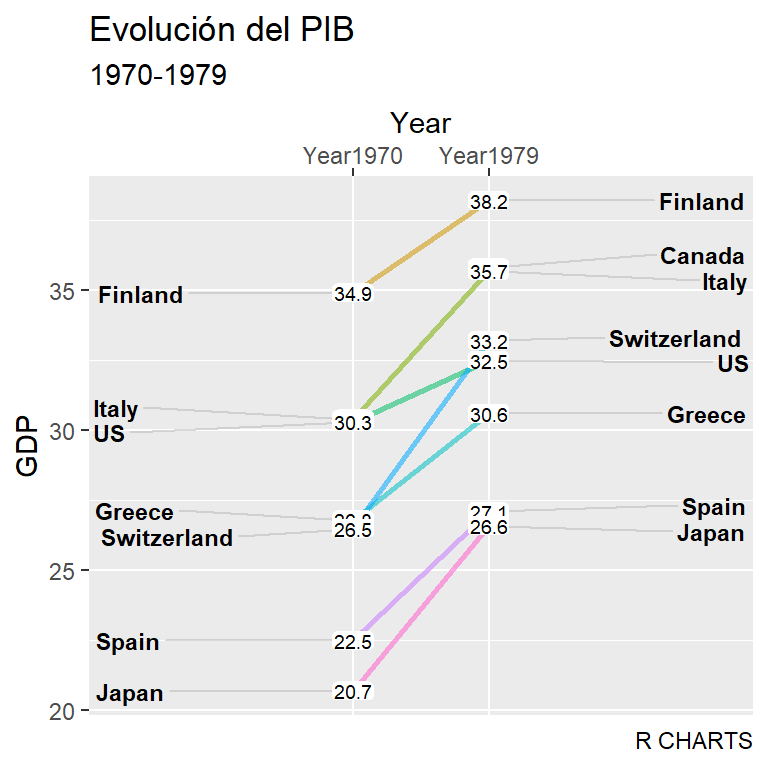

Master Statistics
Aprende estadística desde lo básico hasta técnicas avanzadas, explicado con claridad
Ir al sitio