Sample data
Consider the following subset of the newgdp data frame from the CGPfunctions package, that also contains the function we are going to use in this tutorial.
# install.packages("CGPfunctions")
library(CGPfunctions)

df <- newgdp[16:30, ]
The newggslopegraph function from the CGPfunctions package
Given a data frame with at least three columns that represent the times (X axis), the measurement (Y axis) and the grouping (the different groups) you can create a slope graph in ggplot2 making use of the newggslopegraph from CGPfunctions package passing the data frame and specifying the names of the columns:
# install.packages("CGPfunctions")
library(CGPfunctions)

newggslopegraph(dataframe = df,
                Times = Year,
                Measurement = GDP,
                Grouping = Country)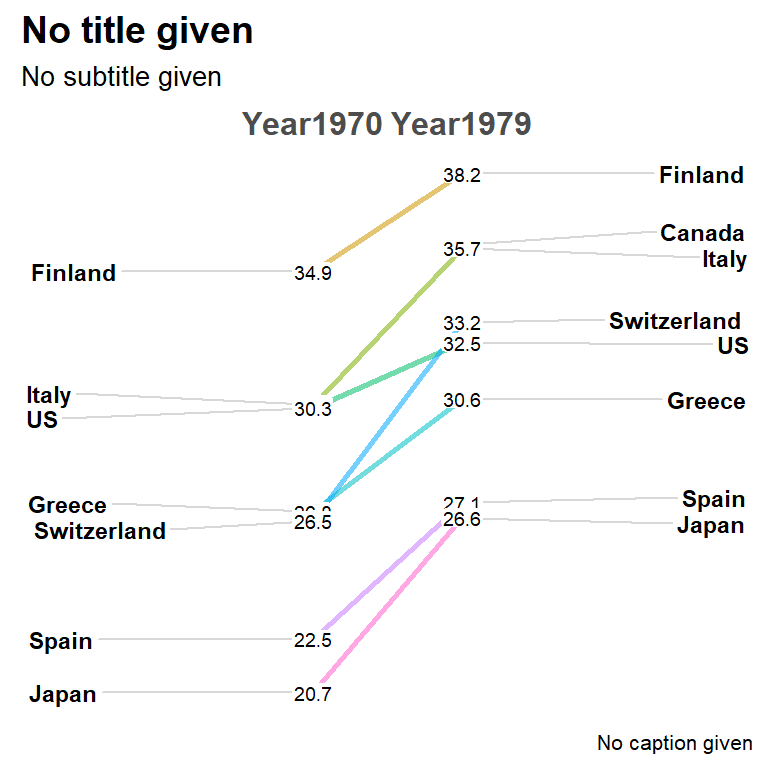
The Data.label argument is an optional argument that can be used to pass a character column to override the plotted values. By default the column passed to Measurement is converted to character and used.
Adding titles
The function displays some titles by default. If you want to change them use the following arguments. Note that if you set them to NULL you can remove the titles.
# install.packages("CGPfunctions")
library(CGPfunctions)

newggslopegraph(df, Year, GDP, Country,
                Title = "GDP evolution",
                SubTitle = "1970-1979",
                Caption = "By R CHARTS")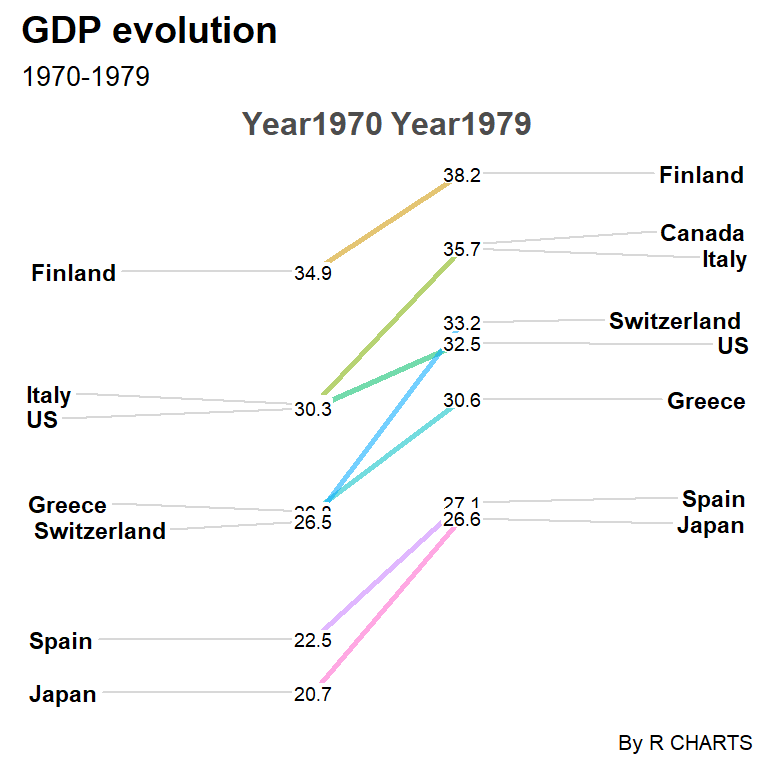
Text sizes and justification
The function also provides lots of arguments to customize the size and alingment of the texts. The argument names are self explanatory.
# install.packages("CGPfunctions")
library(CGPfunctions)

newggslopegraph(df, Year, GDP, Country,
                Title = "GDP evolution",
                SubTitle = "1970-1979",
                Caption = "By R CHARTS",
                XTextSize = 18,    # Size of the times
                YTextSize = 2,     # Size of the groups
                TitleTextSize = 14,
                SubTitleTextSize = 12,
                CaptionTextSize = 10,
                TitleJustify = "right",
                SubTitleJustify = "right",
                CaptionJustify = "left",
                DataTextSize = 2.5) # Size of the data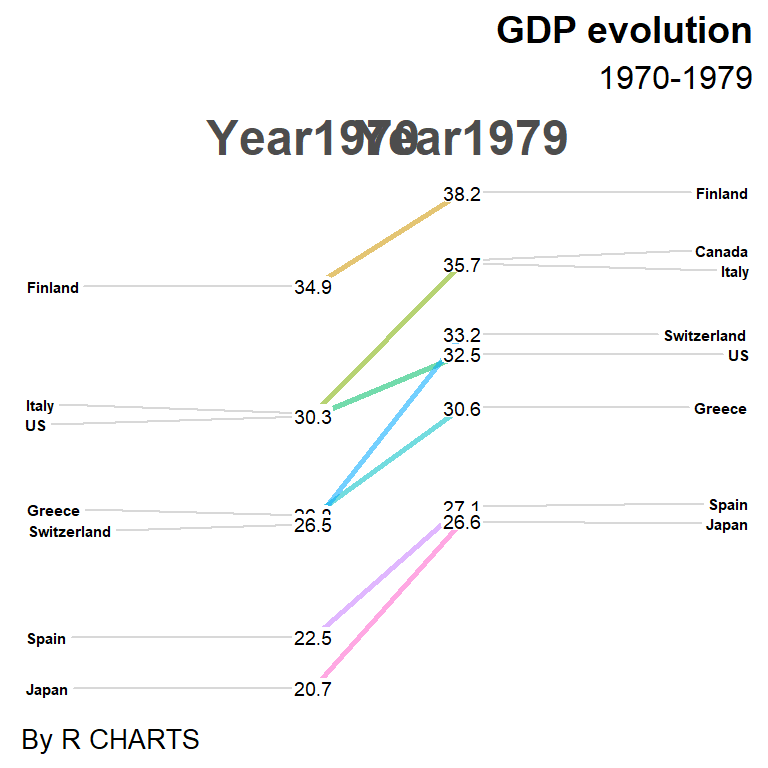
Reverse axes
Note that you can also reverse the axes. Type ?newggslopegraph for additional details.
# install.packages("CGPfunctions")
library(CGPfunctions)

newggslopegraph(df, Year, GDP, Country,
                Title = "GDP evolution",
                SubTitle = "1970-1979",
                Caption = "By R CHARTS",
                ReverseYAxis = TRUE,
ReverseXAxis = FALSE) 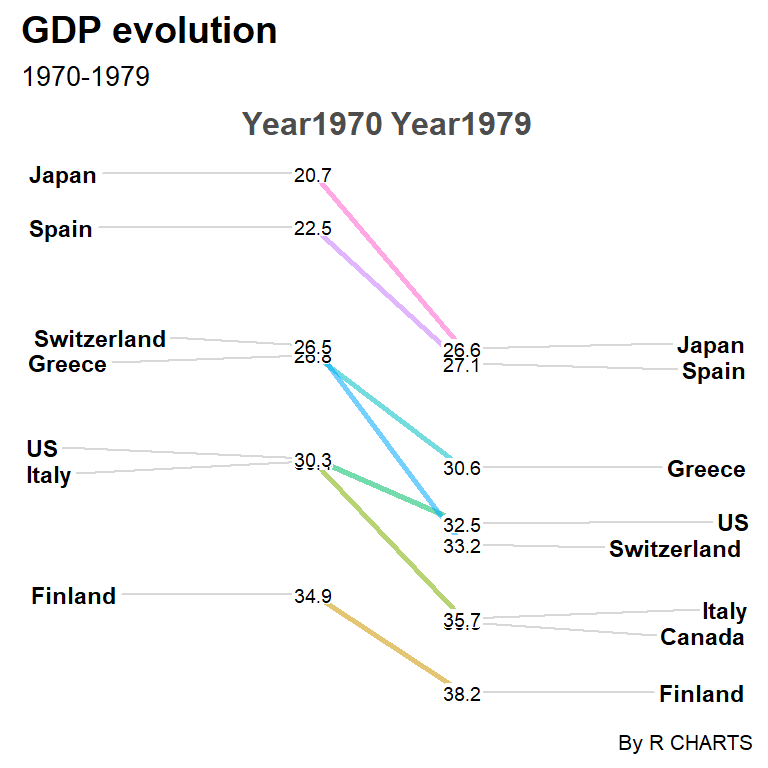
Colors and lines customization
Line tickness
By default, the widths of the lines of the chart are equal to 1, but you can change them with the LineThickness argument.
# install.packages("CGPfunctions")
library(CGPfunctions)

newggslopegraph(df, Year, GDP, Country,
                Title = "GDP evolution",
                SubTitle = "1970-1979",
                Caption = "By R CHARTS",
LineThickness = 0.5) 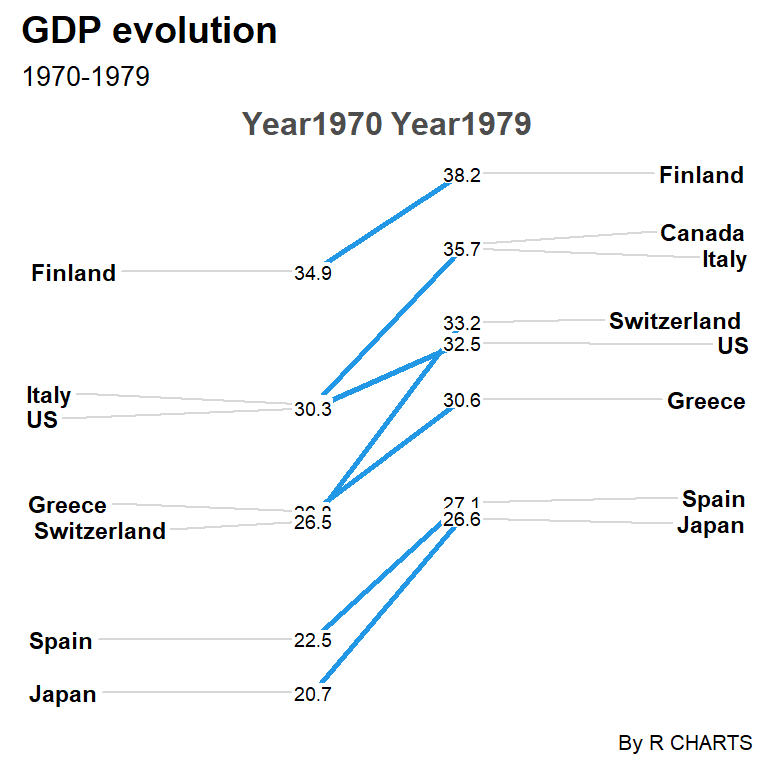
Line color (one color)
The function uses the classic ggplot2 color palette by default. If you want to override this palette you can pass a color to the LineColor argument.
# install.packages("CGPfunctions")
library(CGPfunctions)

newggslopegraph(df, Year, GDP, Country,
                Title = "GDP evolution",
                SubTitle = "1970-1979",
                Caption = "By R CHARTS",
LineColor = 4) 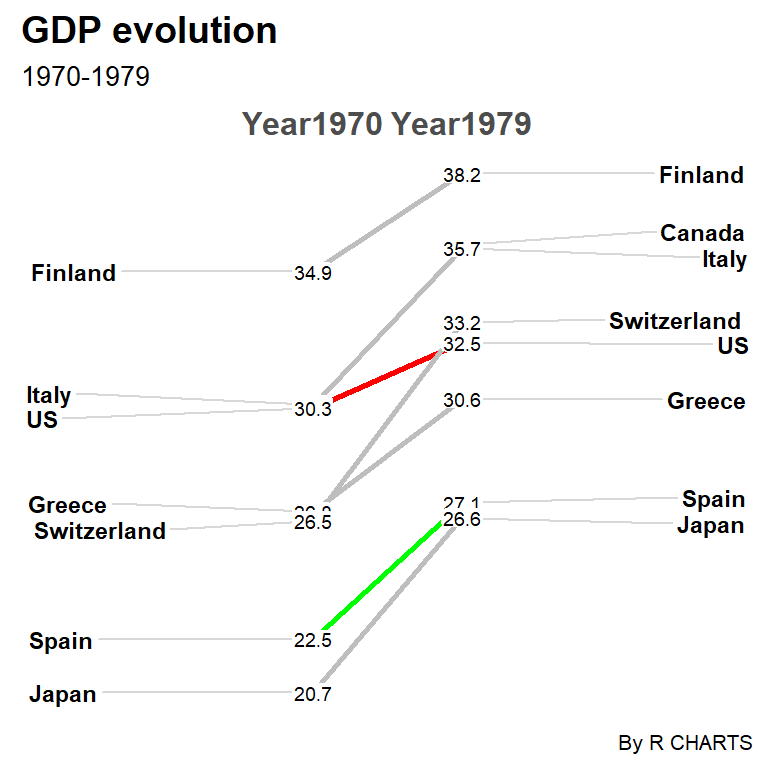
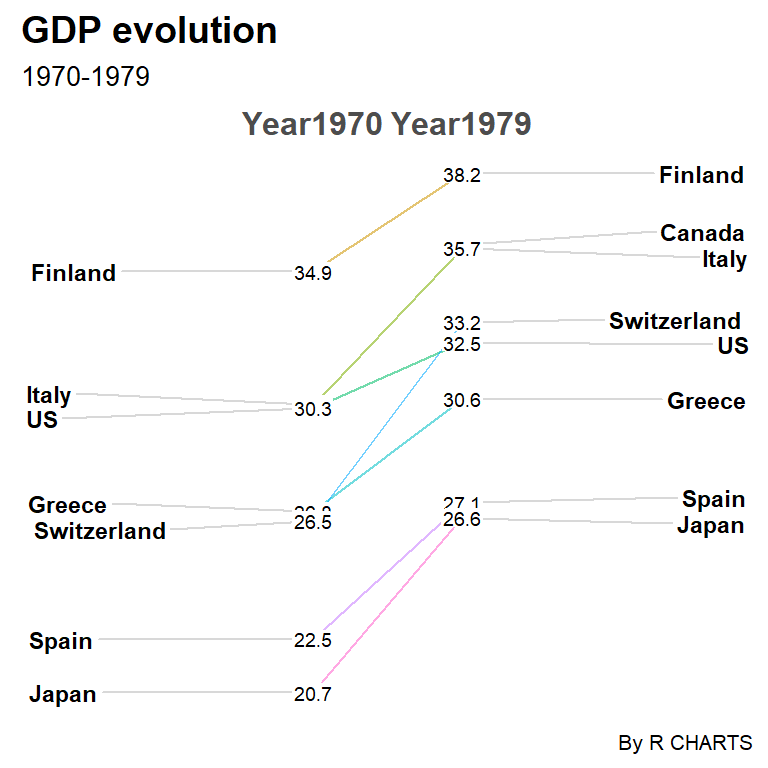
Line color (several colors)
If you want to customize the color for each line you will need to create a named vector with the group names. This can be used to highlight some groups as in the example below.
# install.packages("CGPfunctions")
library(CGPfunctions)

cols <- c("Finland" = "gray", "Canada" = "gray",
          "Italy" = "gray", "US" = "red",
          "Greece" = "gray", "Switzerland" = "gray",
          "Spain" = "green", "Japan" = "gray")

newggslopegraph(df, Year, GDP, Country,
                Title = "GDP evolution",
                SubTitle = "1970-1979",
                Caption = "By R CHARTS",
LineColor = cols) 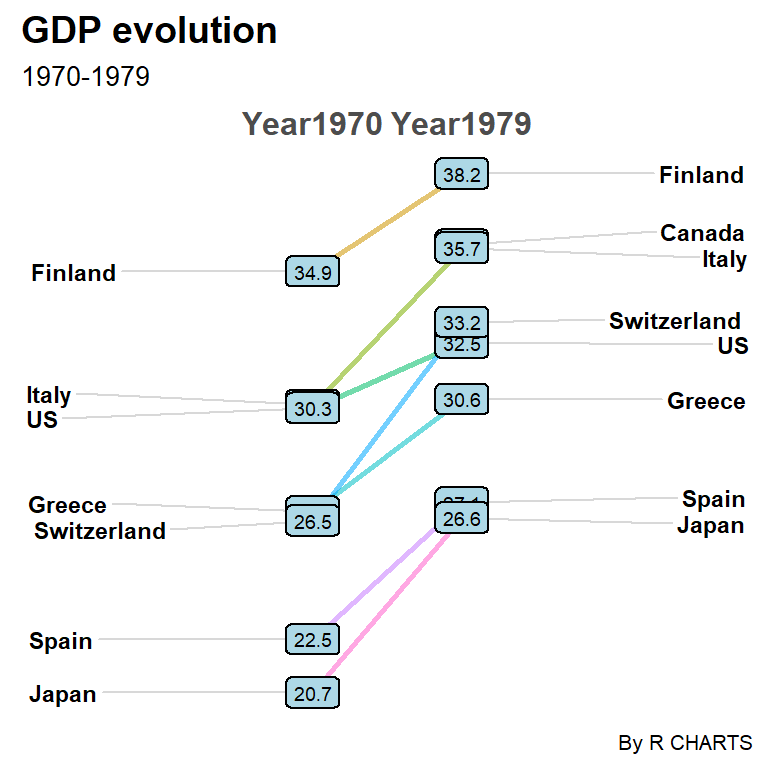
Labels background color
If for some reason you want to highlight the values of the graph you can add a fill color and a border to them. As the default padding is 0 you can also increase it for better visualization.
# install.packages("CGPfunctions")
library(CGPfunctions)

newggslopegraph(df, Year, GDP, Country,
                Title = "GDP evolution",
                SubTitle = "1970-1979",
                Caption = "By R CHARTS",
                DataLabelPadding = 0.2,
                DataLabelLineSize = 0.5,
                DataLabelFillColor = "lightblue")
Themes
Finally, the function also provides the ThemeChoice argument to modify the theme used. The default value is "bw" and the possible options are displayed below.
“ipsum” theme
# install.packages("CGPfunctions")
library(CGPfunctions)
# install.packages("hrbrthemes")

newggslopegraph(df, Year, GDP, Country,
                Title = "GDP evolution",
                SubTitle = "1970-1979",
                Caption = "By R CHARTS",
                ThemeChoice = "ipsum")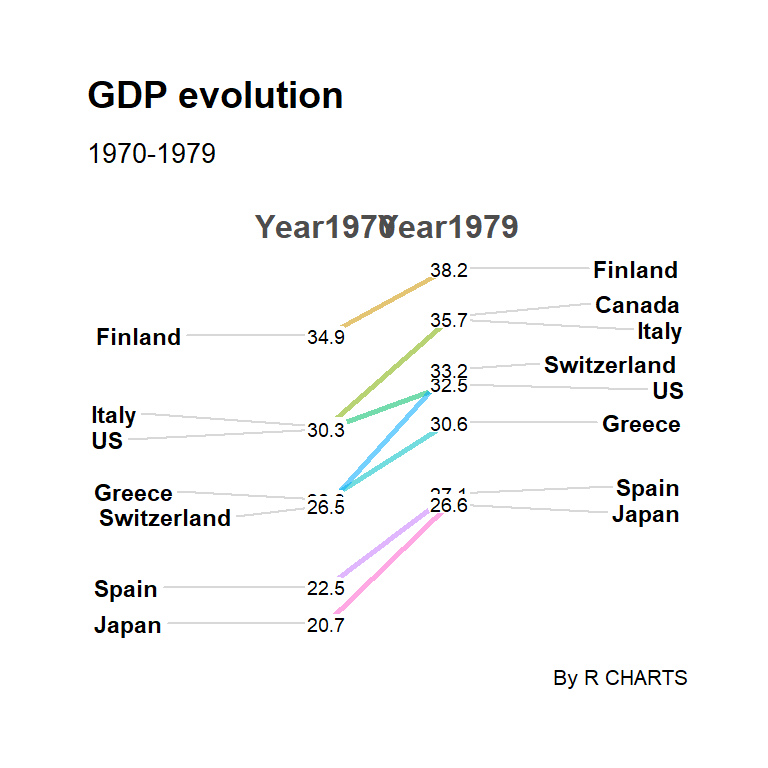
“econ” theme
# install.packages("CGPfunctions")
library(CGPfunctions)
# install.packages("ggthemes")

newggslopegraph(df, Year, GDP, Country,
                Title = "GDP evolution",
                SubTitle = "1970-1979",
                Caption = "By R CHARTS",
                ThemeChoice = "econ")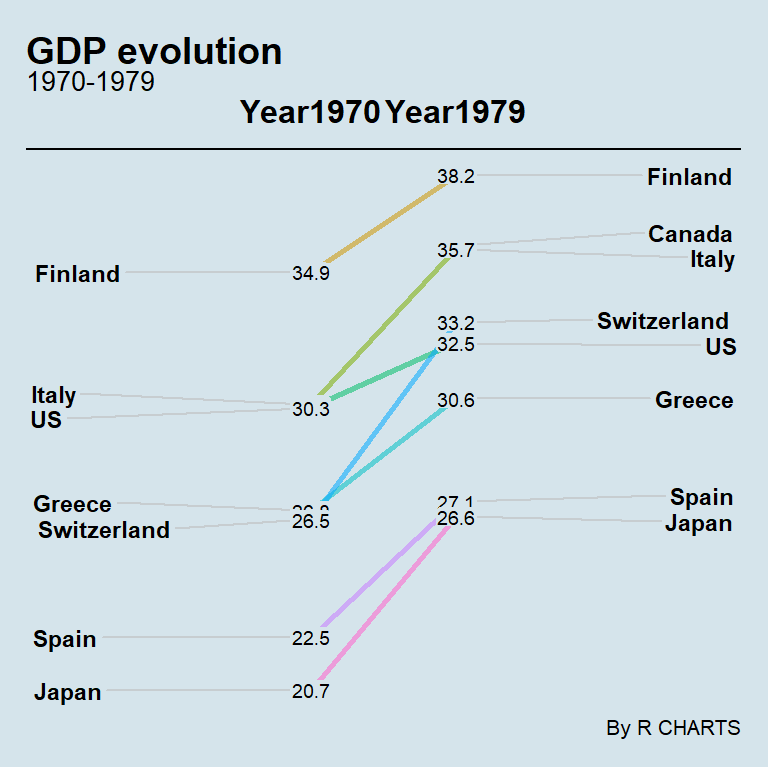
“wsj” theme
# install.packages("CGPfunctions")
library(CGPfunctions)
# install.packages("ggthemes")

newggslopegraph(df, Year, GDP, Country,
                Title = "GDP evolution",
                SubTitle = "1970-1979",
                Caption = "By R CHARTS",
                ThemeChoice = "wsj")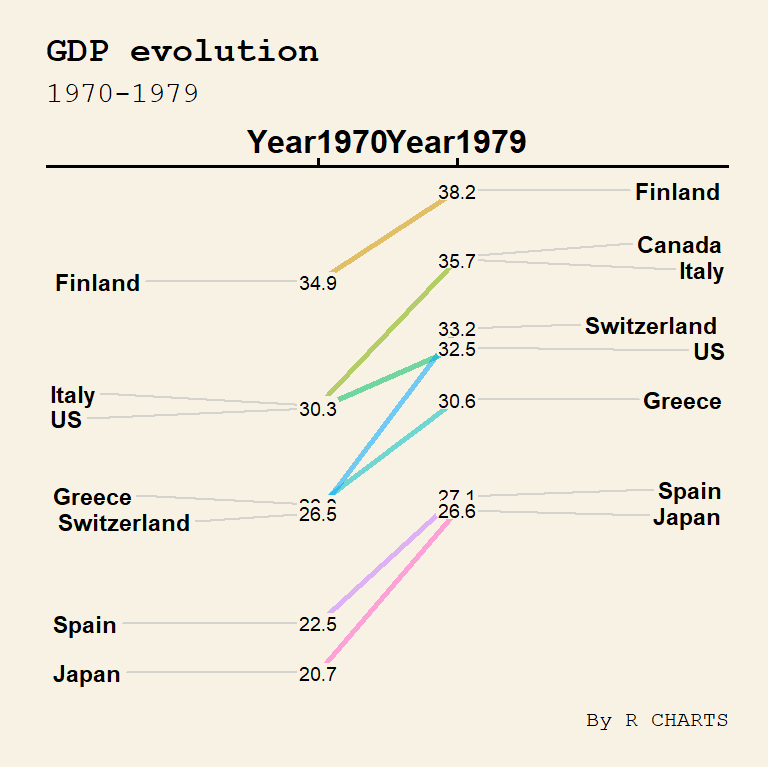
“gdocs” theme
# install.packages("CGPfunctions")
library(CGPfunctions)
# install.packages("ggthemes")

newggslopegraph(df, Year, GDP, Country,
                Title = "GDP evolution",
                SubTitle = "1970-1979",
                Caption = "By R CHARTS",
                ThemeChoice = "gdocs")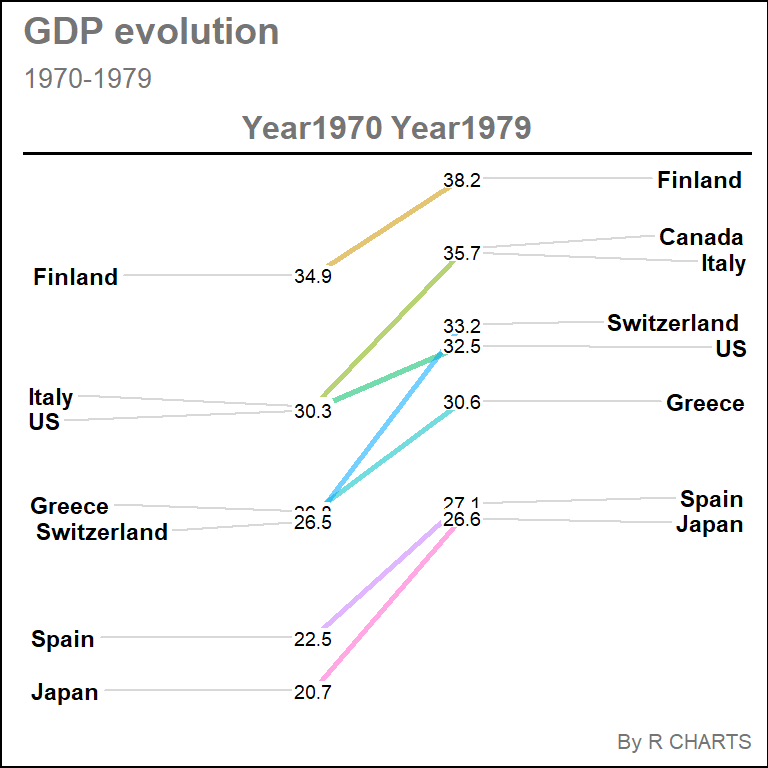
“tufte” theme
# install.packages("CGPfunctions")
library(CGPfunctions)
# install.packages("ggthemes")

newggslopegraph(df, Year, GDP, Country,
                Title = "GDP evolution",
                SubTitle = "1970-1979",
                Caption = "By R CHARTS",
                ThemeChoice = "tufte")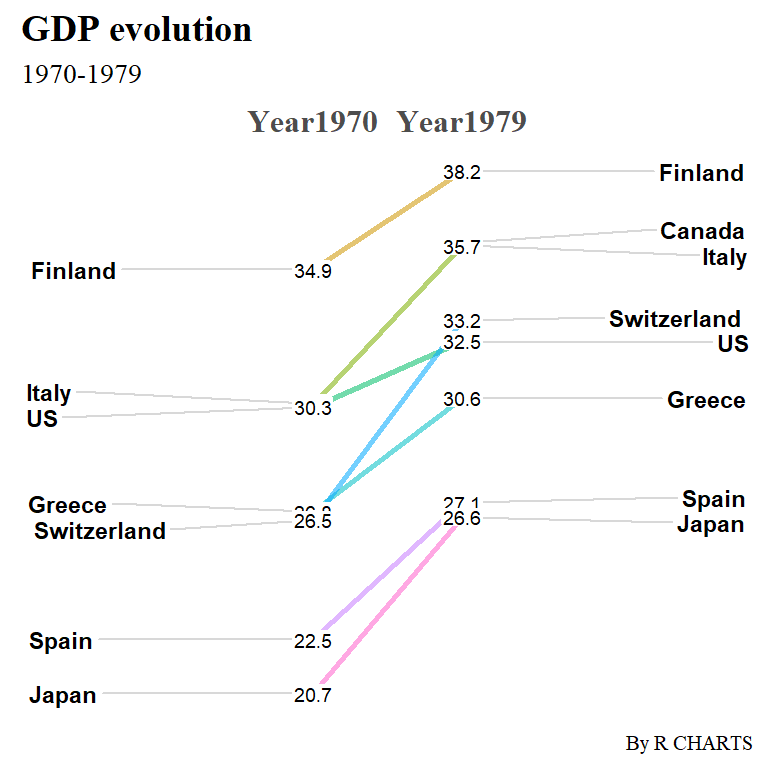
Other themes
As the function is based on ggplot2 you can also add more themes adding a new layer. In the following example we are passing the default ggplot2 theme.
# install.packages("CGPfunctions")
library(CGPfunctions)
# install.packages("ggplot2")
library(ggplot2)

newggslopegraph(df, Year, GDP, Country,
                Title = "GDP evolution",
                SubTitle = "1970-1979",
                Caption = "By R CHARTS") +
                theme_gray() +
                theme(legend.position = "none")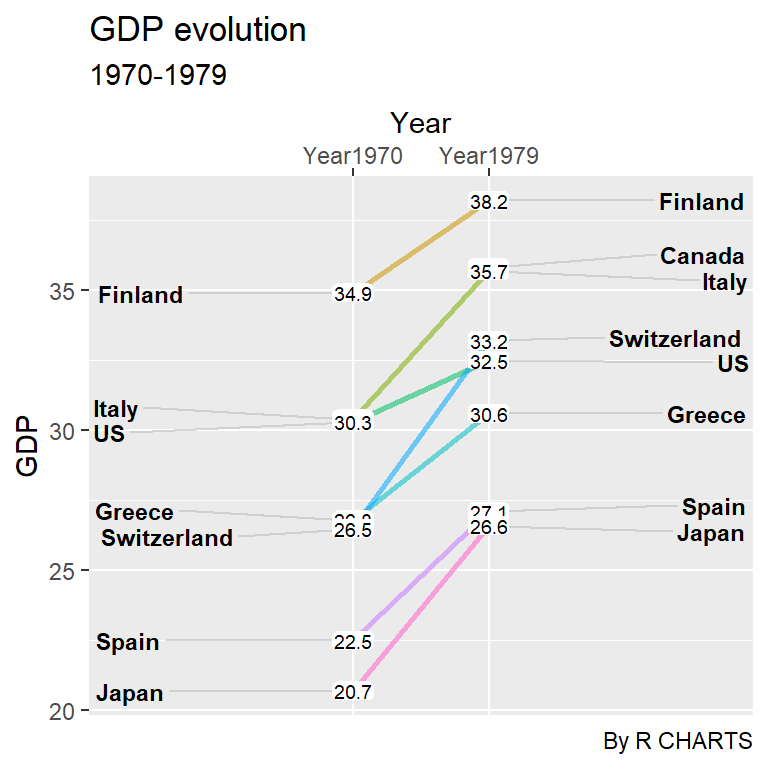

Master Statistics
Learn statistics from the basics to advanced techniques, clearly explained
Go to site