El paquete ggbernie
La librería ggbernie incluye un geom de ggplot2 llamado geom_bernie que permite agregar a Bernie Sanders en gráficos de R. Existen siete imágenes distintas para añadir: "sitting", "stand", "head", "young", "arms", "eyebrows" y "asking", que pueden ser seleccionadas con el argumento bernie.
Bernie “sitting”
# install.packages("remotes")
# remotes::install_github("R-CoderDotCom/ggbernie")
library(ggbernie)

# install.packages("ggplot2")
library(ggplot2)

ggplot(mtcars, aes(mpg, wt)) +
  geom_bernie(bernie = "sitting")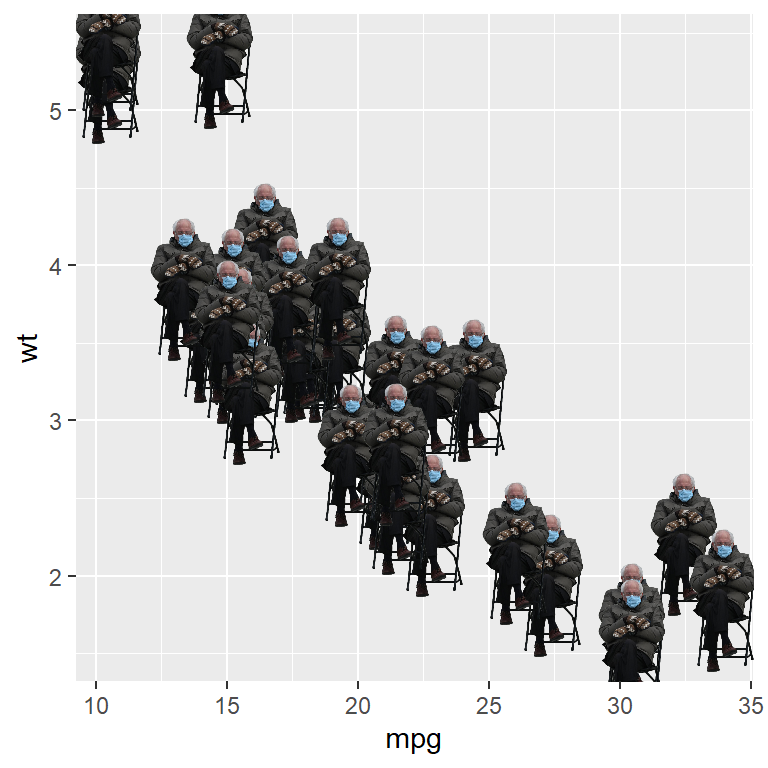
Bernie “standing”
# install.packages("remotes")
# remotes::install_github("R-CoderDotCom/ggbernie")
library(ggbernie)

# install.packages("ggplot2")
library(ggplot2)

ggplot(mtcars, aes(mpg, wt)) +
  geom_bernie(bernie = "stand")
Bernie “head”
# install.packages("remotes")
# remotes::install_github("R-CoderDotCom/ggbernie")
library(ggbernie)

# install.packages("ggplot2")
library(ggplot2)

ggplot(mtcars, aes(mpg, wt)) +
  geom_bernie(bernie = "head")
“Young” Bernie
# install.packages("remotes")
# remotes::install_github("R-CoderDotCom/ggbernie")
library(ggbernie)

# install.packages("ggplot2")
library(ggplot2)

ggplot(mtcars, aes(mpg, wt)) +
  geom_bernie(bernie = "young")
Bernie “arms”
# install.packages("remotes")
# remotes::install_github("R-CoderDotCom/ggbernie")
library(ggbernie)

# install.packages("ggplot2")
library(ggplot2)

ggplot(mtcars, aes(mpg, wt)) +
  geom_bernie(bernie = "arms")
Bernie “eyebrows”
# install.packages("remotes")
# remotes::install_github("R-CoderDotCom/ggbernie")
library(ggbernie)

# install.packages("ggplot2")
library(ggplot2)

ggplot(mtcars, aes(mpg, wt)) +
  geom_bernie(bernie = "eyebrows")
Bernie “asking”
# install.packages("remotes")
# remotes::install_github("R-CoderDotCom/ggbernie")
library(ggbernie)

# install.packages("ggplot2")
library(ggplot2)

ggplot(mtcars, aes(mpg, wt)) +
  geom_bernie(bernie = "asking")
Memes de la comunidad
La comunidad de Twitter Rstats hizo algunos memes con ggbernie. En el siguiente código puedes ver como crear uno de estos BerniePlots.

# install.packages("Ecdat")
library(Ecdat)
# install.packages("tidyverse")
library(tidyverse)
# remotes::install_github("R-CoderDotCom/ggbernie")
library(ggbernie)
# install.packages("gganimate")
library(gganimate)

# Datos
data(incomeInequality)

# Data frame
dat <- incomeInequality %>%
       select(Year, P99, median) %>%
  rename(income_median = median,
         income_99percent = P99) %>%
  pivot_longer(cols = starts_with("income"),
               names_to = "income",
               names_prefix = "income_")

# Gráfico
ggplot(dat, aes(x = Year,
                y = value,
                group = income,
                color = income)) +
  geom_line(size = 2) +
  viridis::scale_color_viridis(discrete = TRUE) +
  ggtitle("Jimmy, make a meme about income inequality") +
  scale_y_continuous(labels = scales::dollar_format()) +
  theme_bw() +
  geom_bernie(bernie = "sitting") +
  ylab("That's a lot of pastrami sandwiches!") +
  transition_reveal(Year)
