Gatos disponibles
El paquete proporciona un geom llamado geom_cat y se pueden seleccionar 15 archivos PNG diferentes con gatos populares. Estos gatos son "nyancat" (por defecto), "bongo", "colonel", "grumpy", "hipster", "lil_bub", "maru", "mouth", "pop", "pop_close", "pusheen", "pusheen_pc", "toast", "venus" y "shironeko". Puedes ver todas las opciones en la siguiente imagen.
# install.packages("remotes")
# remotes::install_github("R-CoderDotCom/ggcats@main")
library(ggcats)
# install.packages("ggplot2")
library(ggplot2)

grid <- expand.grid(1:5, 3:1)

df <- data.frame(x = grid[, 1],
                 y = grid[, 2],
                 image = c("nyancat", "bongo",
                           "colonel", "grumpy",
                           "hipster", "lil_bub",
                           "maru", "mouth",
                           "pop", "pop_close",
                           "pusheen", "pusheen_pc",
                           "toast", "venus",
                           "shironeko"))

ggplot(df) +
 geom_cat(aes(x, y, cat = image), size = 5) +
    geom_text(aes(x, y - 0.5, label = image), size = 2.5) +
    xlim(c(0.25, 5.5)) +
    ylim(c(0.25, 3.5))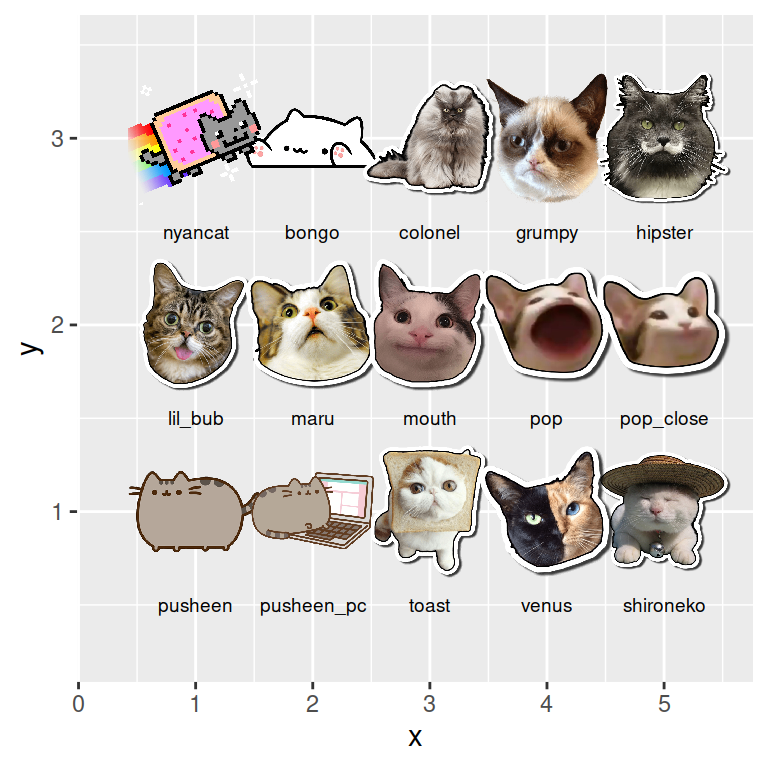
Gráficos de dispersión
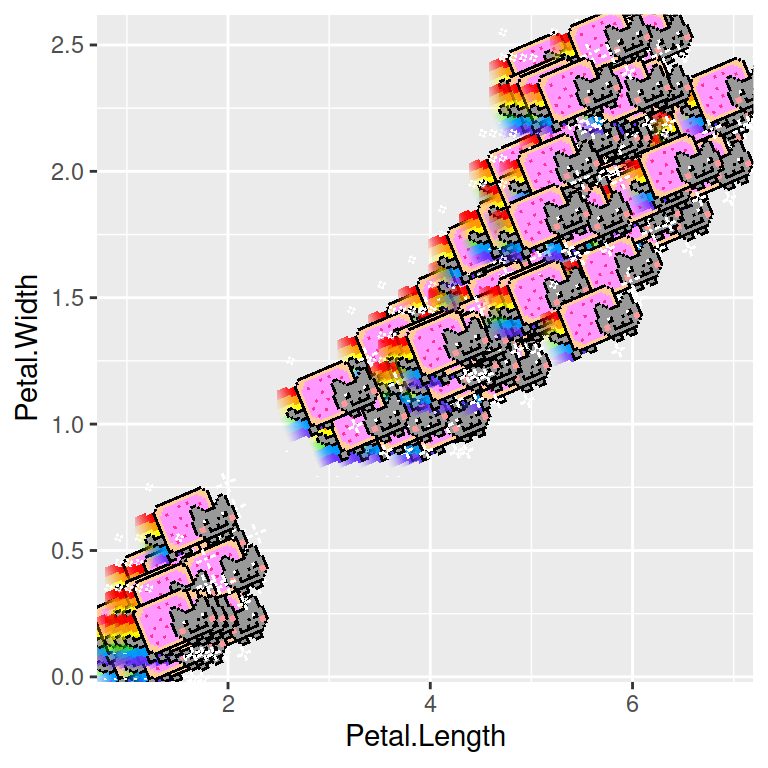
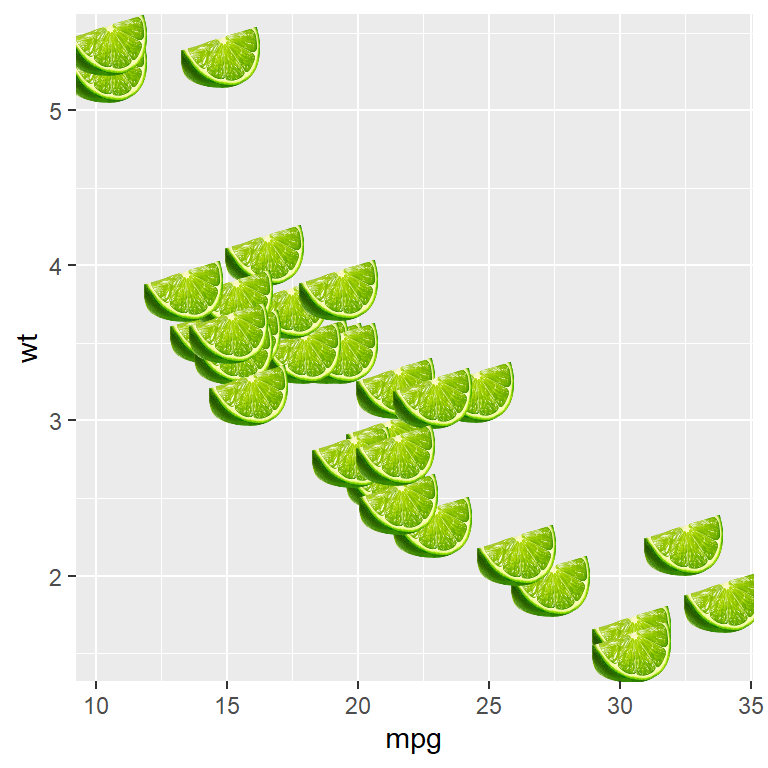
Puedes crear un gráfico de dispersión de la misma manera que usando geom_point. Elige un gato con el argumento cat y modifica los argumentos que quieras para crear el gráfico.
# install.packages("remotes")
# remotes::install_github("R-CoderDotCom/ggcats@main")
library(ggcats)
# install.packages("ggplot2")
library(ggplot2)

# Gráfico de dispersión
ggplot(iris, aes(Petal.Length, Petal.Width)) +
 geom_cat(cat = "nyancat", size = 4)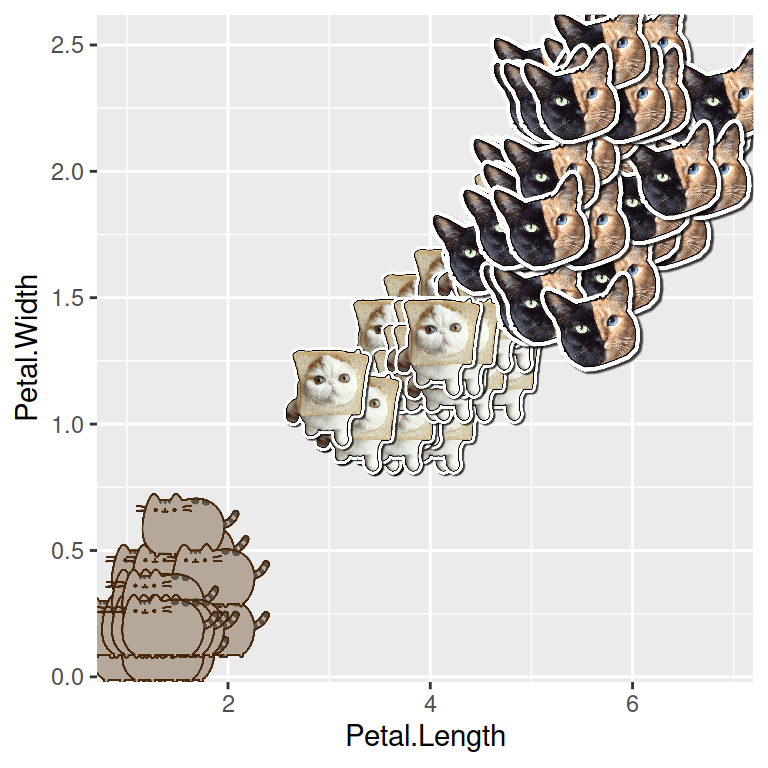
También puedes agregar distintos gatos en base a grupos. Para ello necesitas pasar la variable con los nombres de los gatos al argumento cat.
# install.packages("remotes")
# remotes::install_github("R-CoderDotCom/ggcats@main")
library(ggcats)
# install.packages("ggplot2")
library(ggplot2)

# Crea una nueva columna
iris$cat <- factor(iris$Species,
                   labels = c("pusheen", "toast",
                              "venus"))

# Gráfico de dispersión por grupo
ggplot(iris, aes(Petal.Length, Petal.Width)) +
 geom_cat(aes(cat = cat), size = 4)
Animaciones
Un uso especialmente interesante para ggcats es crear animaciones. Esto es particularmente divertido si se combinan "pop" y "pop_close" como en el ejemplo siguiente.
# install.packages("Ecdat")
library(Ecdat)
# install.packages("tidyverse")
library(tidyverse)
# install.packages("gganimate")
library(gganimate)
# install.packages("remotes")
# remotes::install_github("R-CoderDotCom/ggcats@main")
library(ggcats)

# Data frame
 dat <-
   incomeInequality %>%
   select(Year, P99, median) %>%
   rename(income_median = median,
          income_99percent = P99) %>%
   pivot_longer(cols = starts_with("income"),
                names_to = "income",
                names_prefix = "income_")

# Gatos para cada línea
dat$cat <- rep(NA, 132)
dat$cat[which(dat$income == "median")] <- "nyancat"
dat$cat[which(dat$income == "99percent")] <- rep(c("pop_close", "pop"), 33)

# Animación
ggplot(dat, aes(x = Year, y = value, group = income, color = income)) +
   geom_line(size = 2) +
   ggtitle("ggcats, a core package of the memeverse") +
   geom_cat(aes(cat = cat), size = 5) +
   xlab("Cats") +
   ylab("Cats") +
   theme(legend.position = "none",
         plot.title = element_text(size = 20),
         axis.text = element_blank(),
         axis.ticks = element_blank()) +
   transition_reveal(Year)

Master Statistics
Aprende estadística desde lo básico hasta técnicas avanzadas, explicado con claridad
Ir al sitio