By default, base R charts have a white background. However, you can customize the plot background, the plot region color or both.
Background color of the plot area
You can customize all the background color of the entire plot area with the bg argument of the par function. This will override all the background color of your plots unless you set back to the original graphical parameters.
# Data
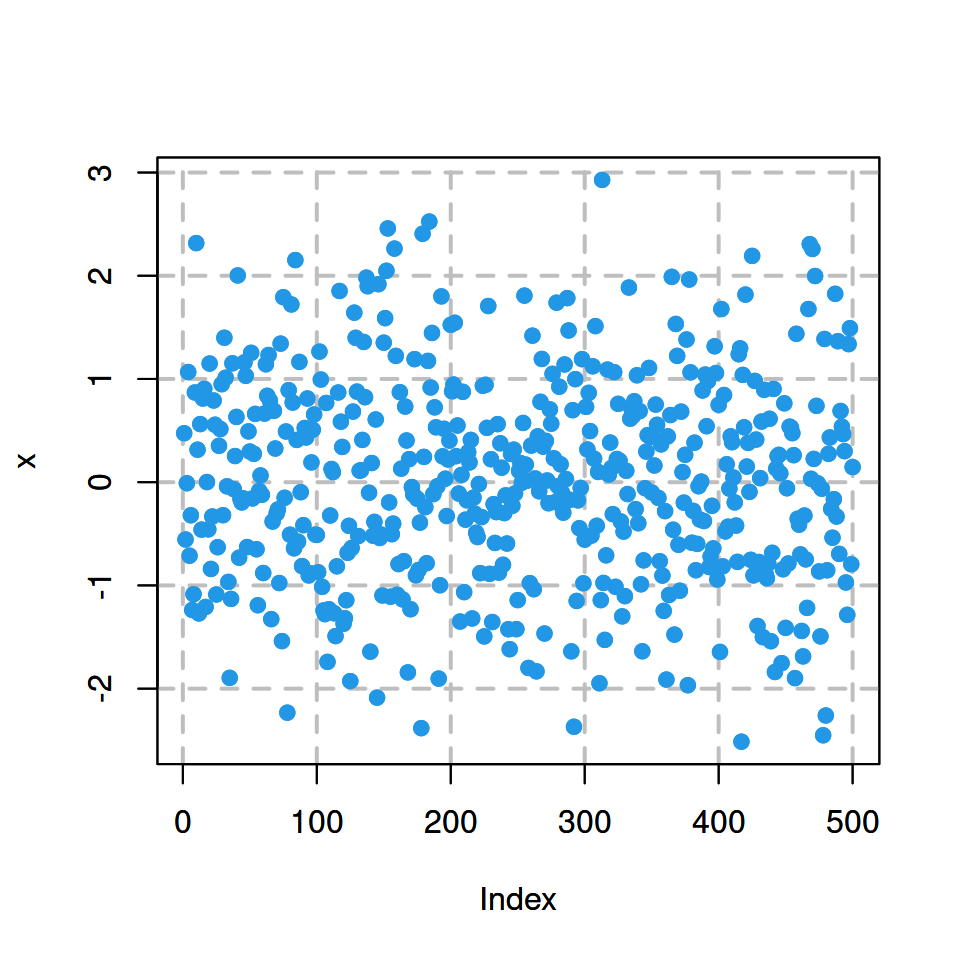
set.seed(2)
x <- rnorm(100)
# Light gray background color
par(bg = "#f7f7f7")
# Add the plot
boxplot(x, col = "blue")
# Back to the original color
par(bg = "white")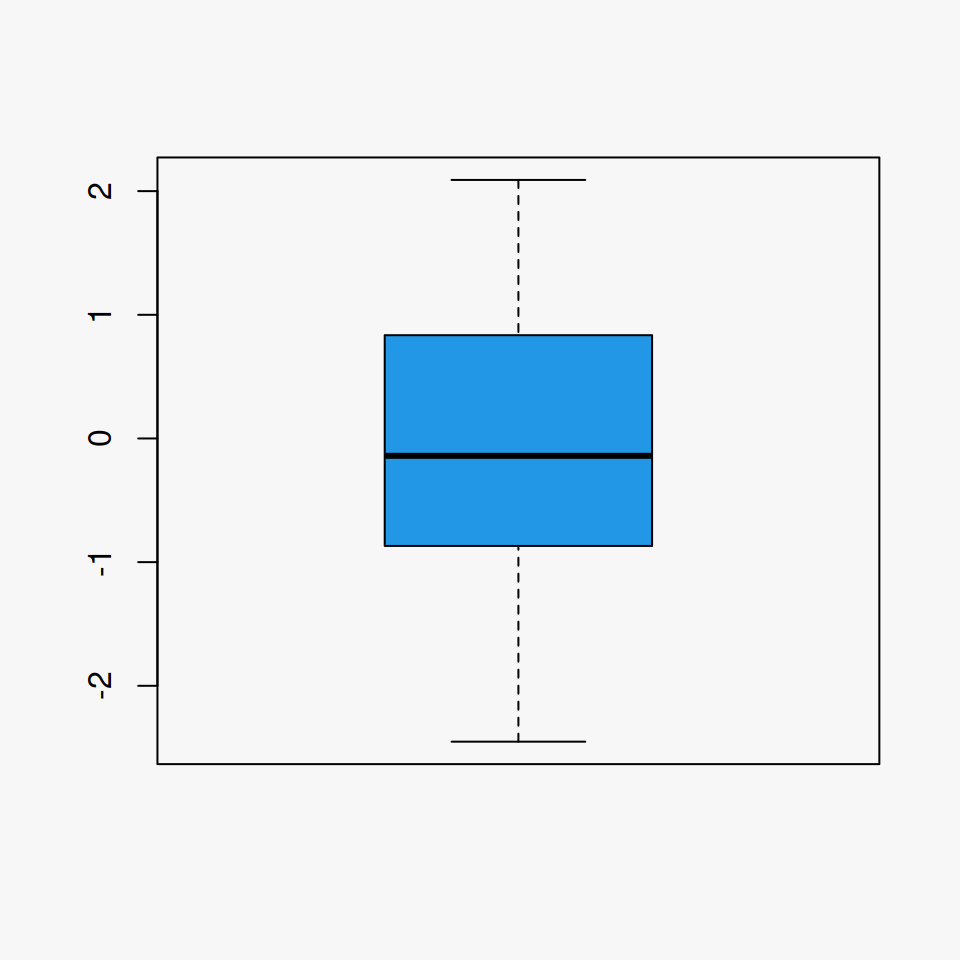
Background color of the plot region
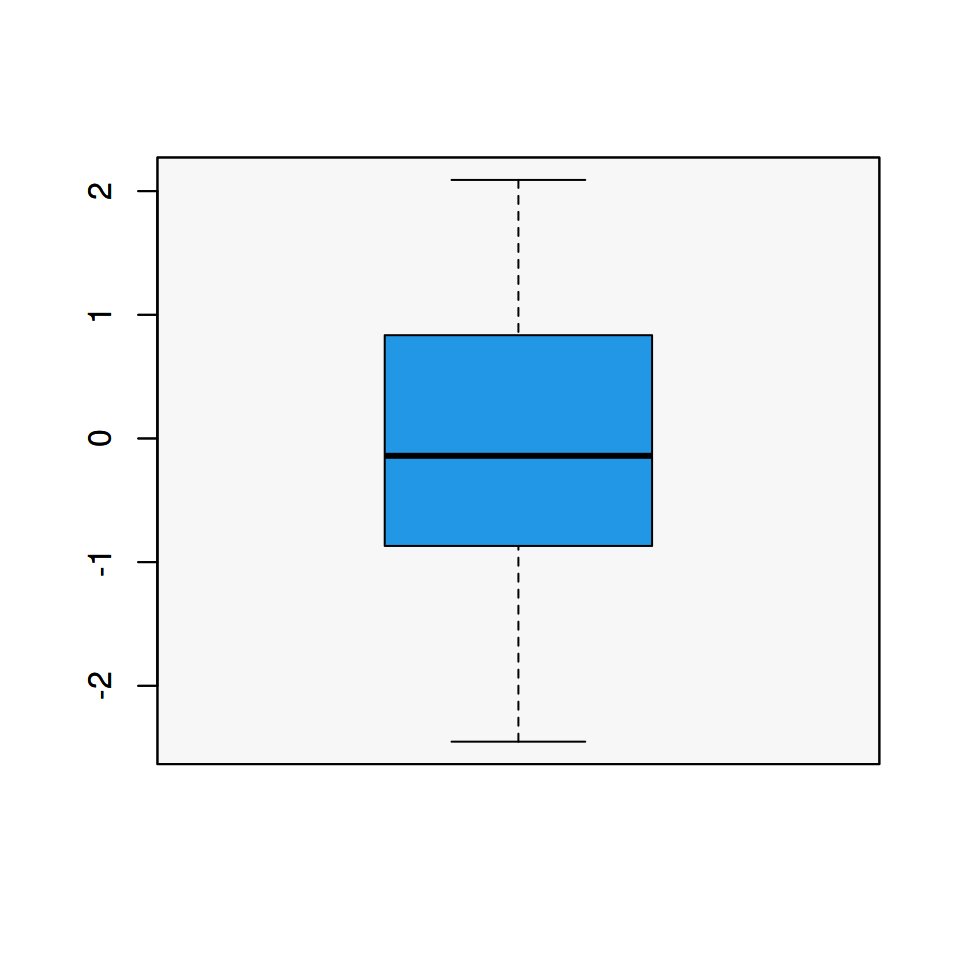
A more aesthetic option is to change only the color of the plot region (also known as plot panel). This can be achieved making use of the rect function, specifying the coordinates of the plot region and a color.
# Data
set.seed(2)
x <- rnorm(100)

# Create basic plot
boxplot(x)

# Plot region color
rect(par("usr")[1], par("usr")[3],
     par("usr")[2], par("usr")[4],
     col = "#f7f7f7") # Color

# Add a new plot
par(new = TRUE)

# Create your plot
boxplot(x, col = 4)
Plot area and plot region background color
The last option is specifying a different color for the plot and for the plot region. This can be achieved merging the approaches described above.
# Data
set.seed(2)
x <- rnorm(100)

# Aliceblue background color
par(bg = "aliceblue")

# Create basic plot
boxplot(x)

# Change the plot region color
rect(par("usr")[1], par("usr")[3],
     par("usr")[2], par("usr")[4],
     col = "#f7f7f7") # Color

# Add a new plot
par(new = TRUE)

# Create your plot
boxplot(x, col = 4)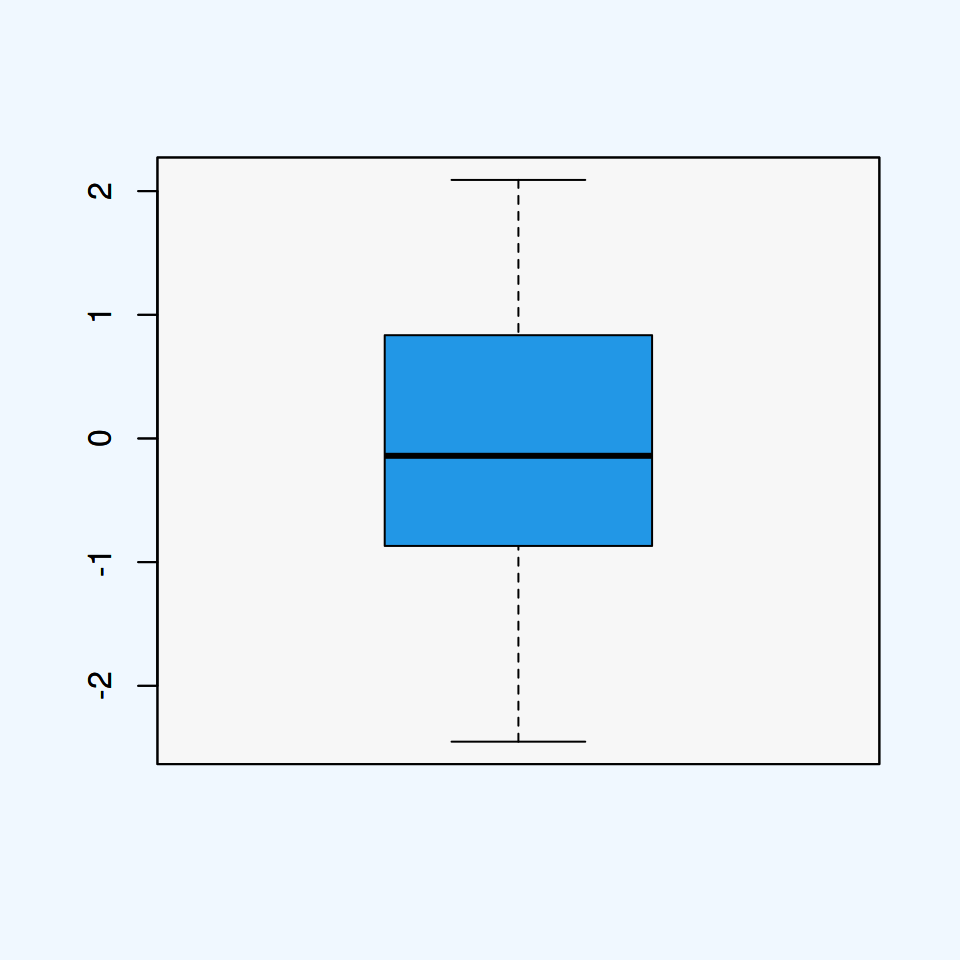
Color picker
Use the color pickers to change the panel area (left) and the plot region (right), or to generate random colors pressing the blue button. Then you can copy the colors and use them in your plots.

Master Statistics
Learn statistics from the basics to advanced techniques, clearly explained
Go to site