CUSTOMIZATION
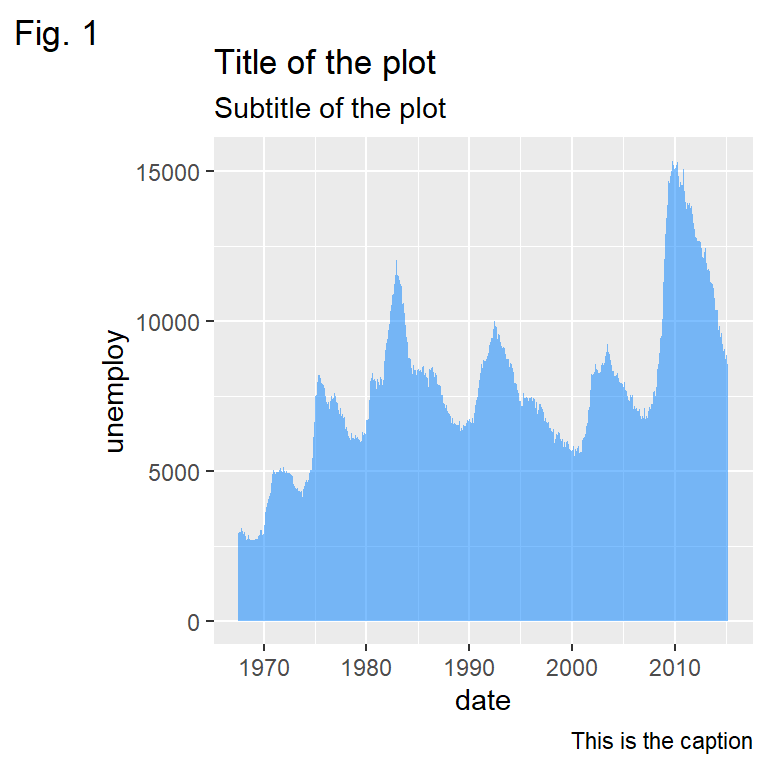
The ggplot2 package allows customizing the charts with themes. It is possible to customize everything of a plot, such as the colors, line types, fonts, alignments, among others, with the components of the theme function. In addition, there are several functions you can use to customize the graphs adding titles, subtitles, lines, arrows or texts.


ALL GGPLOT2 CHARTS
The following list contains all the ggplot2 tutorials of this site. Each tutorial contains the reproducible code of different customizations of the same or equivalent chart. If you want to filter them choose a category and select ggplot2.