Sample data
The data used in the examples below is the following:
# Data
set.seed(123)
x <- 1:50
y <- x + rnorm(50, sd = 10)
groups <- sample(letters, 50, replace = TRUE)
The text function
Adding text
You can add texts to base R plots with the text function. You just need to pass the coordinates and the text you want to add.
plot(x, y, pch = 19, col = 4)
text(x = 10, y = 50, # Coordinates
     label = "Text annotation")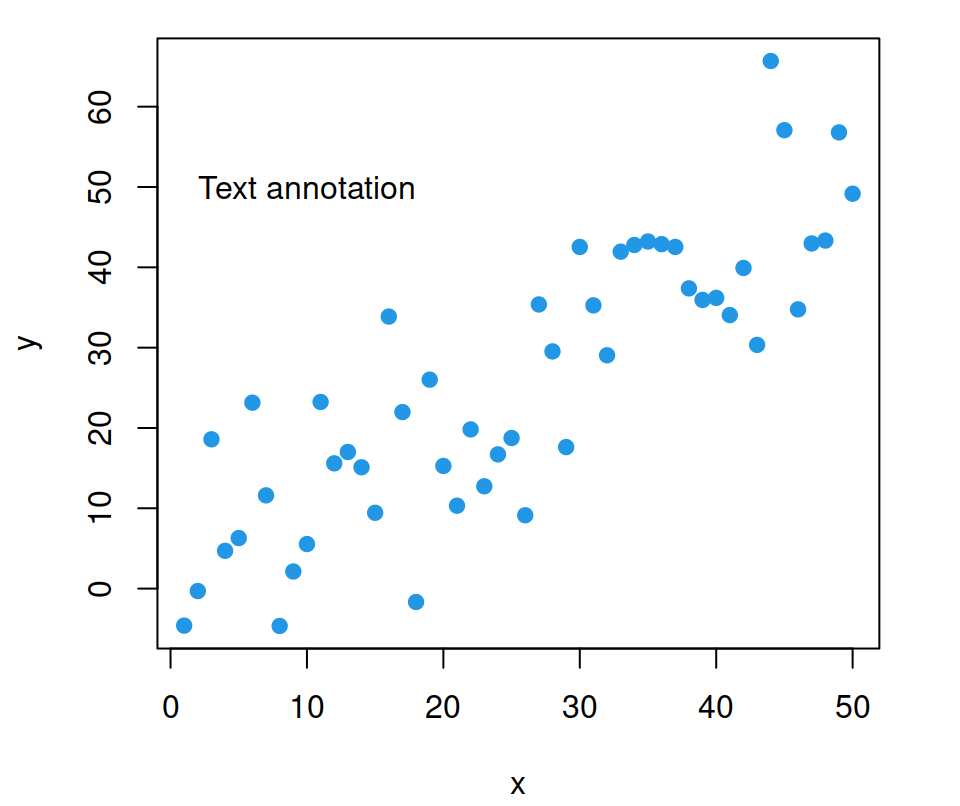
Text customization
The added text can be customized with the graphical parameters, such as col, for the color, font for the font style or cex for the text size.
plot(x, y, pch = 19, col = 4)
text(x = 15, y = 50, label = "Text annotation",
     col = "red",   # Color of the text
     font = 2,      # Bold face
     cex = 1.5)     # Size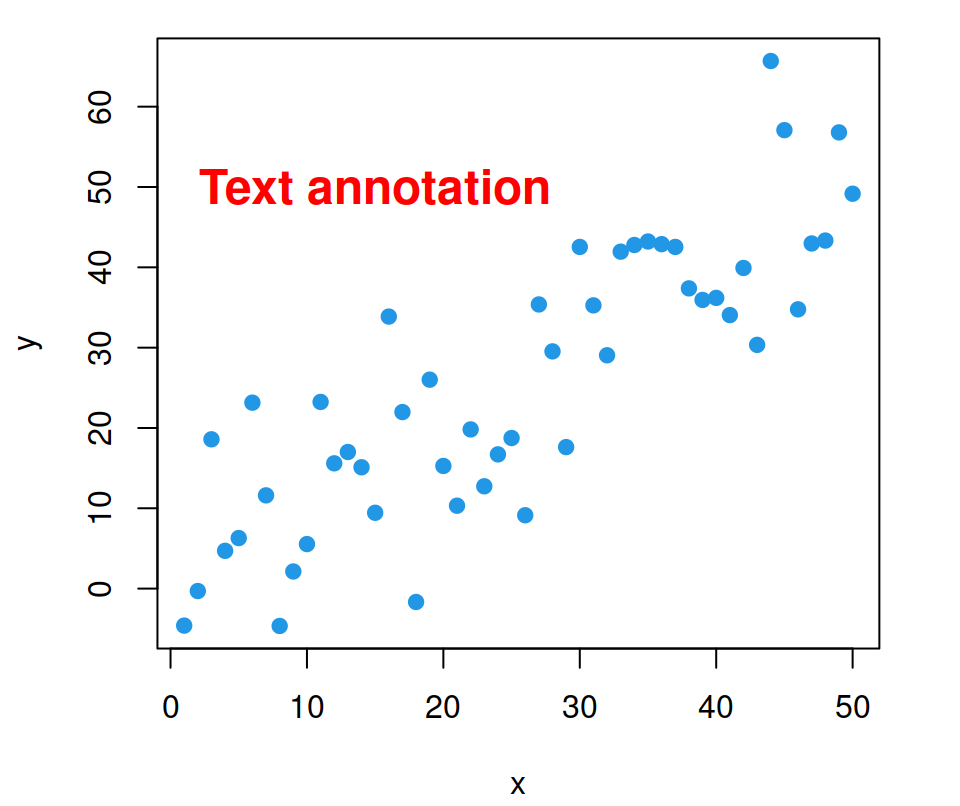
Text rotation
You can also rotate the text setting a degree or rotation with the srt argument.
plot(x, y, pch = 19, col = 4)

# Rotate 45 degrees
text(x = 15, y = 50, label = "Text annotation",
     srt = 45) # Rotation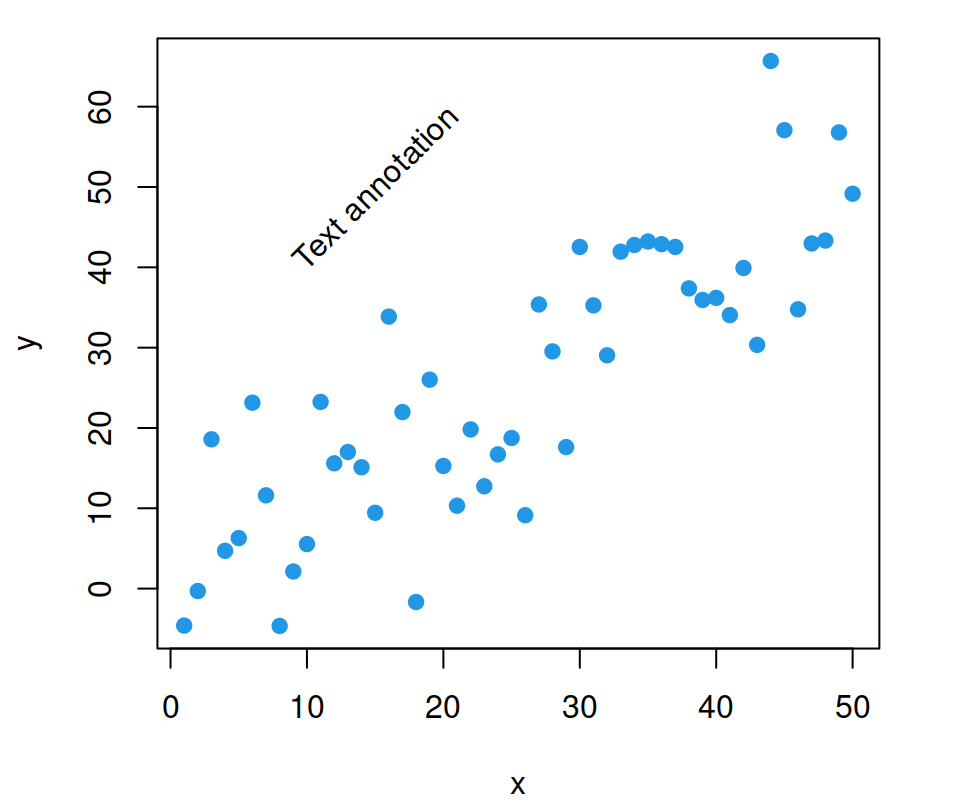
Text splitting
Finally, it is worth to mention that you can split the text in several lines with "\n".
plot(x, y, pch = 19, col = 4)

# Split the text in several lines
text(x = 15, y = 50,
     label = "Text\n annotation") # Split text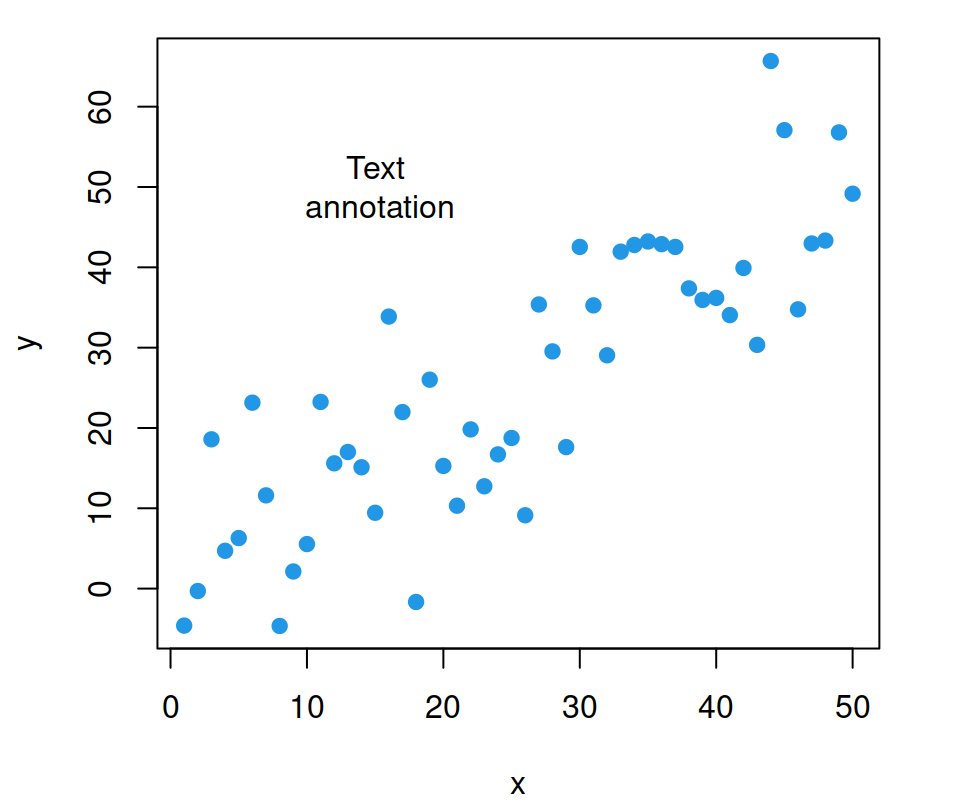
Label points

If you have a grouping variable you can pass it to the labels argument of the text function to label the observations. You can set the position specifying the variables and fine-tuning them.
plot(x, y, pch = 19, col = 4,
     ylim = c(-10, 70)) # Change axis limits
text(x = x, y = y - 3,  # Fine-tune the position
     label = groups)
The mtext function
The mtext function can be used to add text to all sides of a plot, which can be specified using the side argument.
| side | Position |
|---|---|
| 1 | bottom |
| 2 | left |
| 3 | top |
| 4 | right |
Bottom text
plot(x, y, pch = 19, col = 4)

# Bottom-center
mtext("Bottom text", side = 1)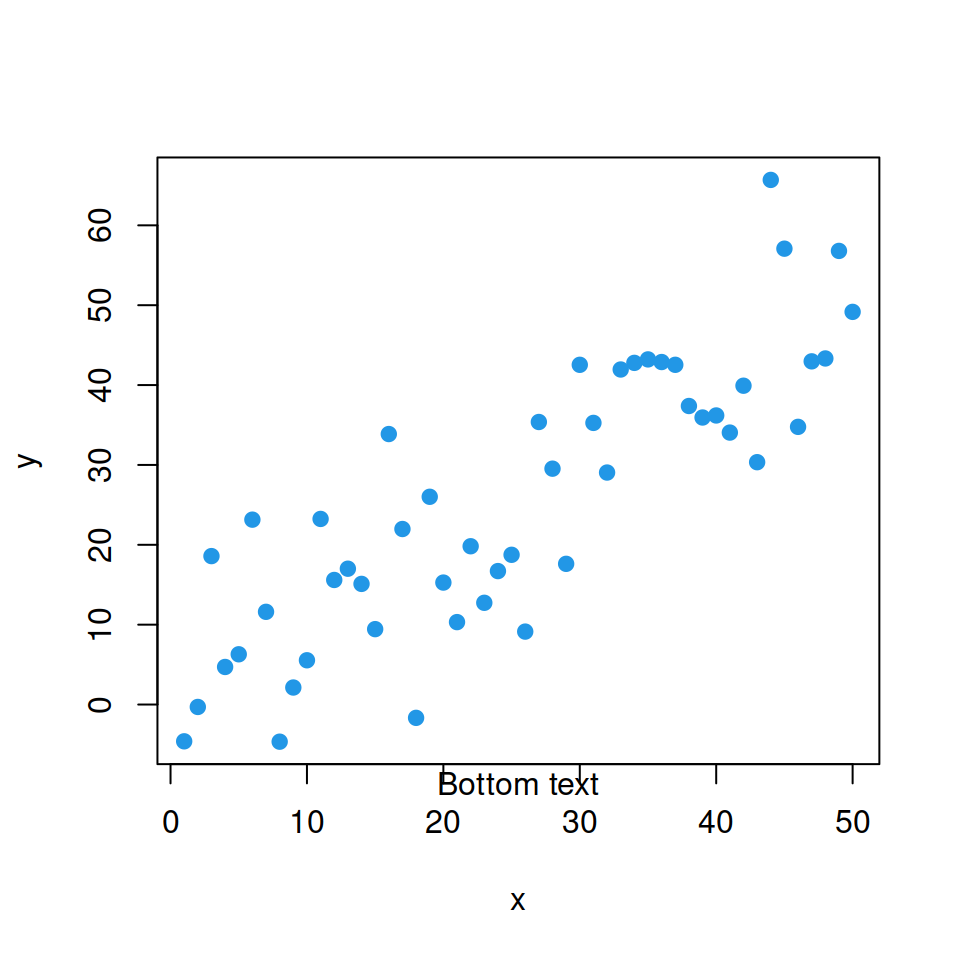
Left text
plot(x, y, pch = 19, col = 4)

# Left-center
mtext("Left text", side = 2)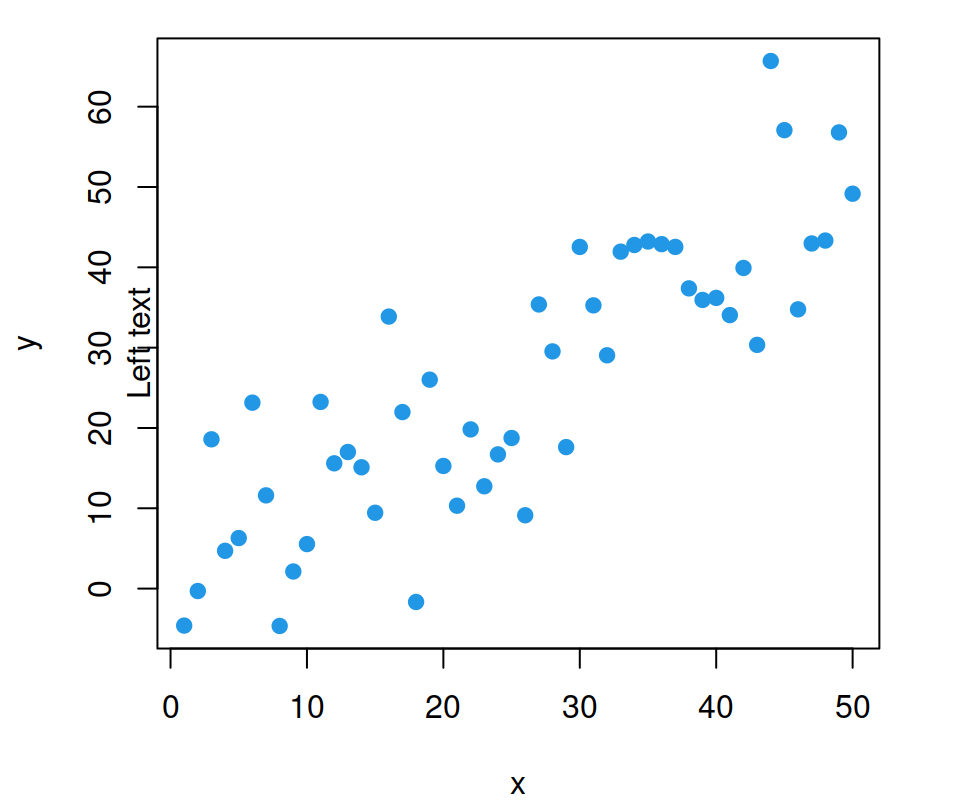
Top text
plot(x, y, pch = 19, col = 4)

# Top-center
mtext("Top text", side = 3)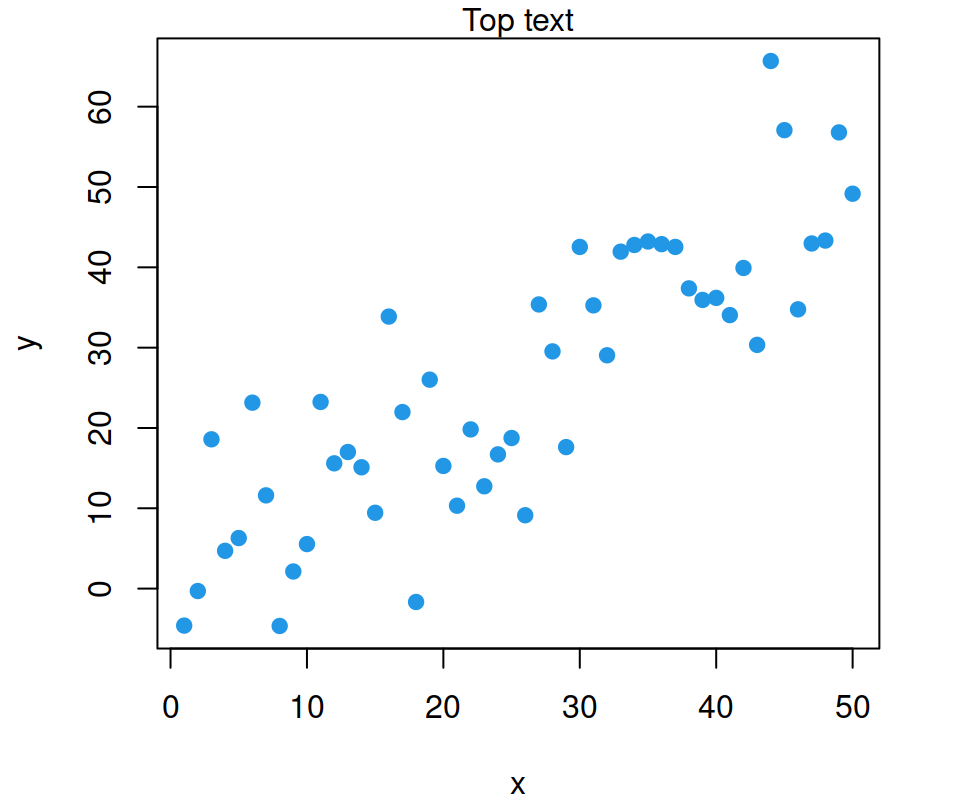
Right text
plot(x, y, pch = 19, col = 4)

# Right-center
mtext("Right text", side = 4)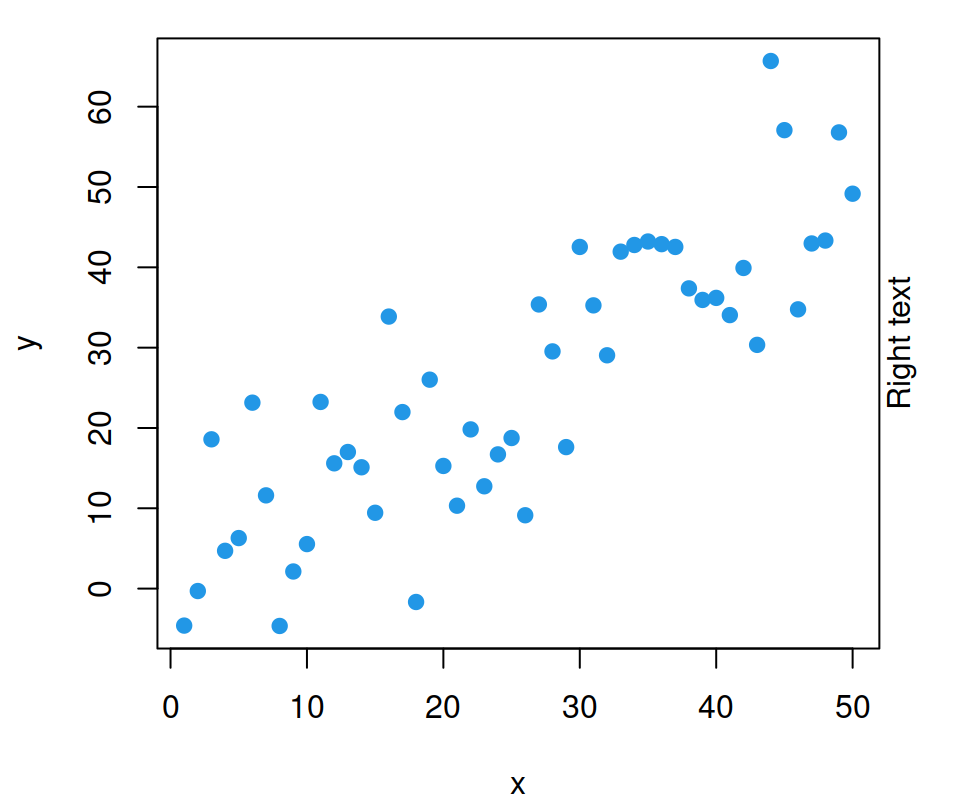
mtext adjustment
There are several arguments that you can customize. The most relevant are:
line, to set the margin line where to set the text. Default value is 0.adj, to adjust the text in the reading direction from 0 to 1 (default value is 0.5).at, to indicate where to draw the text based on the corresponding axis.- Other graphical parameters related to texts such as
col,cex,familyandfont.
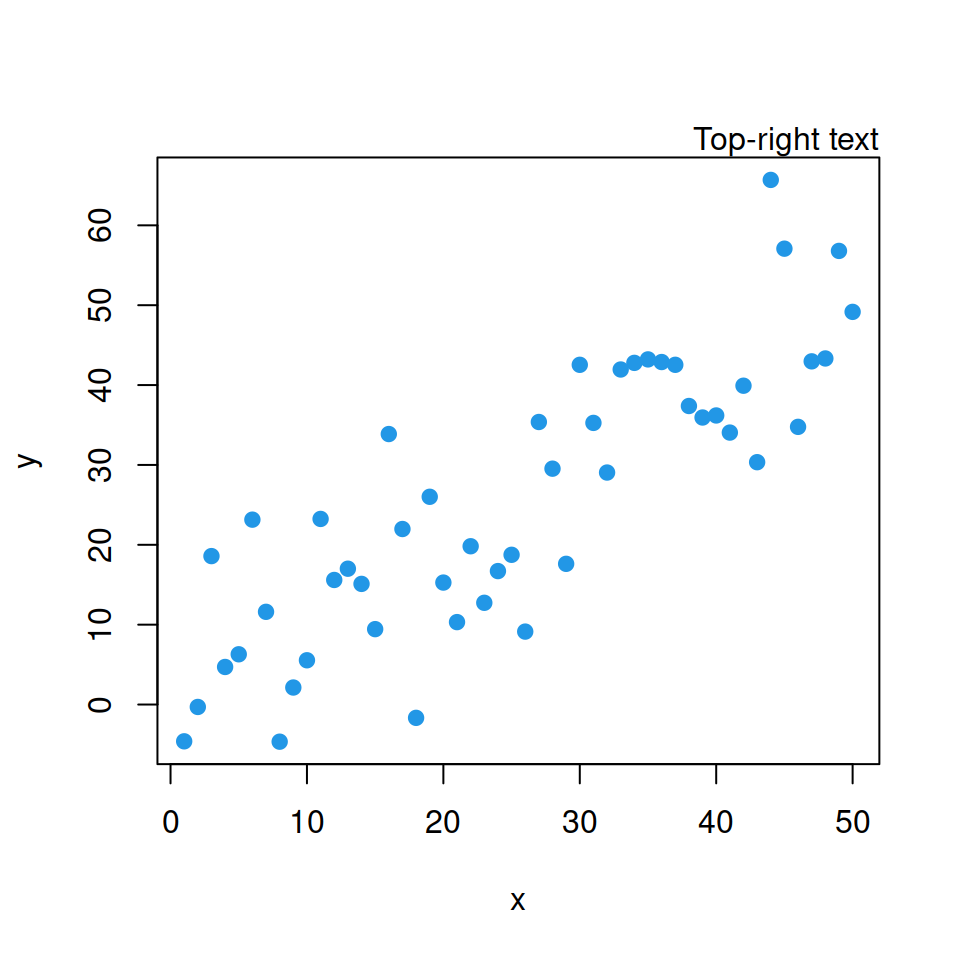
Top-right text
plot(x, y, pch = 19, col = 4)

# Top-right text
mtext("Top-right text",
      side = 3, adj = 1)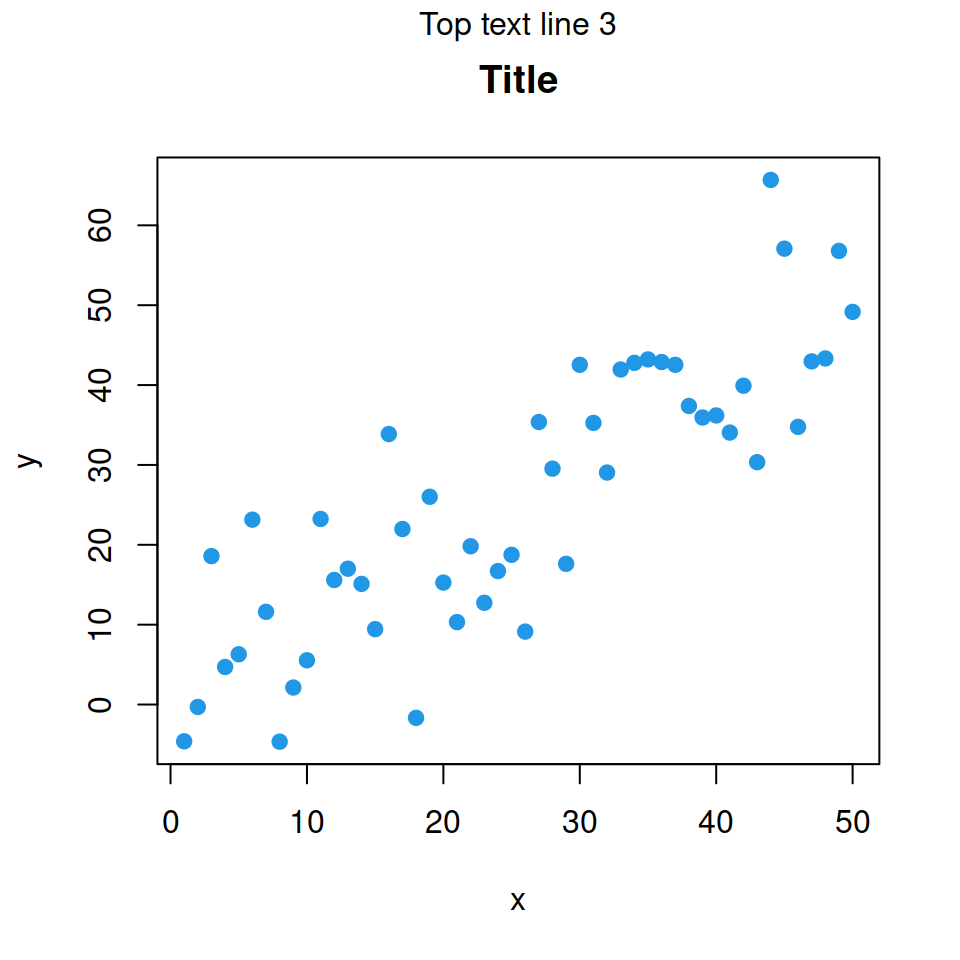
Top-center text, line 3
plot(x, y, pch = 19, main = "Title", col = 4)

# Top text, line 3 (over the title)
mtext("Top text line 3",
      side = 3, line = 3)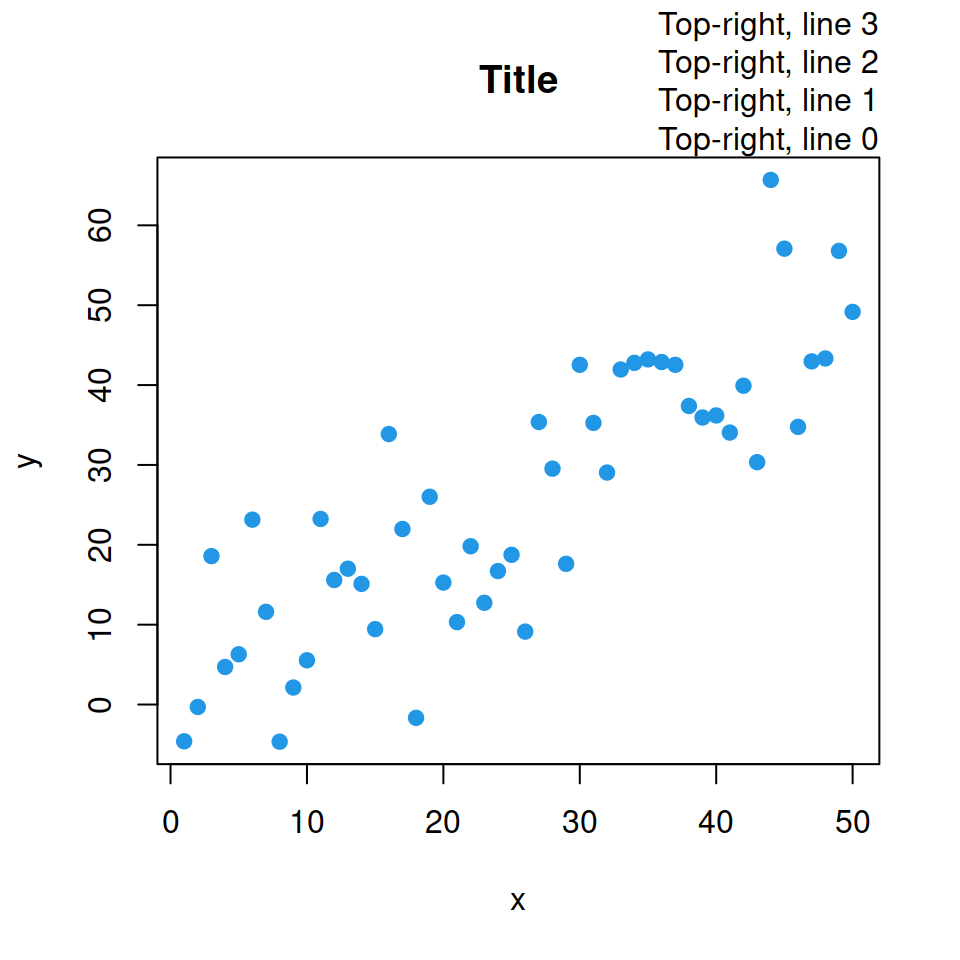
Top-right text, lines 0, 1, 2, 3
plot(x, y, pch = 19, main = "Title", col = 4)

mtext("Top-right, line 0",
      side = 3, adj = 1, line = 0)
mtext("Top-right, line 1",
      side = 3, adj = 1, line = 1)
mtext("Top-right, line 2",
      side = 3, adj = 1, line = 2)
mtext("Top-right, line 3",
      side = 3, adj = 1, line = 3)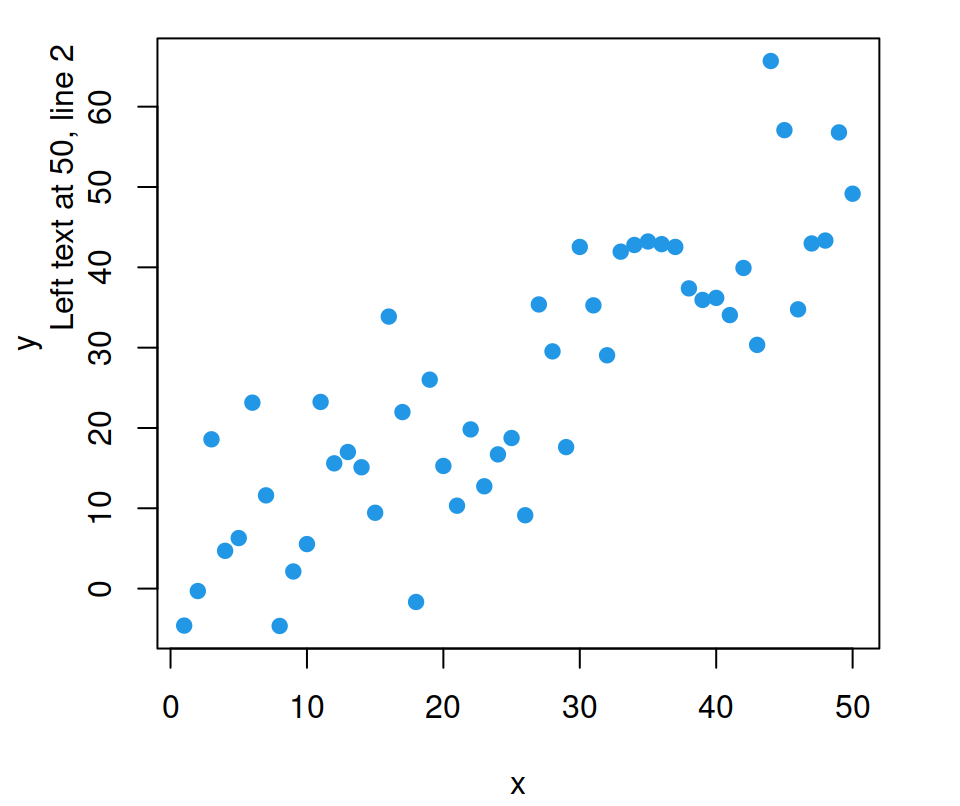
Left text at 50, line 2
plot(x, y, pch = 19, col = 4)

# Left text, line 2, centered at 50
mtext("Left text at 50, line 2",
      side = 2, at = 50, line = 2)
mtext does not support rotation, only horizontal adjustment with las = 1 for the vertical axis and vertical adjustment with las = 3 for the X-axis. If you need to rotate the text you can use text function with srt argument instead.

Master Statistics
Learn statistics from the basics to advanced techniques, clearly explained
Go to site