Setting a title and a subtitle
Adding a title
Base R plotting functions come with an argument named main that allows adding a title to the plot.
curve(sin, -10 , 10,
      main = "Title") # Title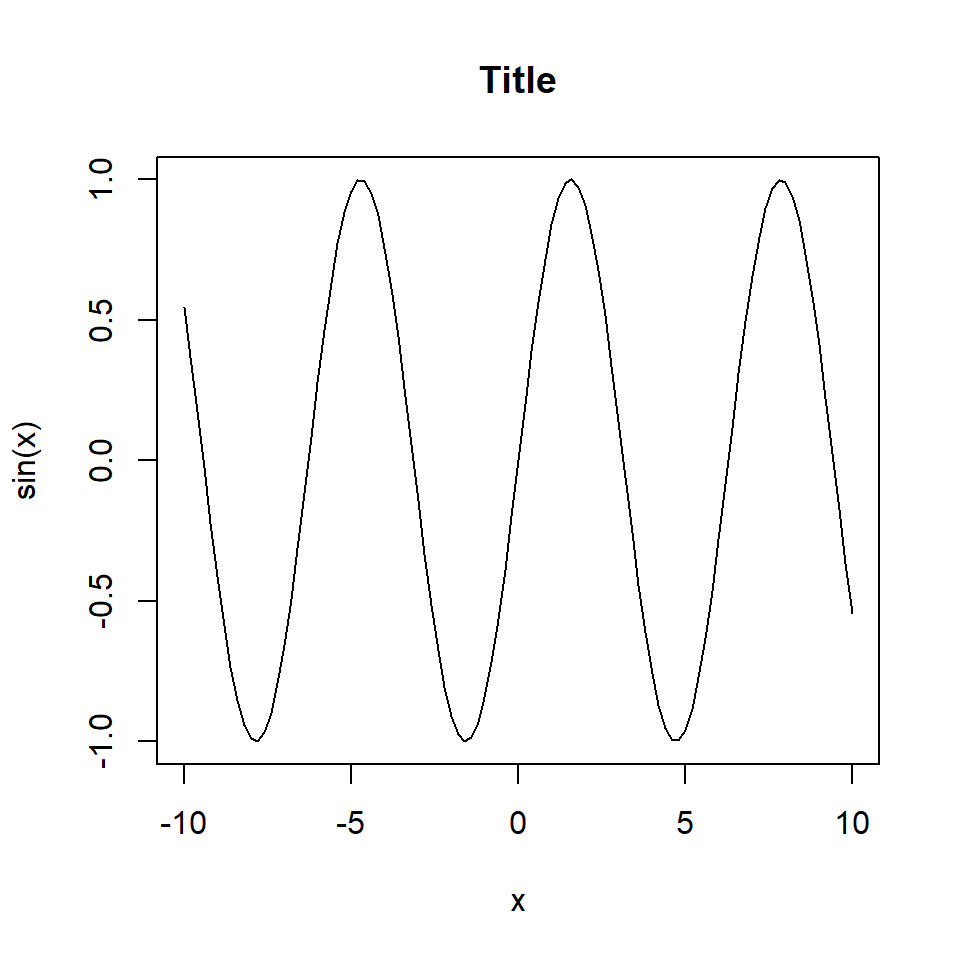
Adding a subtitle
You can also add a subtitle, which will be positioned under the plot, making use of the sub argument.
curve(sin, -10 , 10,
      main = "Title",   # Title
      sub = "Subtitle") # Subtitle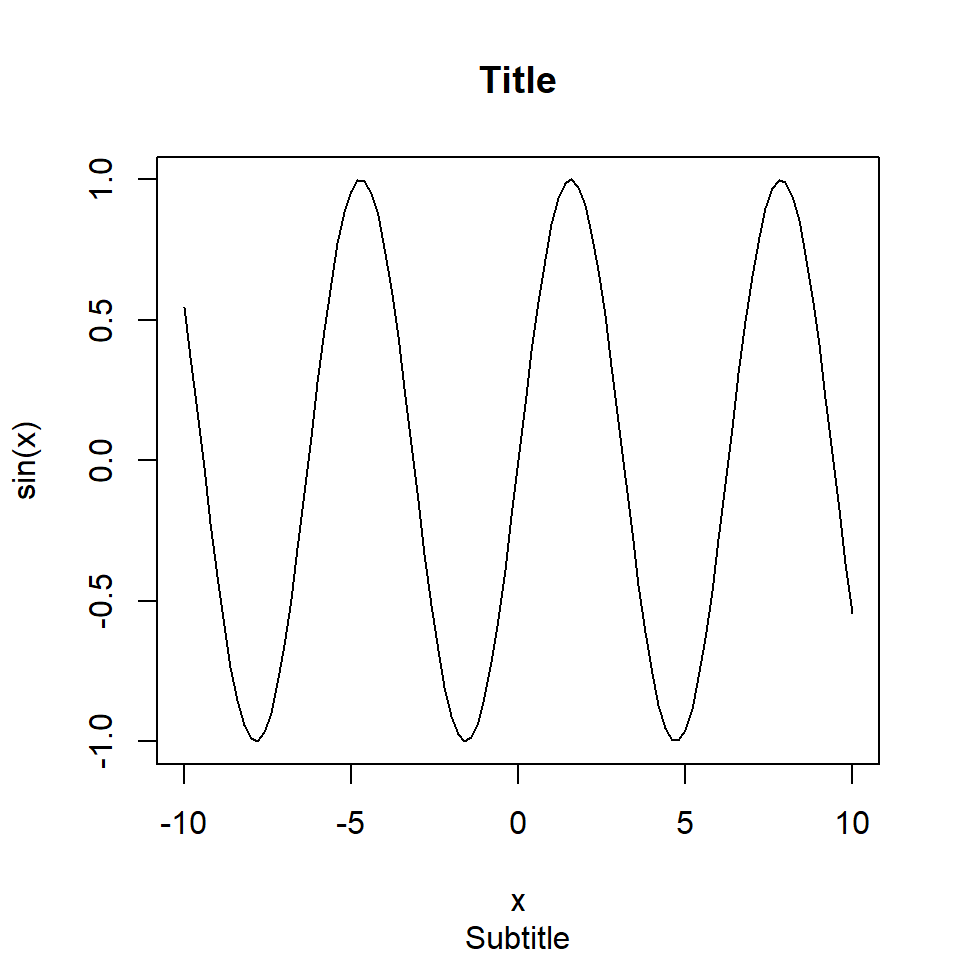
Color customization
The title and the subtitle colors can be customized making use of col.main and col.sub arguments, respectively.
curve(sin, -10 , 10,
      main = "Title",     # Title
      col.main = "red",   # Title color
      sub = "Subtitle",   # Subtitle
      col.sub = "orange") # Subtitle color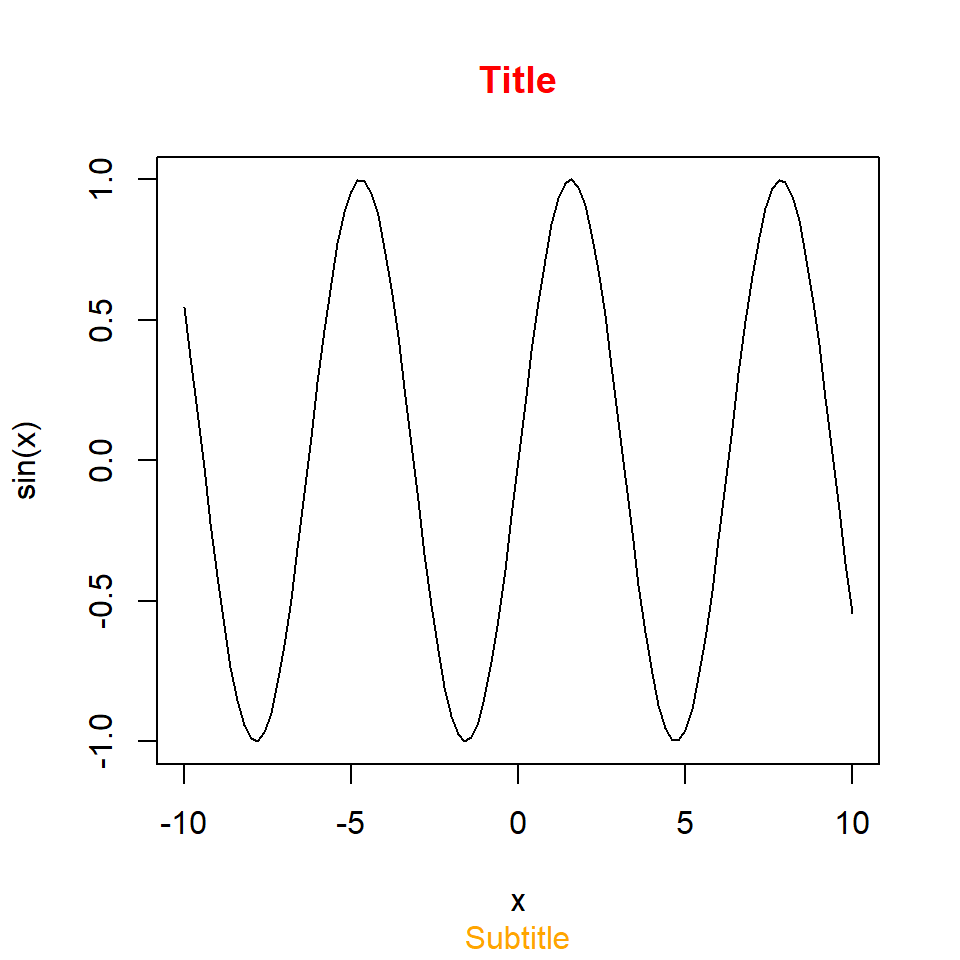
The title function
You can use the title function to add a title, a subtitle and the axis labels, separately or at the same time.
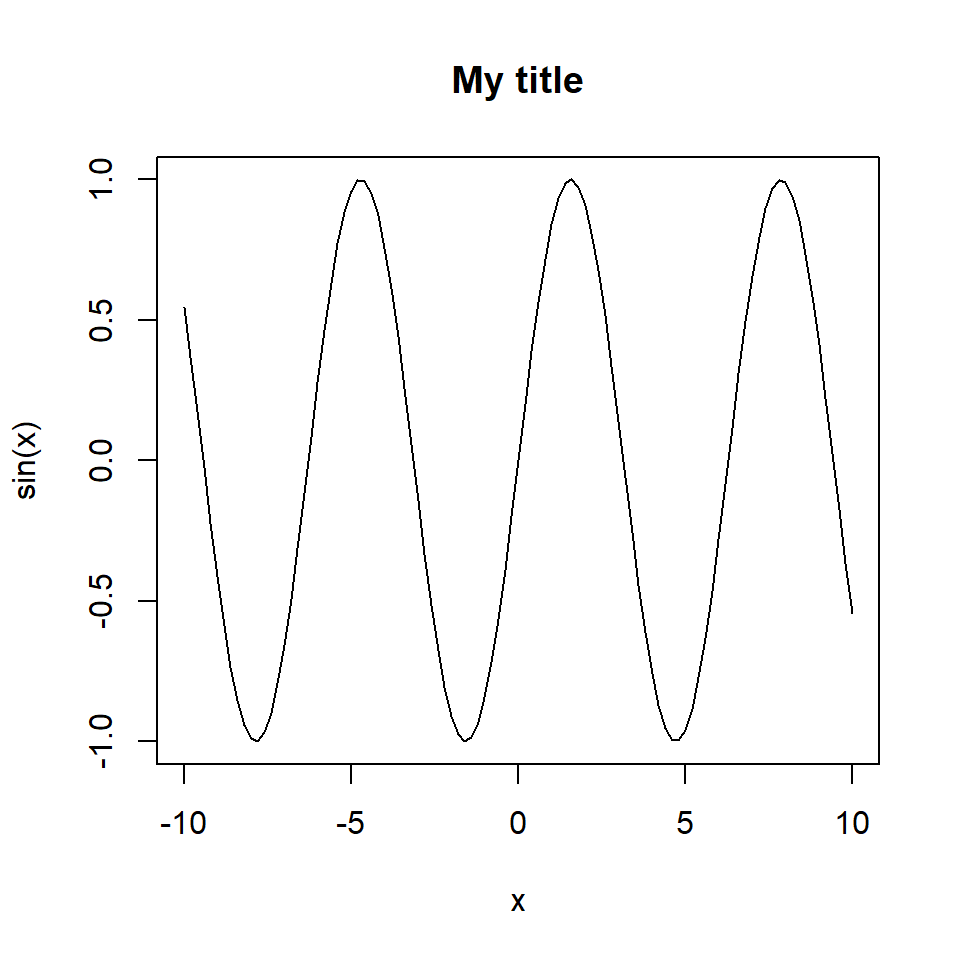
Adding a title with title function
You can add a title to a base R plot using the title function. This is equivalent to set the argument main of the plot function.
curve(sin, -10 , 10)
title(main = "My title")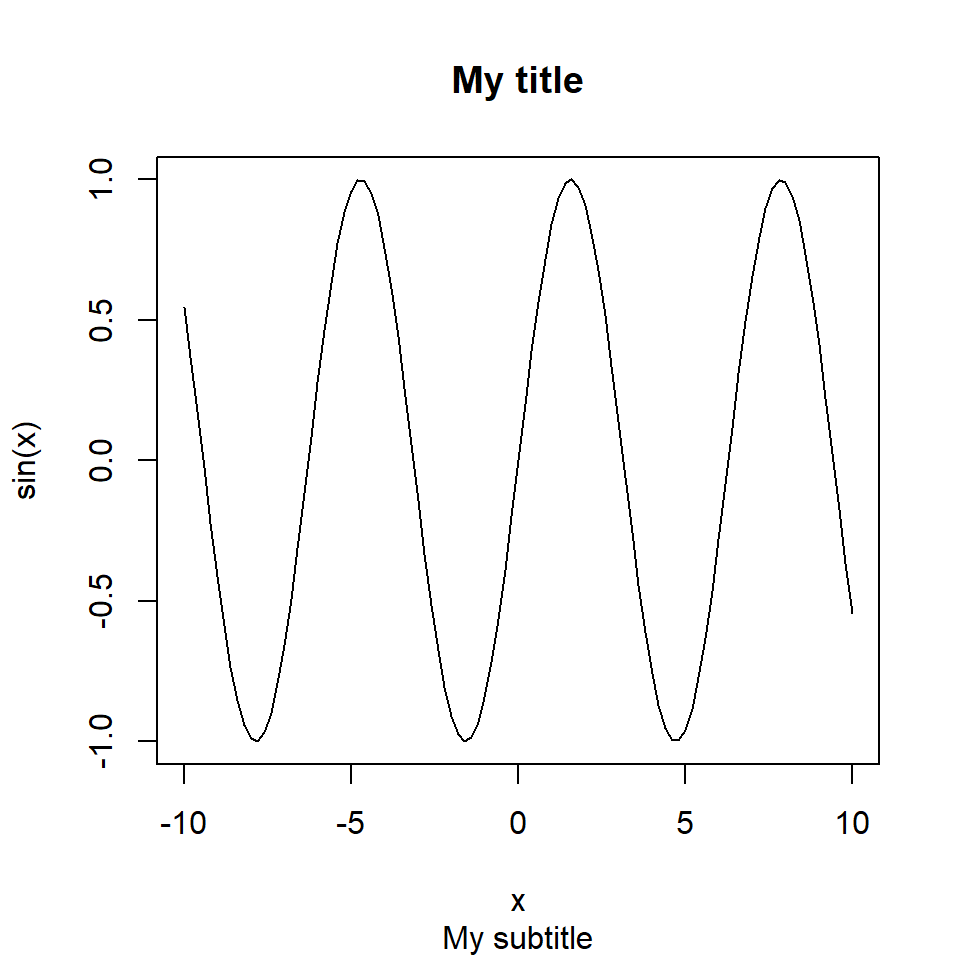
Adding a subtitle with title function
The title function also supports adding a subtitle with the sub argument.
curve(sin, -10 , 10)
title(main = "My title",
      sub = "My subtitle")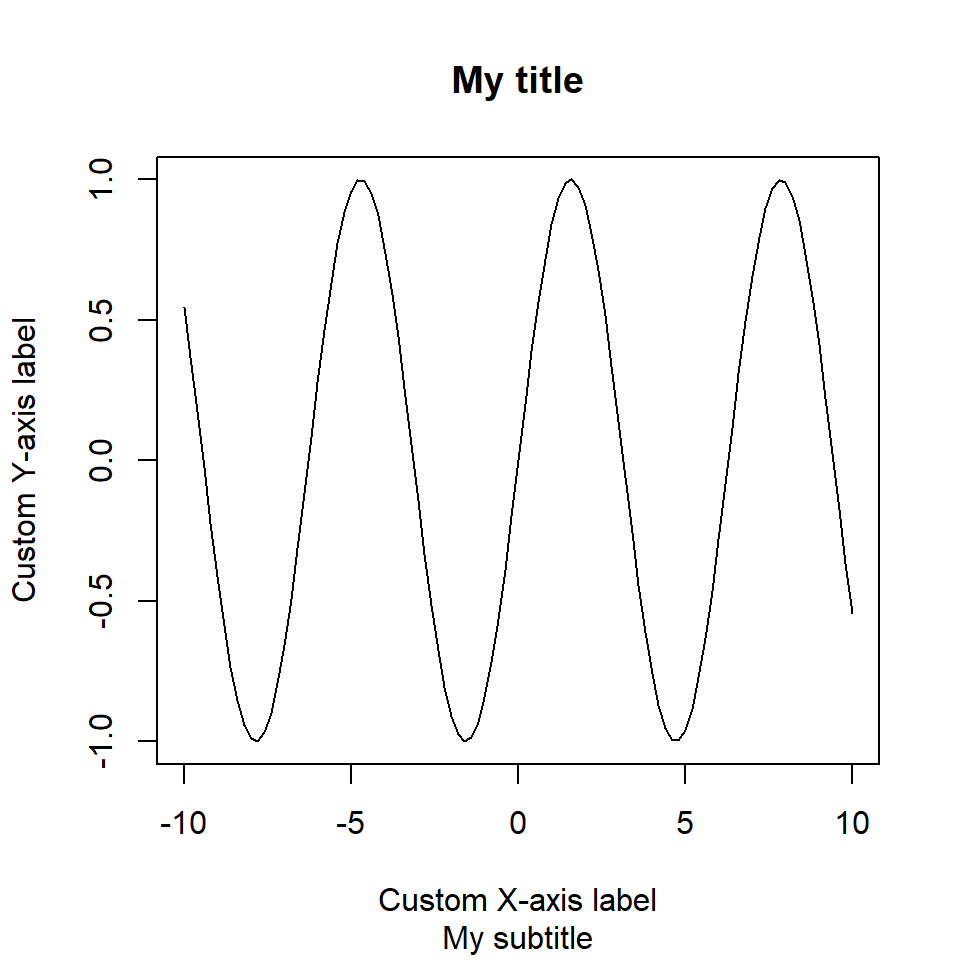
Adding axes labels with title function
You can also specify the axis labels using this function. Note that you will need to specify ann = FALSE inside your plotting function to avoid displaying the axes labels.
curve(sin, -10 , 10, ann = FALSE)
title(main = "My title",
      sub = "My subtitle",
      xlab = "Custom X-axis label",
      ylab = "Custom Y-axis label")
Adjust of the title and subtitle
The difference between using this function instead of the arguments is that the arguments passed to the title function only affect the texts you are adding. In addition, you can customize every single texts using the title function several times.
Adjust all texts
You can adjust the position of the title with the adj argument, that takes values from 0 (left-justified) to 1 (right-justified). Default value is 0.5.
curve(sin, -10 , 10,
     main = "Title",
     sub = "Subtitle",
adj = 0.75) 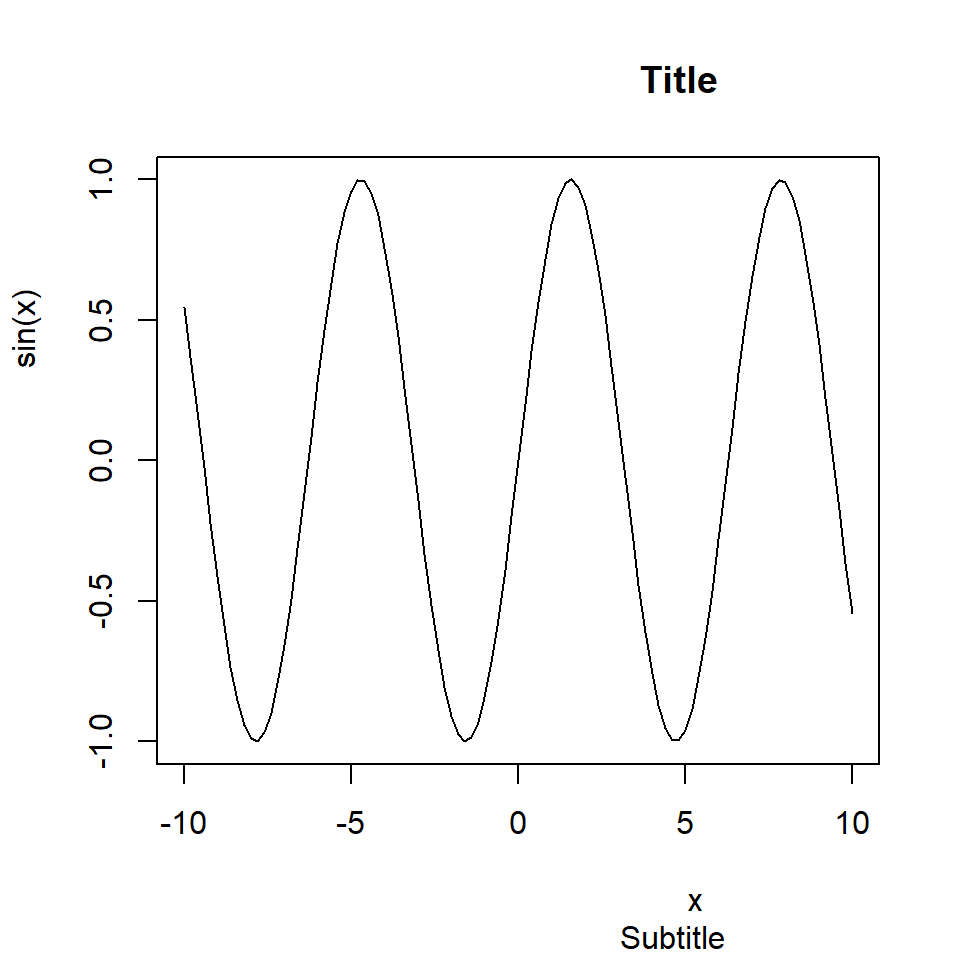
Adjust only the title
However, if you specify the argument adj inside your plotting function all text will be adjusted. If you only want some texts adjusted use it inside the title function.
curve(sin, -10 , 10,
     sub = "Subtitle")
title("My title", adj = 0)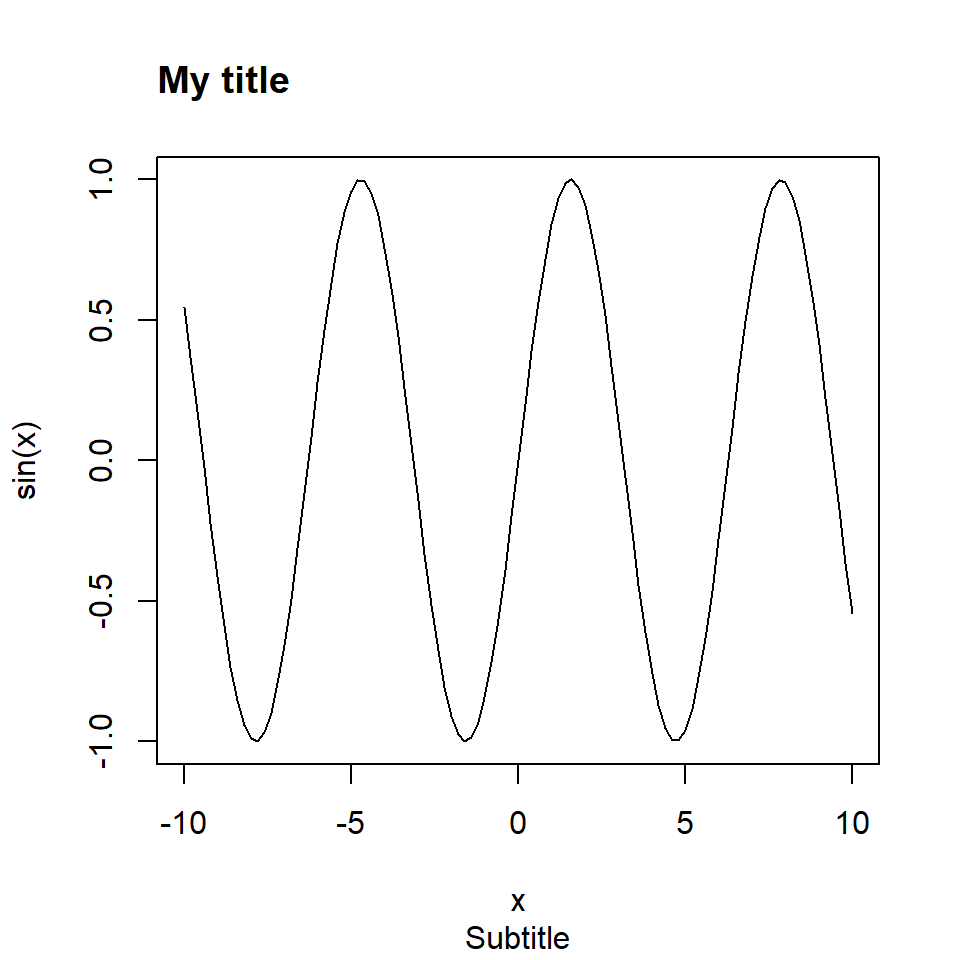
Line adjustment
The title function also supports the argument line that moves the title up or down for values upper or lower than 1.7 (aprox.), respectively. Note that negative values will move the title inside the plot area.
curve(sin, -10 , 10,
     sub = "Subtitle")
title("My title", line = 0.1)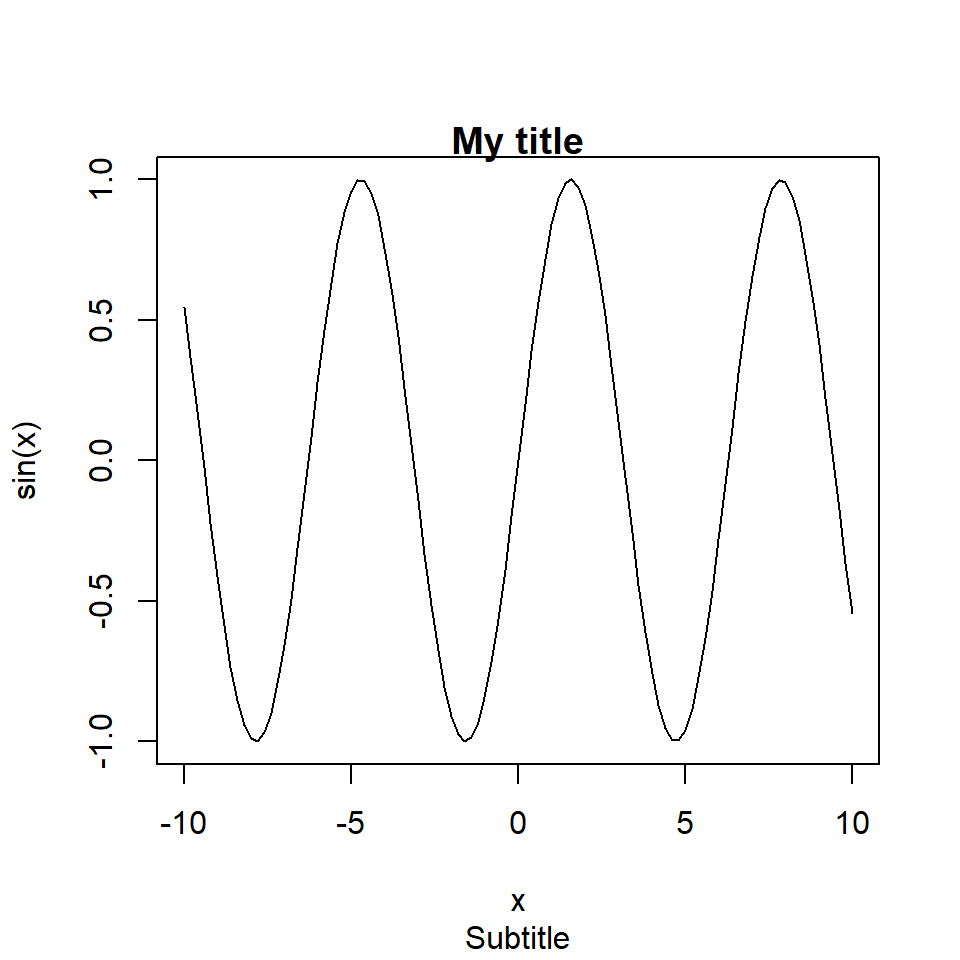
The latter can also be used to adjust the subtitle or the axes labels, but the default values are different. You will need to fine-tune them to achieve the desired result.
Using mathematical expressions
You can also add mathematical expressions to your titles and subtitles.
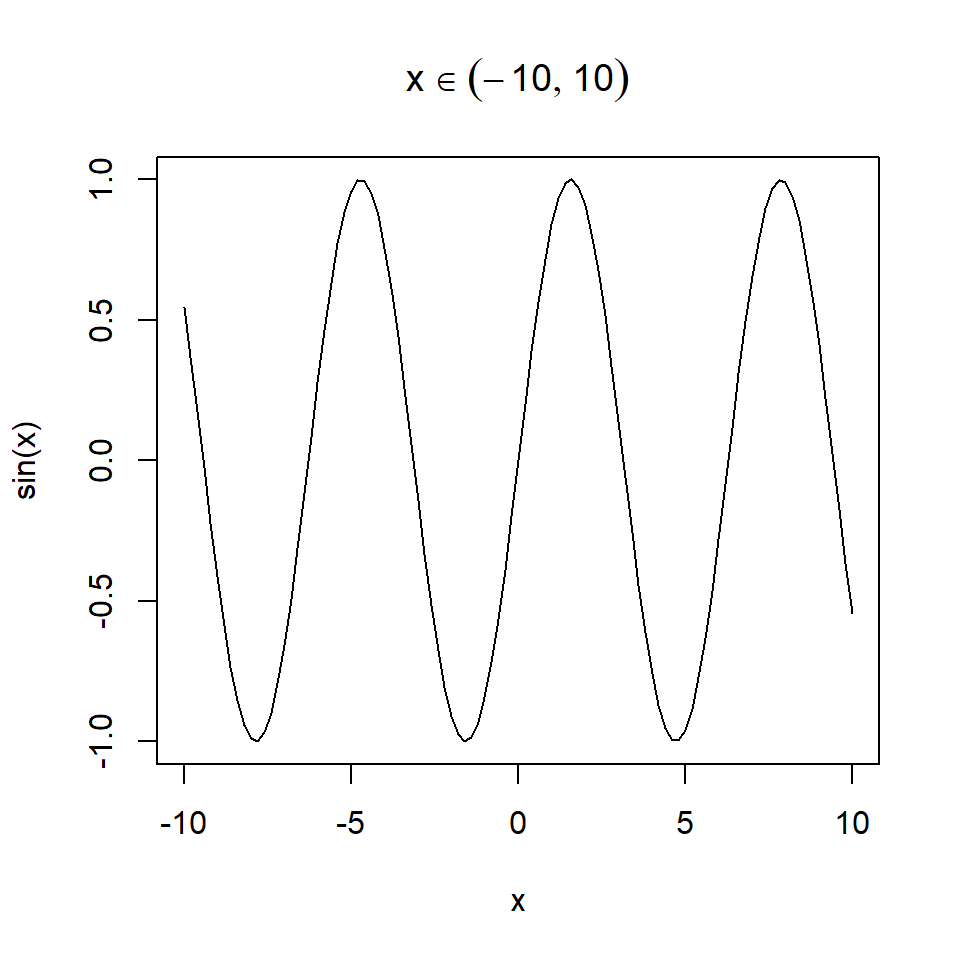
Option 1. Use the expression function. Type demo(plotmath) or ?plotmath to see the full list of mathematical annotations.
curve(sin, -10 , 10,
      main = expression(x %in% {}(-10, 10)))
Option 2. If you prefer using a LaTex-like notation you can use the Tex function from latex2exp package. Note that this function translates the notation from LaTeX to a plotmath expression, so both options support the same mathematical annotations.
# install.packages("latex2exp")
library(latex2exp)

curve(sin, -10 , 10,
      main = TeX('$x \\in (-10, 10)$'))
Master Statistics
Learn statistics from the basics to advanced techniques, clearly explained
Go to site