Pch stands for ‘plotting character’ and are the symbols used to display the data points on a graph.
pch symbols list
Most common symbols
The main symbols can be selected with the pch argument, with values from 0 to 25.
grid <- expand.grid(1:5, 6:1)
plot(grid, pch = 0:30, cex = 2.5,
     yaxt = "n", xaxt = "n",
     ann = FALSE, xlim = c(0.5, 5.25),
     ylim = c(0.5, 6.5))

grid2 <- expand.grid(seq(0.6, 4.6, 1), 6:1)
text(grid2$Var1[1:26], grid2$Var2[1:26], 0:25)
Other symbols
The rest can be specified with numbers 32 to 255, which correspond to characters. However, instead of specify its number its easier to set them as a string.
# Custom symbols
plot(1:5, 1:5,
     pch = c("+", "-", "/", "&", "?"),
     cex = 2.5,
     xlim = c(0, 6), ylim = c(0, 6),
     yaxt = "n", xaxt = "n",
     ann = FALSE)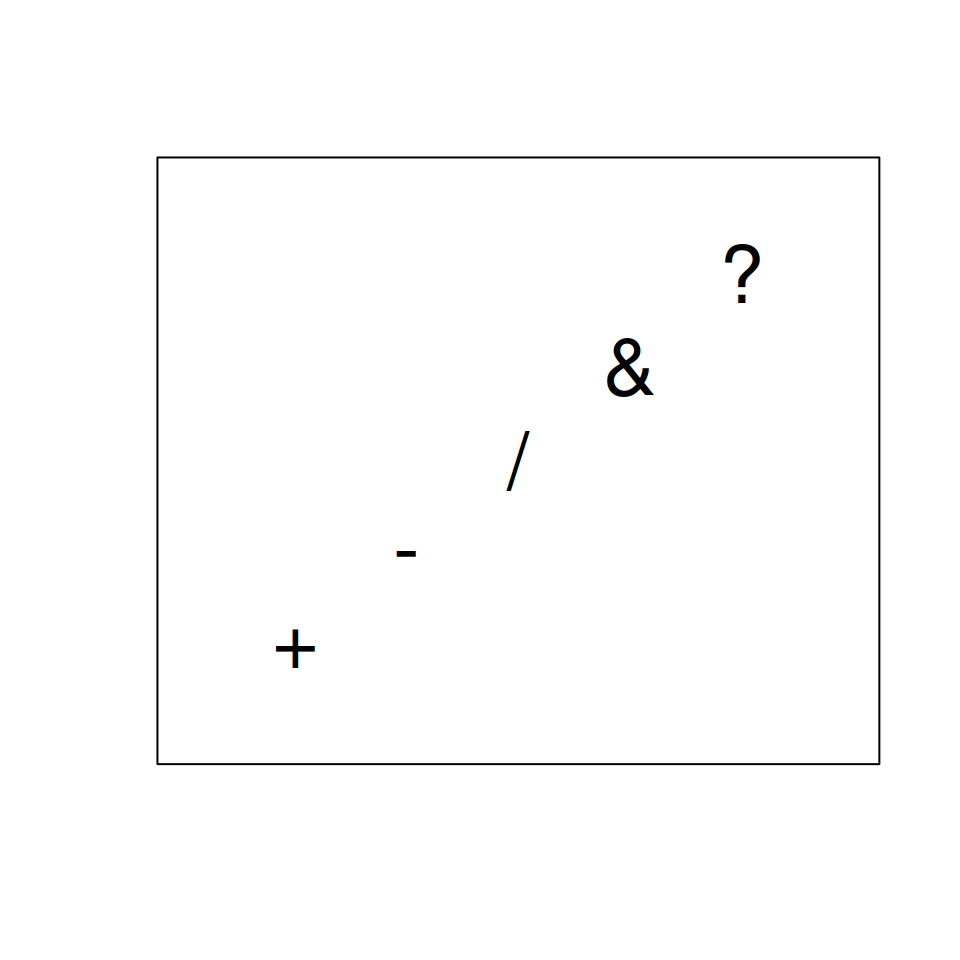
The symbols can be classified in several groups, such as:
| Symbol | Description |
|---|---|
| 0-18 | S-compatible vector symbols |
| 19-25 | Further R symbols |
| 26-31 | Not implemented |
| 32-127 | ASCII characters |
| 128-255 | Native characters |
pch colors
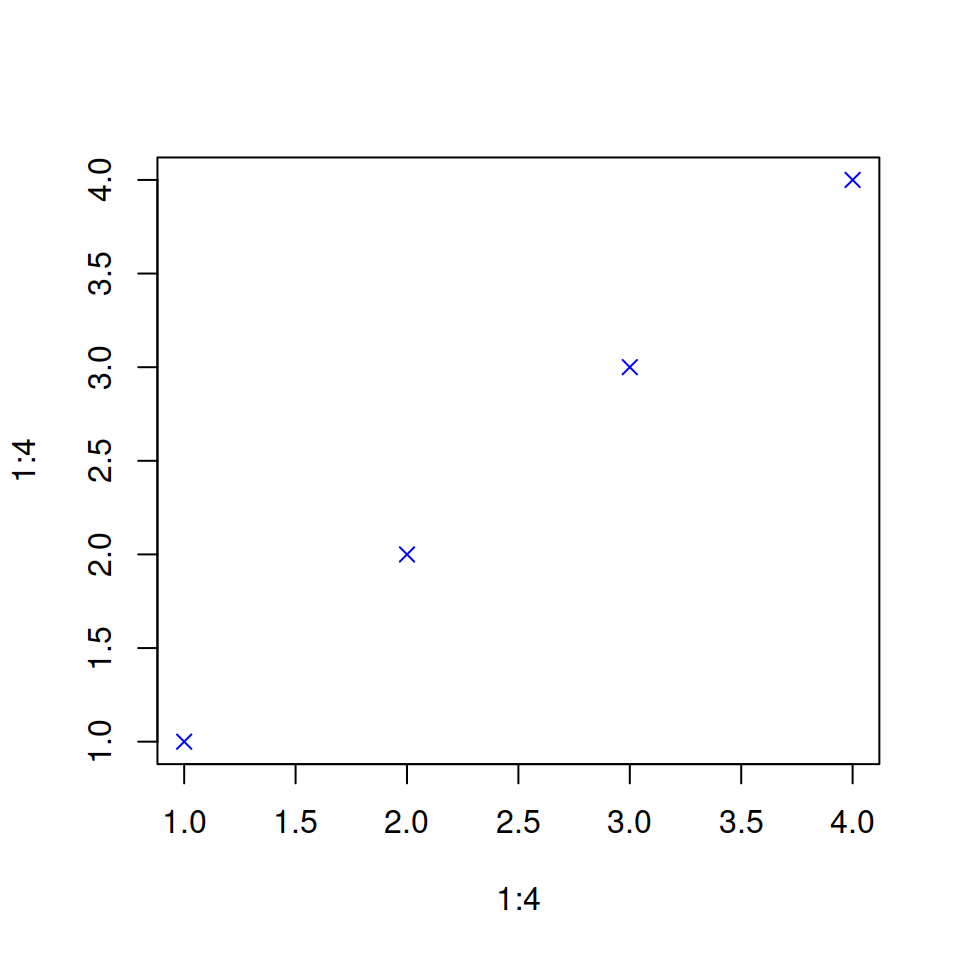
Color of the symbols
By default, pch symbols are black, but the color can be changed using col argument.
plot(1:4, 1:4,     # Data
     pch = 4,      # Symbol
     col = "blue") # Color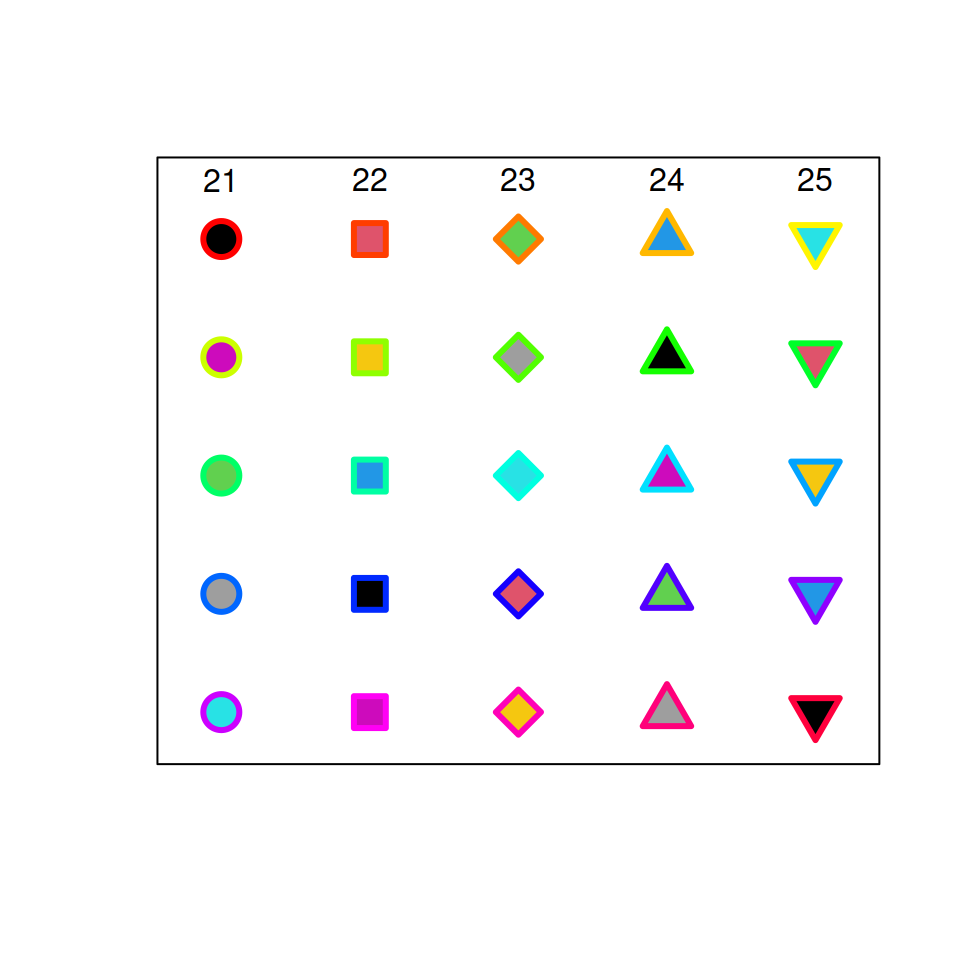
Different background color and border color
Symbols 21 to 25 also allow changing the fill color with the bg argument and the border color with the col argument.
grid <- expand.grid(1:5, 5:1)

plot(grid, pch = 21:25, cex = 2.5,
     yaxt = "n", xaxt = "n", lwd = 3,
     ann = FALSE, xlim = c(0.75, 5.25),
     ylim = c(0.75, 5.5),
     bg = 1:25, col = rainbow(25))

text(1:5, rep(5.5, 5), 21:25)
pch size
Size of the symbols
You can change the pch size in R with the cex argument. Default value is 1.
# Generate sample data
set.seed(1)
x <- rnorm(500)
y <- x + rnorm(500)

plot(x, y, pch = 21,
     bg = "red",   # Fill color
     col = "blue", # Border color
     cex = 3,      # Symbol size
     lwd = 3)      # Border width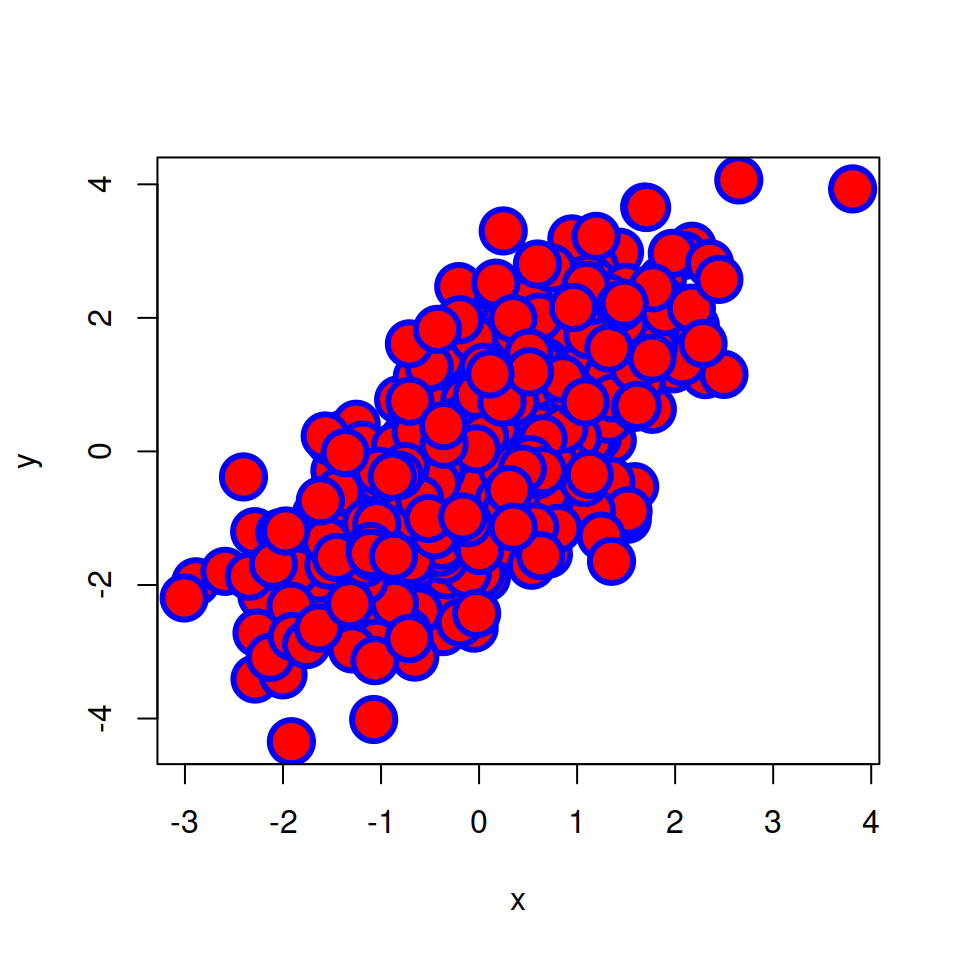
Scale the symbols
You can also set the size of the symbol based on a variable, as in the following example.
# Generate sample data
set.seed(1)
x <- rnorm(500)
y <- x + rnorm(500)

# Standardize variable Y between 0 and 1
sizes <- (y - min(y))/(max(y) - min(y))

plot(x, y, pch = 16,
     col = "blue",    # Color
     cex = sizes * 2, # Symbol size
     lwd = 3)         # Border width

Master Statistics
Learn statistics from the basics to advanced techniques, clearly explained
Go to site