Base R provides several functions to add segments and arrows to the plots. In this guide we are going to use the following sample plot:
# Sample data
set.seed(132)
x <- seq(1, 10, by = 0.05)
y <- x ^ 2 + rnorm(x, sd = 10)

# Plotting function used in the examples below
splot <- function(x, y) {
  plot(x, y, pch = ifelse(x > 8, 23, ifelse(y < 0, 24, 21)),
       bg = ifelse(x > 8, "deepskyblue", ifelse(y < 0 , "orange", "lightgreen")))
}
The abline function
The abline function allows drawing lines, such as horizontal lines (h argument), vertical lines (v argument), lines based on a intersection and a slope (a and b arguments) or for plotting a regression line.
Horizontal line
The h argument allows you to set the Y-axis value where to draw a horizontal line.
splot(x, y) # Sample function

# Horizontal line at Y = 0
abline(h = 0)
Vertical line
The v argument allows you to set the X-axis values where to draw vertical lines.
splot(x, y)

# Vertical line at X = 8
abline(v = 8)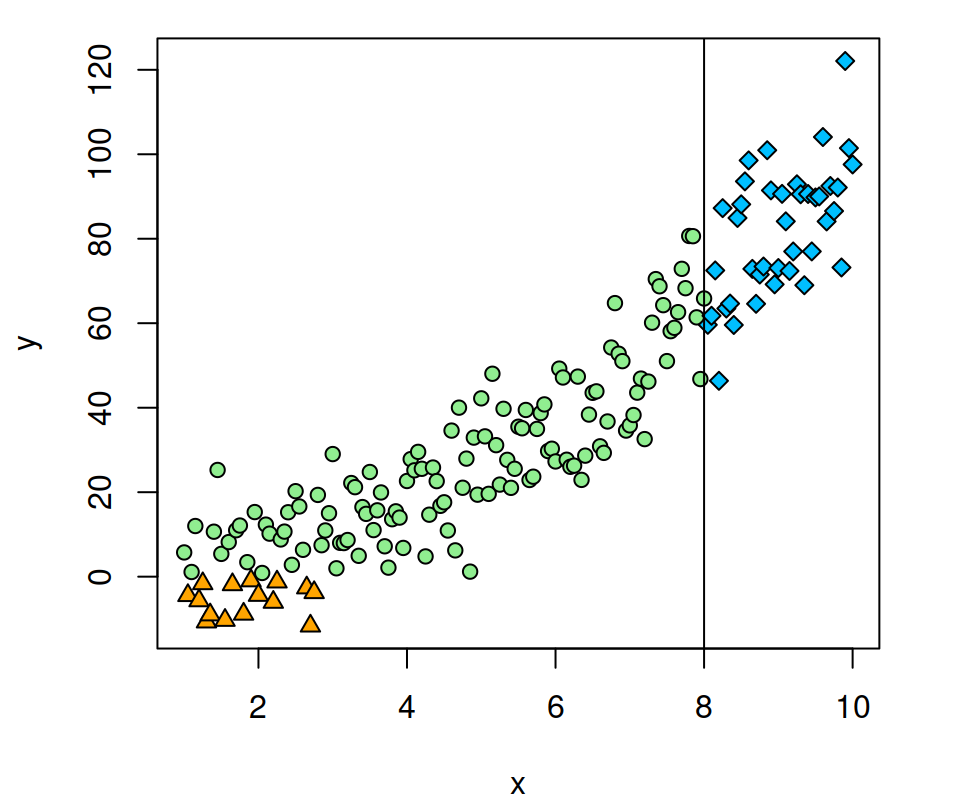
Horizontal and vertical line at the same time
You can also add vertical and horizontal lines at the same time specifying both arguments.
splot(x, y)

# Horizontal line at Y = 1 and vertical at X = 8
abline(h = 1, v = 8)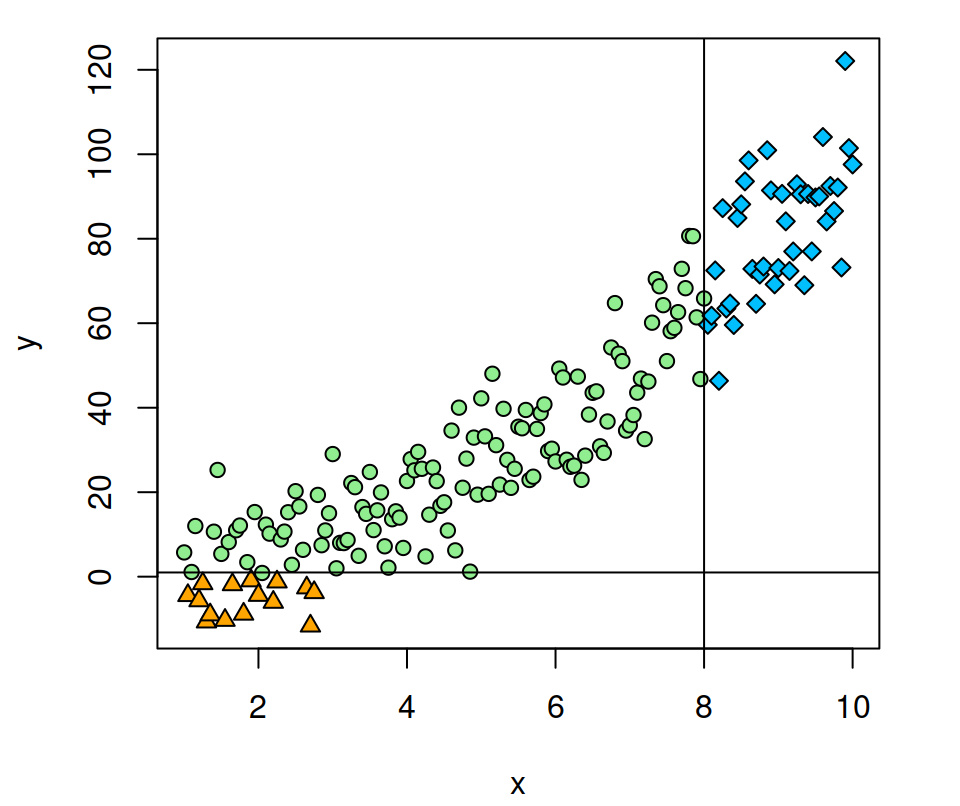
Intercept and slope
In addition to horizontal or vertical lines, you can also specify an intercept with the argument a and the slope of the line with the argument b.
splot(x, y)

abline(a = -15, # Intercept
       b = 10)  # Slope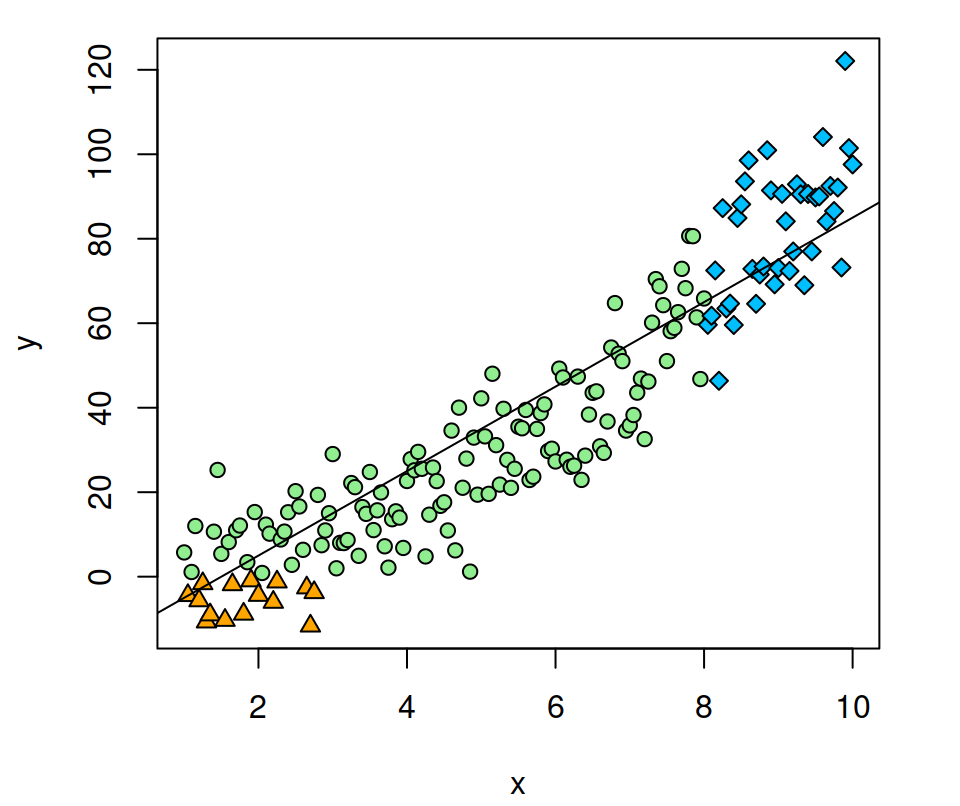
Regression line
The abline function also allows drawing linear regression lines from a model.
splot(x, y)

abline(lm(y ~ x)) # Linear regression
Line customization
The same customization of lines in base R can be applied to this and the other functions of this guide.
splot(x, y)

abline(h = 0, v = 8,
       col = c("red", "green"),
       lwd = 2,
       lty = 2:3)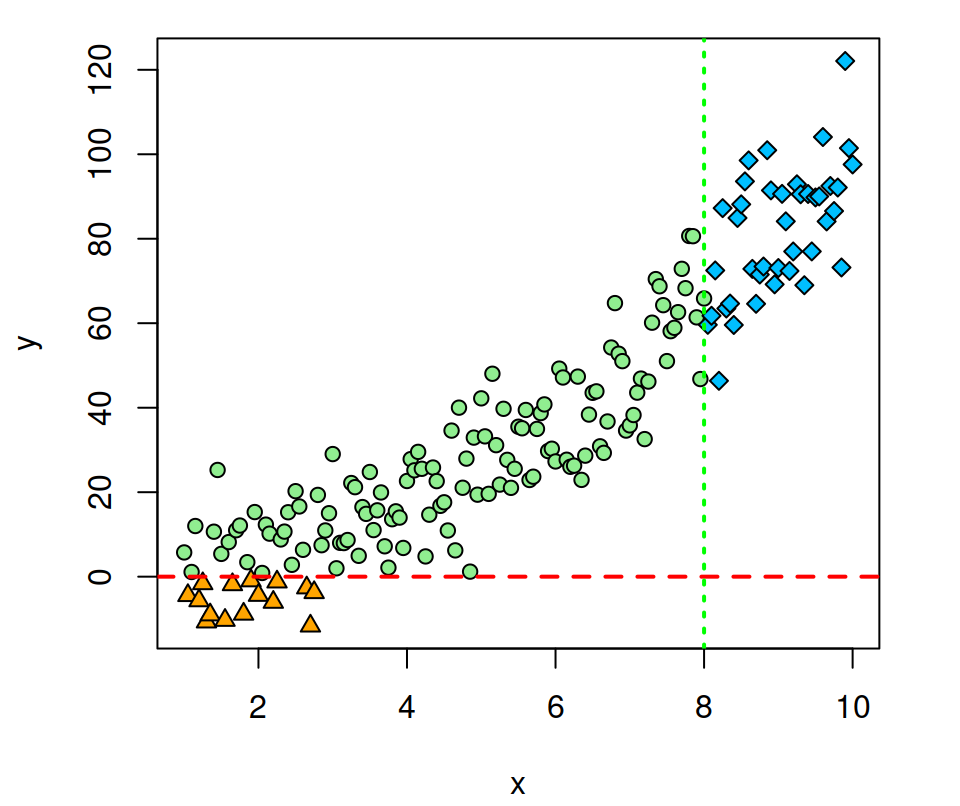
The segments function
This function is very similar to abline, but you can specify the starting and end points of the lines with x0, x1, y0 and y1 arguments.
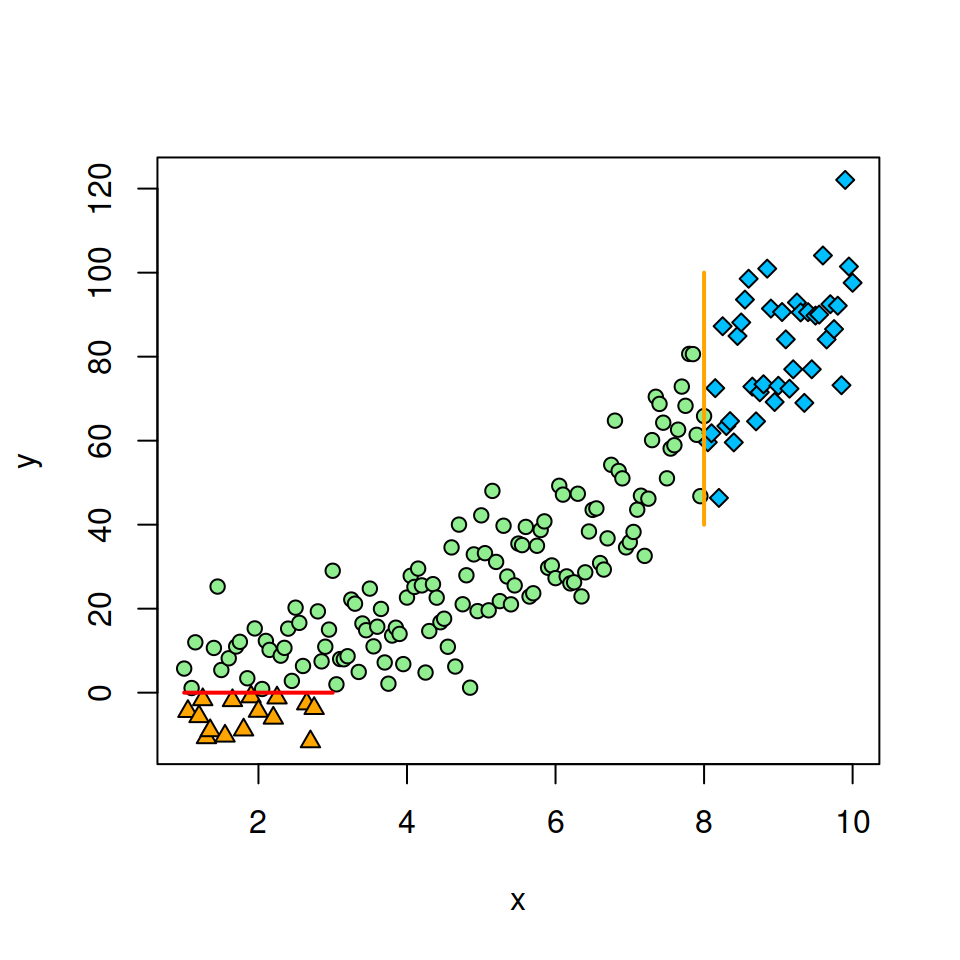
splot(x, y)

segments(x0 = 1,
         x1 = 3,
         y0 = 0,
         y1 = 0,
         lwd = 2,
         col = "red")

segments(x0 = 8,
         x1 = 8,
         y0 = 40,
         y1 = 100,
         lwd = 2,
         col = "orange")
The arrows function
You can set the arrows the same way as segments, specifying the start and end of the arrow on each axis.
splot(x, y)

arrows(x0 = 3,
       x1 = 7,
       y0 = 40,
y1 = 90) 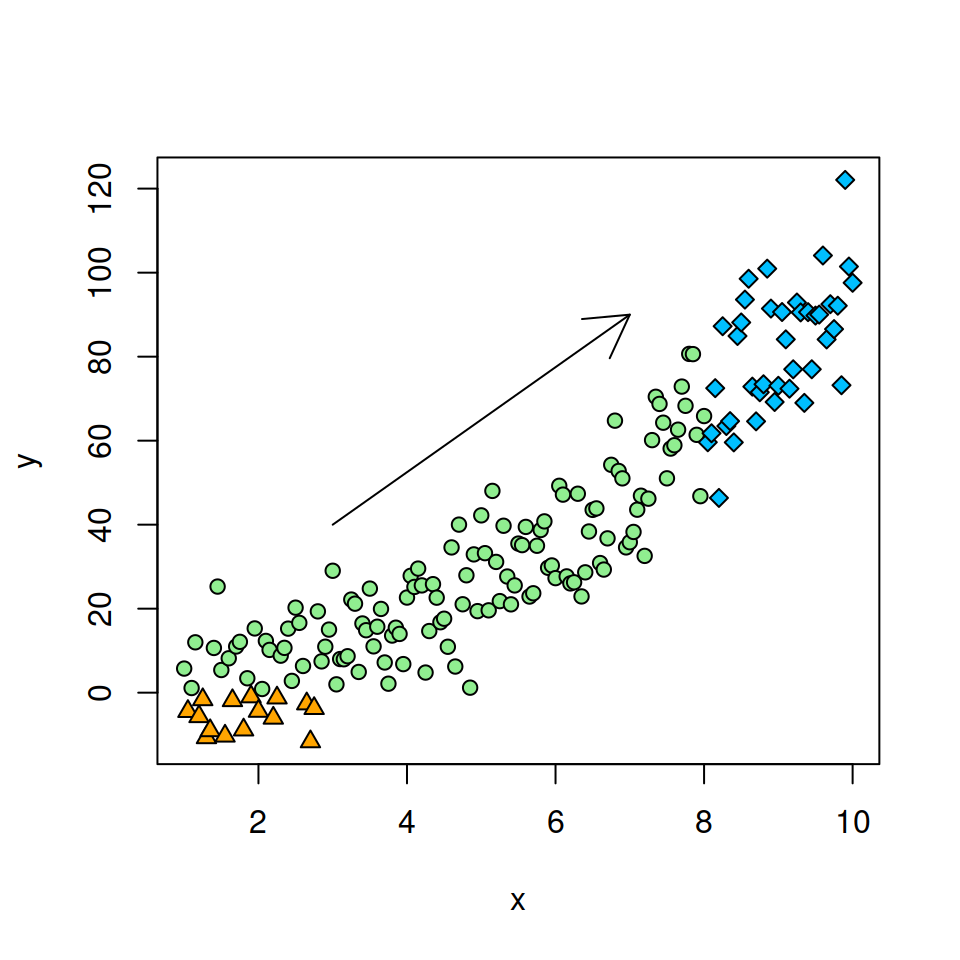
In addition to modifying the color, width or line type, the arrows function also allows customizing the length and the angle of the arrowhead.
splot(x, y)

arrows(x0 = 3, x1 = 7,
       y0 = 40, y1 = 90,
       length = 0.1,
angle = 20) ![]()

Master Statistics
Learn statistics from the basics to advanced techniques, clearly explained
Go to site