Inner margins: mar and mai
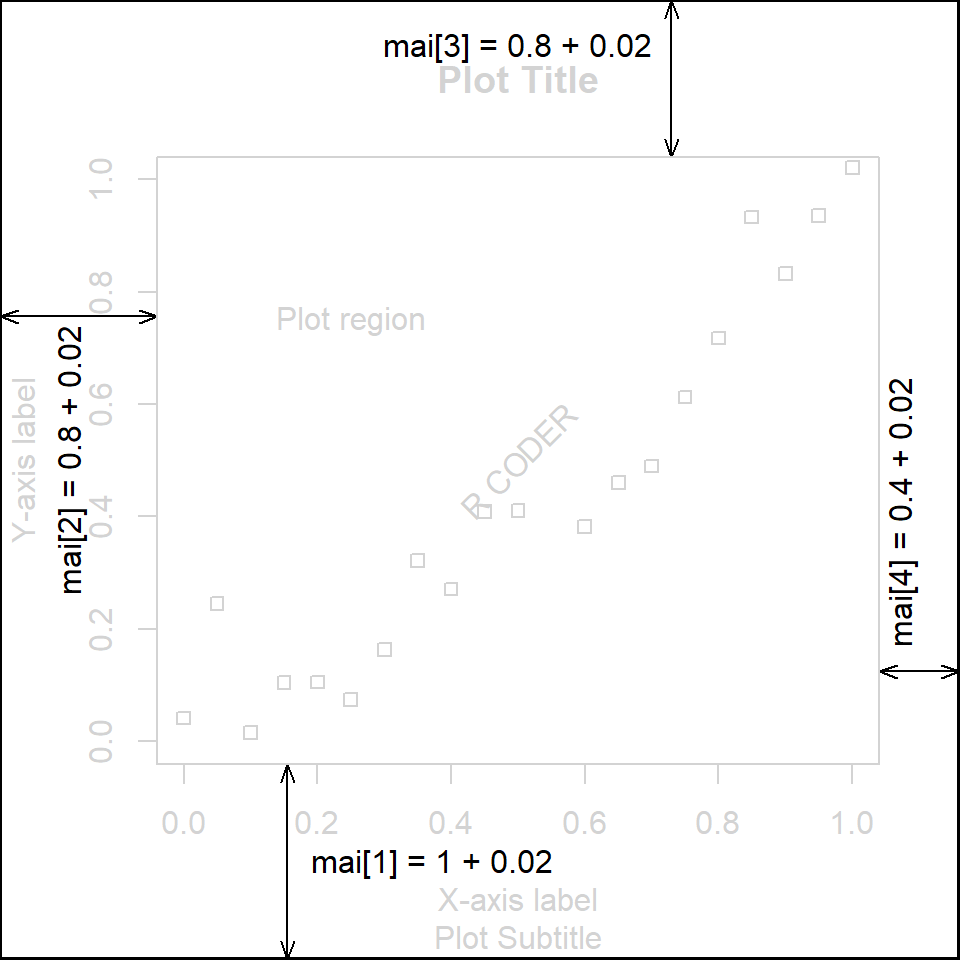
The margins of a plot can be customized with the mar graphical parameter, if the margin is measured in margin lines and mai if the margin is measured in inches.
These graphical parameters are vectors of the form c(bottom, left, top, right), where each element represent the margin of each side of the plot (in margin lines or in inches). Note that you can access the current values with par("mar") or par("mai").
The order of the elements of mar and mai vectors are bottom, left, top and right. A good way to remember is remembering the word bolster.
mar (margin lines)
By default par(mar = c(5, 4, 4, 2) + 0.1).
In the figure you can see how many lines fit on each side of the plot. You can increase or decrease the number of lines for each side. Note that the 0.1 is just for adding an extra space to fit everything inside the plot area.

mai (inches)
By default par(mar = c(1, 0.8, 0.8, 0.4) + 0.02)
If you prefer set the margins in inches instead of in margin lines modify this graphical parameter.
Example 1. Using mar
In this example we are going to remove the top and right margins. Note that we added a box to the figure so you can see the difference.
Default margins
# Default
curve(sqrt, 0, 20)
box("figure", col = 4)
Remove top and right margins
par(mar = c(par("mar")[1], par("mar")[2], 0, 0))
curve(sqrt, 0, 20)
box("figure", col = 4)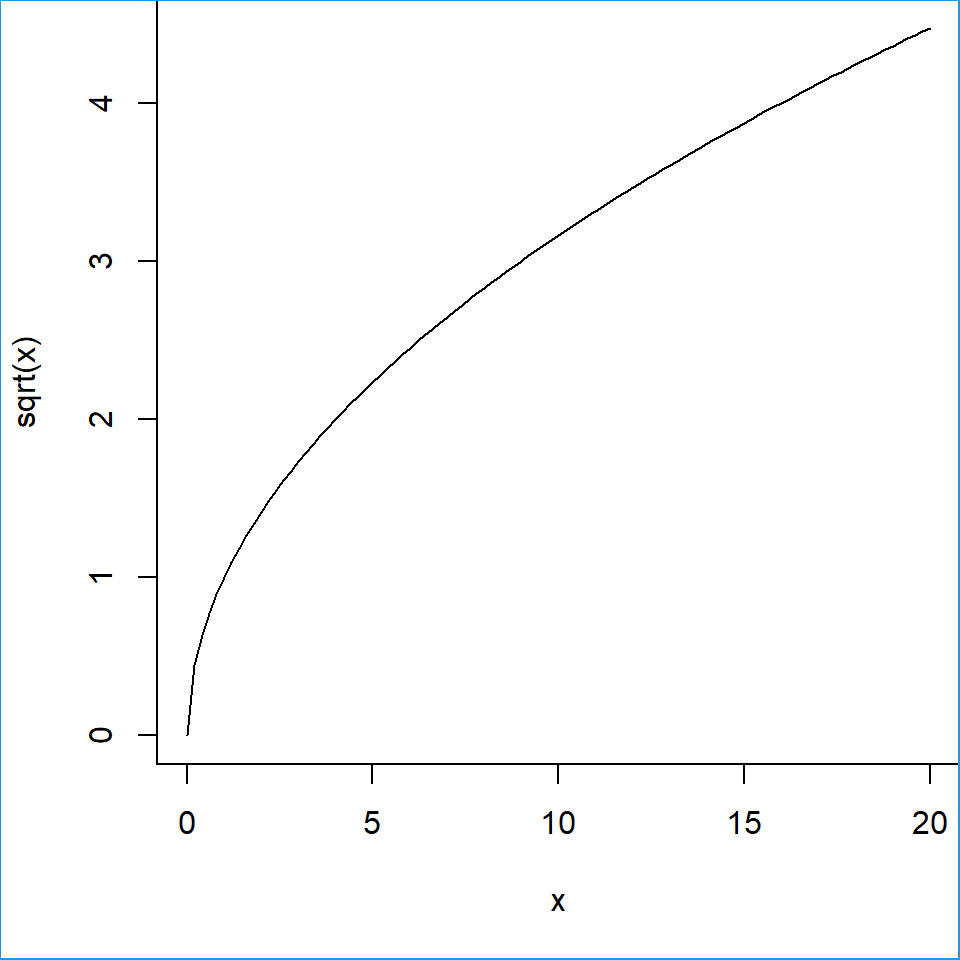
Example 2. Using mai
In this example we are increasing all the margins. Once again, we added a box to the figure so you can see the difference.
Default margins
# Default
curve(sqrt, 0, 20)
box("figure", col = 4)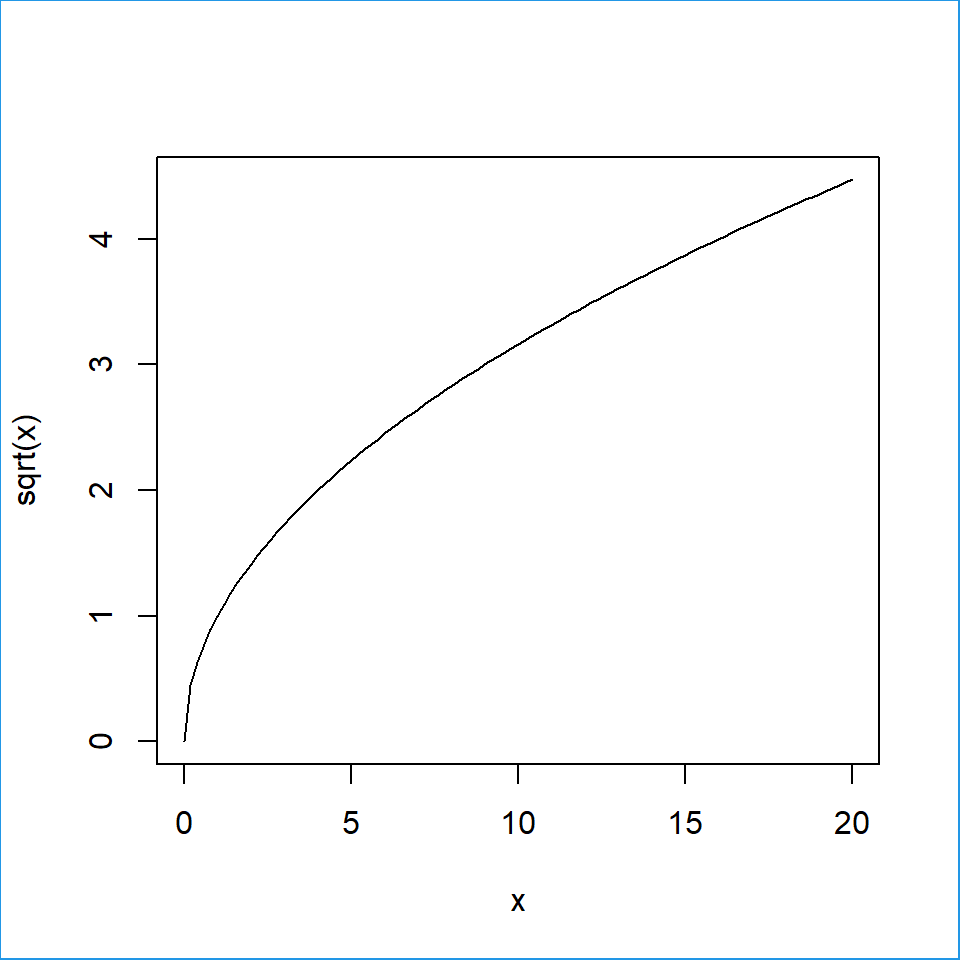
Longer margins
par(mai = c(1.5, 1.5, 1.5, 1.5))
curve(sqrt, 0, 20)
box("figure", col = 4)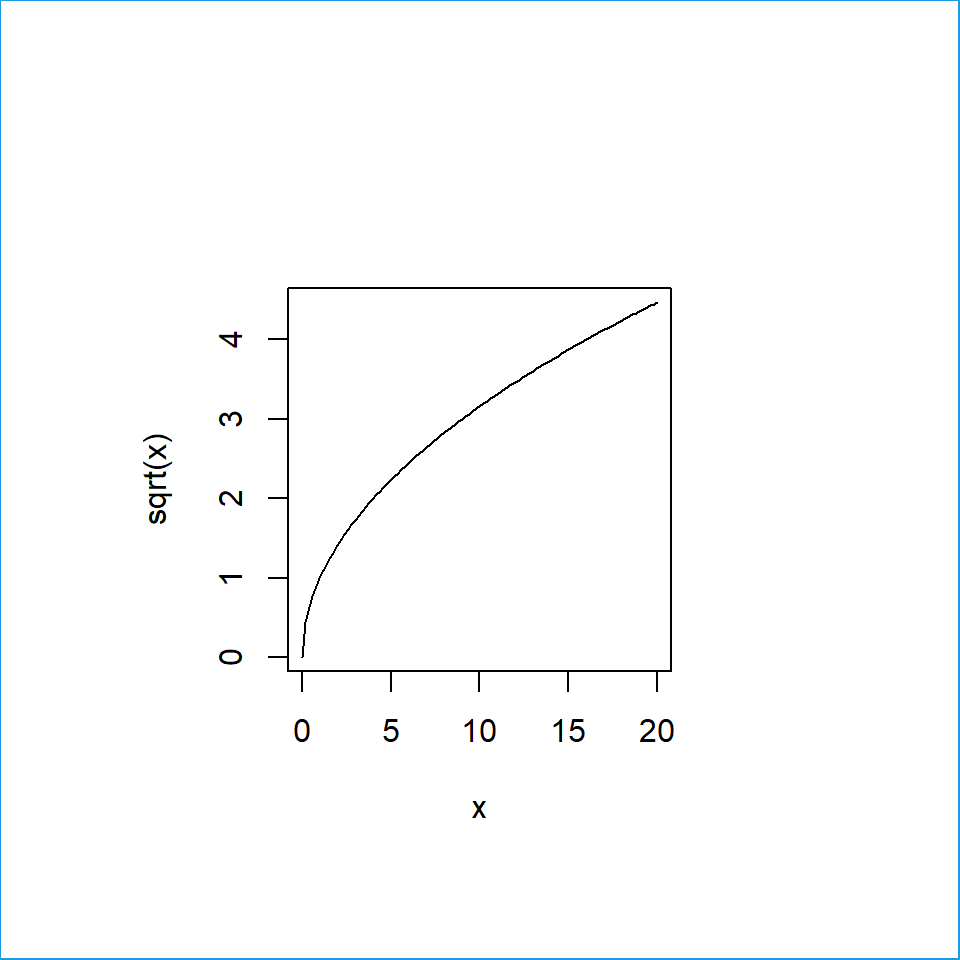
Outer margins: oma and omi
Outer margins can be specified in the same way as mar and mai. You can set the margin in margin lines with oma or in inches with omi. The outer margins are specially useful for adding text to a combination of plots (a single title for multiple plots).
You can access the current outer margins with par("oma") and par("omi").
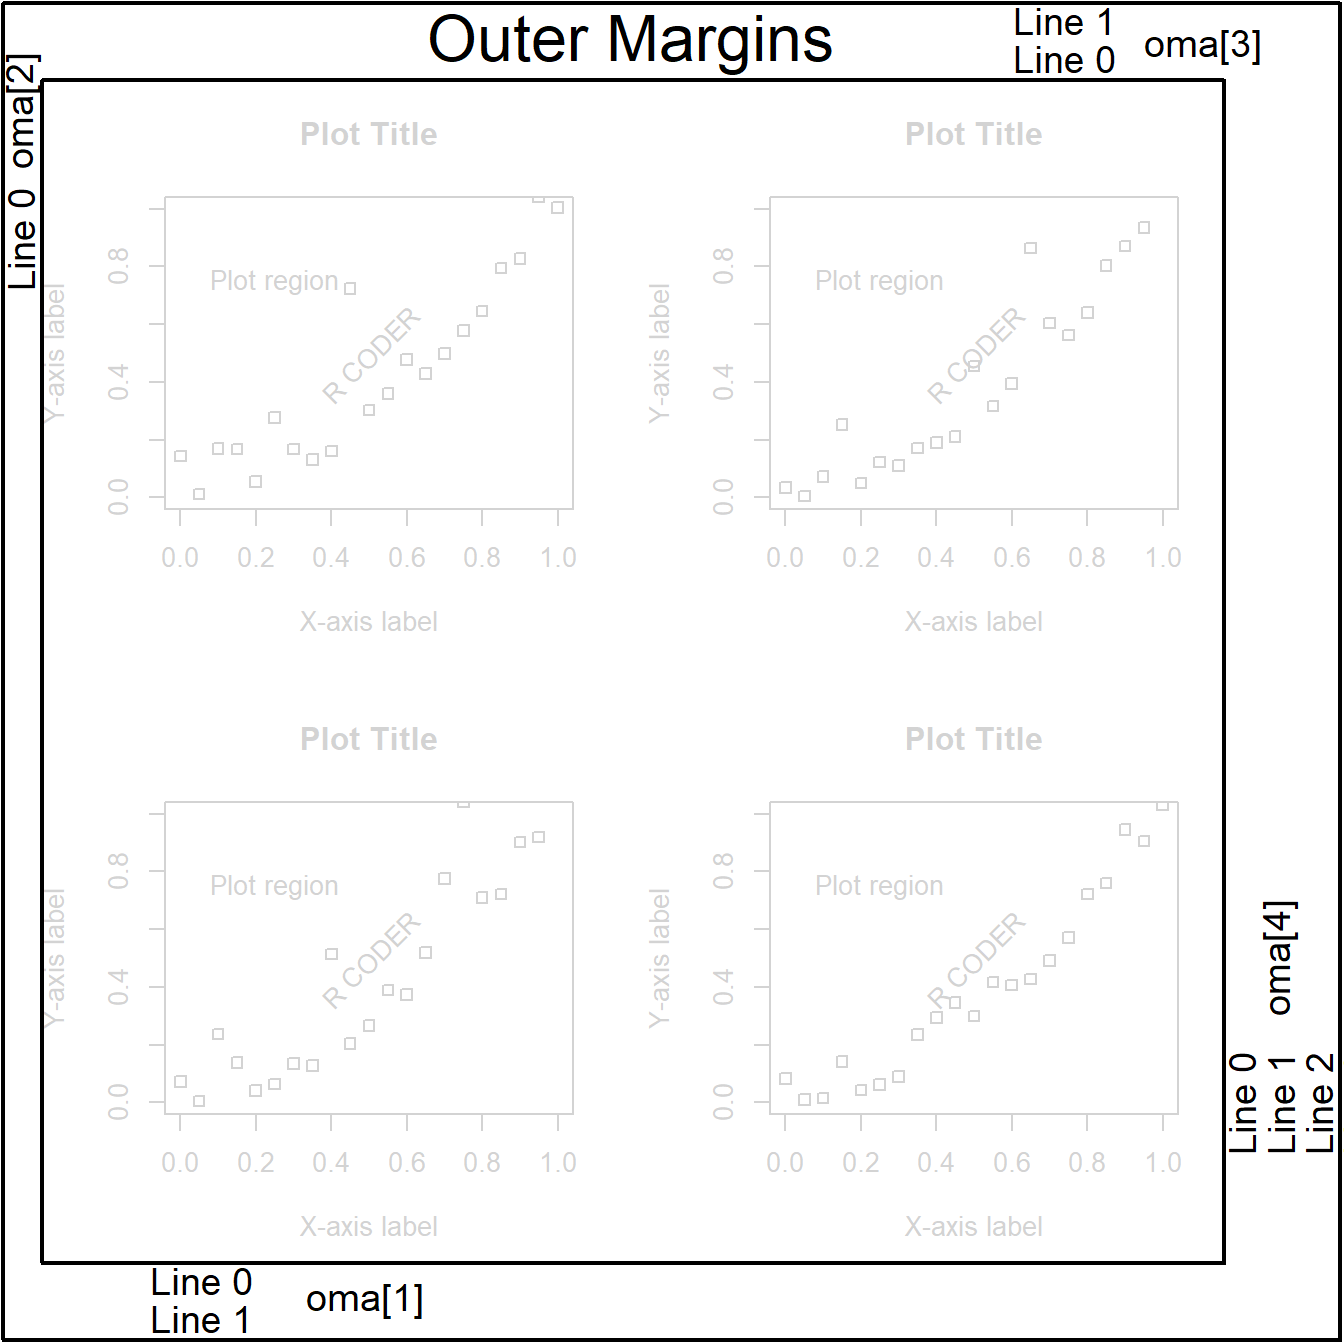
By default, par(oma = c(0, 0, 0, 0)). In this example we set par(oma = c(2, 1, 2, 3) + 0.1), so two lines are displayed below the plot, one on the left, two on the top and three on the right.
Example 1. Using oma
In the following example we added four margin lines on each side, so four stacked lines of text will fit out of the figure. The default figure boundaries are represented with a blue box and the new ones with a black box.
Default outer margins
# Default
curve(sin, 0, 20)

# Figure box
box("figure", col = 4)
# Text
mtext("Inner text",
      side = 3, adj = 1)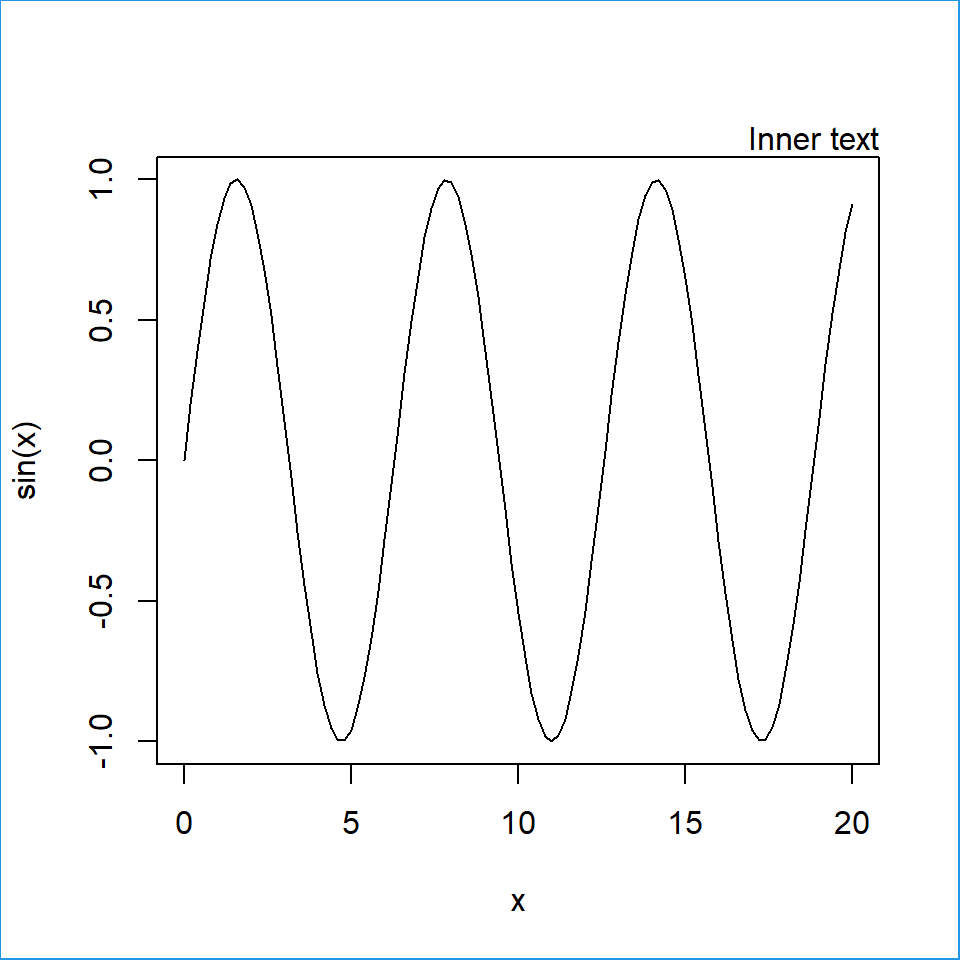
Longer outer margins
par(oma = c(4, 4, 4, 4)) # Outer margins
curve(sin, 0, 20)        # Plot
box("figure", col = 4)   # Box figure
mtext("Inner text", side = 3, adj = 1)
mtext("Outer text", side = 3, adj = 1,
      outer = TRUE)
par(oma = c(0, 0, 0, 0)) # Restore margins
box("figure", col = 1)   # Outer box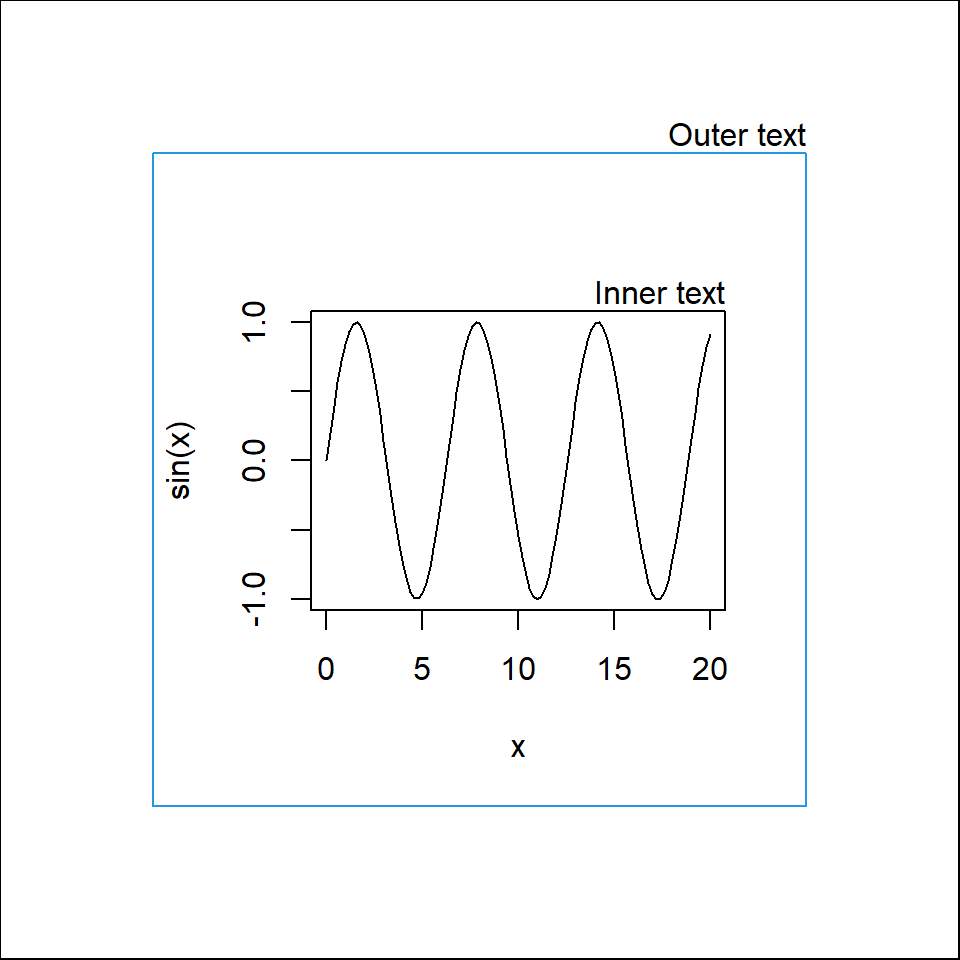
Example 2. Using omi
In this example we added 1 inch on the bottom and left margins. Once again, the boundaries of the default figure are represented with a blue box and the new ones with a black box, so you can visualize the difference.
Default outer margins
# Default
curve(sin, 0, 20)

# Figure box
box("figure", col = 4)

# Text
mtext("Inner text", side = 3, adj = 1)
Bottom and left outer margins
par(omi = c(1, 1, 0, 0)) # Outer margins
curve(sin, 0, 20)        # Plot
box("figure", col = 4)   # Inner box
mtext("Inner text", side = 3, adj = 1)
mtext("Outer text", side = 1, adj = 0,
      outer = TRUE)
par(oma = c(0, 0, 0, 0)) # Restore margins
box("figure", col = 1)   # Outer box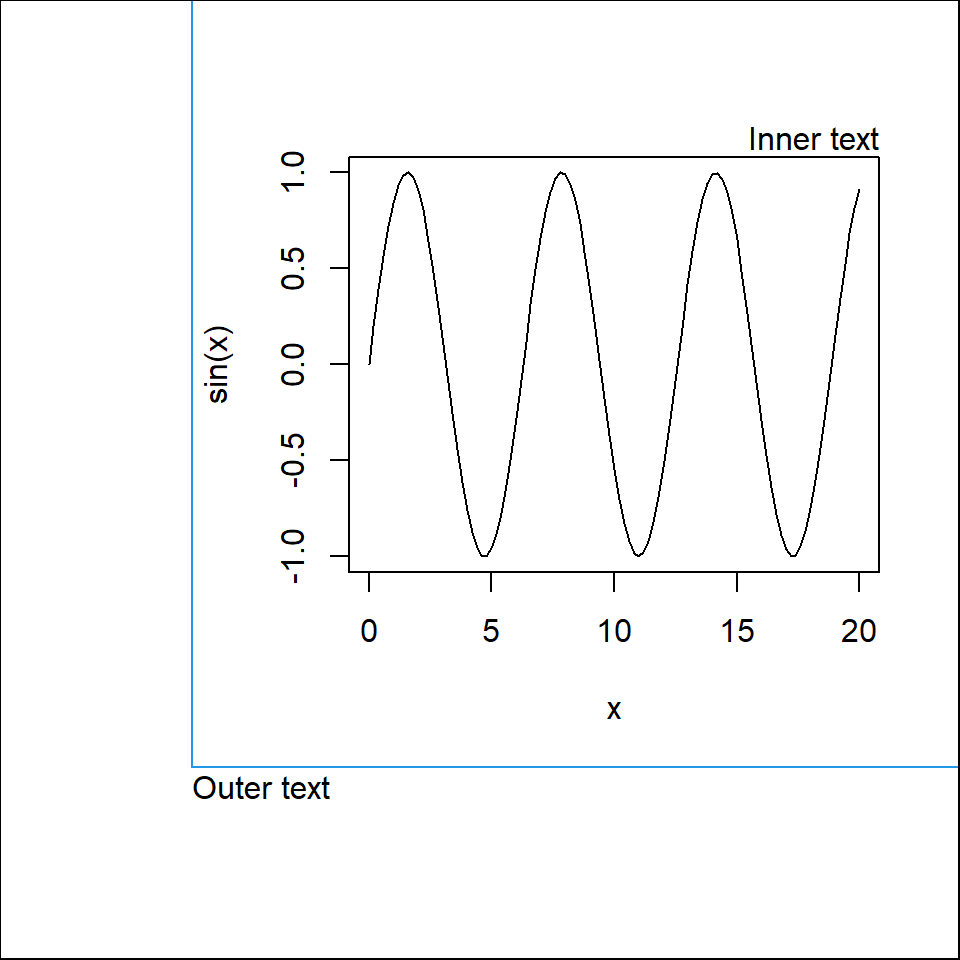

Master Statistics
Learn statistics from the basics to advanced techniques, clearly explained
Go to site