The box function
The R box function allows adding a box around plots. This is particularly useful when you add a new axis with the axis function and want to draw the box again. You can also customize the color, the line type, the line width and even the type of the box.
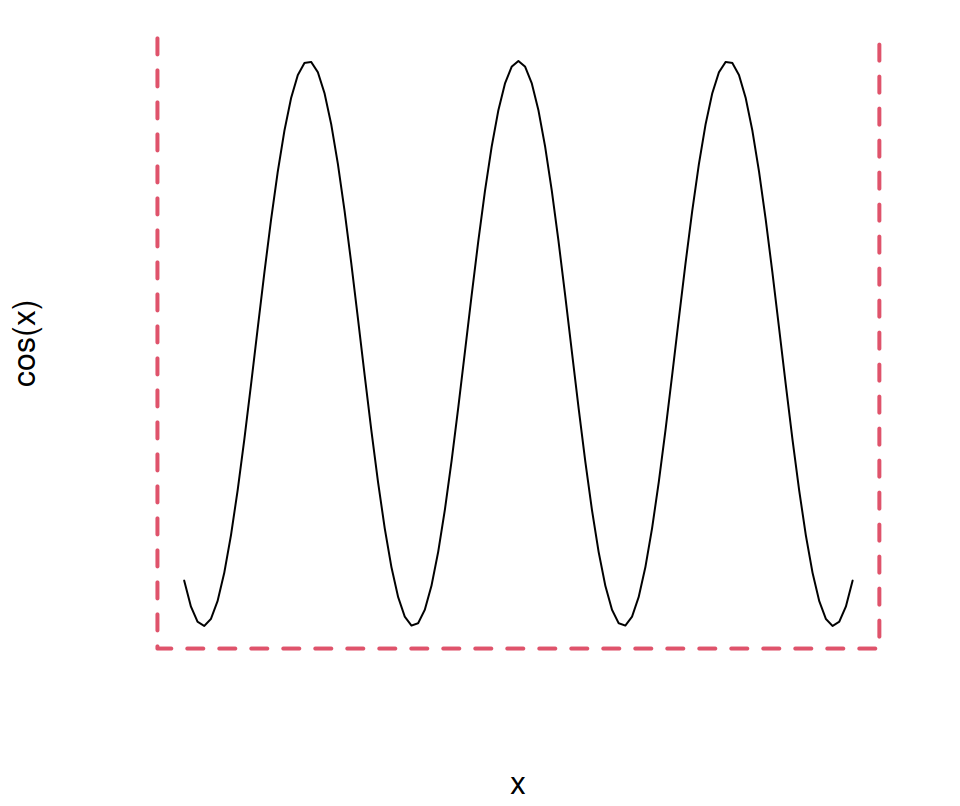
Example 1. Adding a blue box to the plot. Note that we set axes = FALSE to avoid displaying the default box and axes.
# Plot without axes
curve(cos, -10, 10, axes = FALSE)

# Blue dashed box
box(col = 4, lty = 2)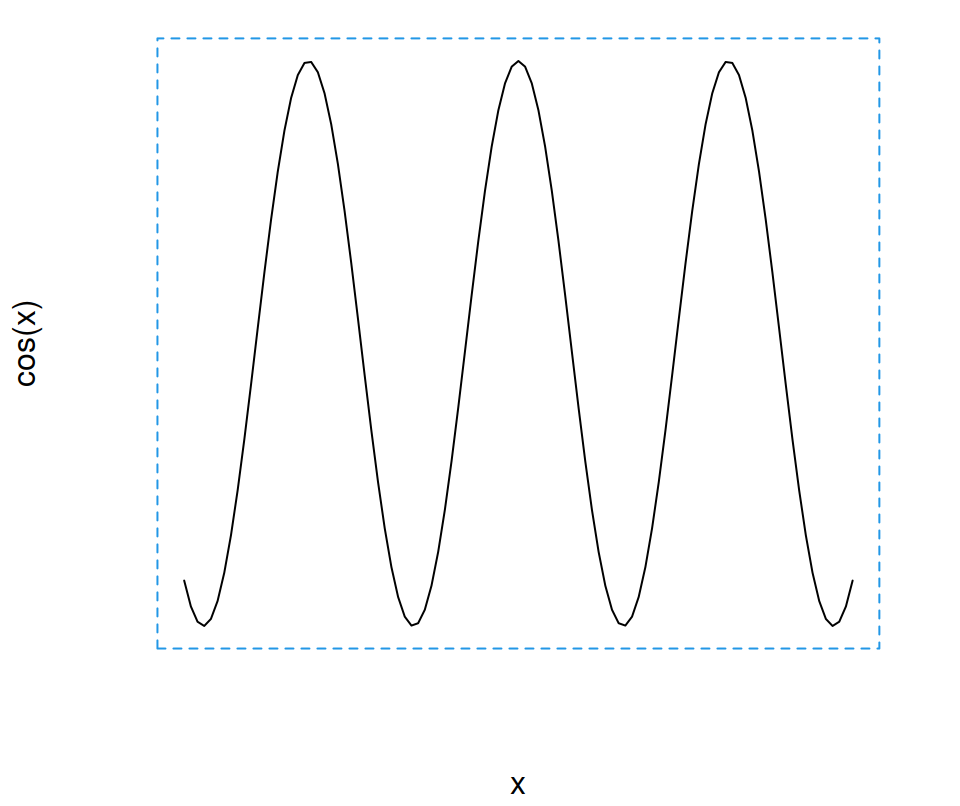
Example 2. Adding a box after modifying the axes with the axis function.
# Plot without axes
curve(cos, -10, 10, axes = FALSE)

# Custom axis
axis(1, at = c(-2 * pi, pi, -pi, 0, 2 * pi),
     labels = expression(-2 * pi, -pi, 0,
                         pi, 2 * pi))

axis(2, lwd = 2, lty = 2)

# Box with wide line
box(lwd = 2)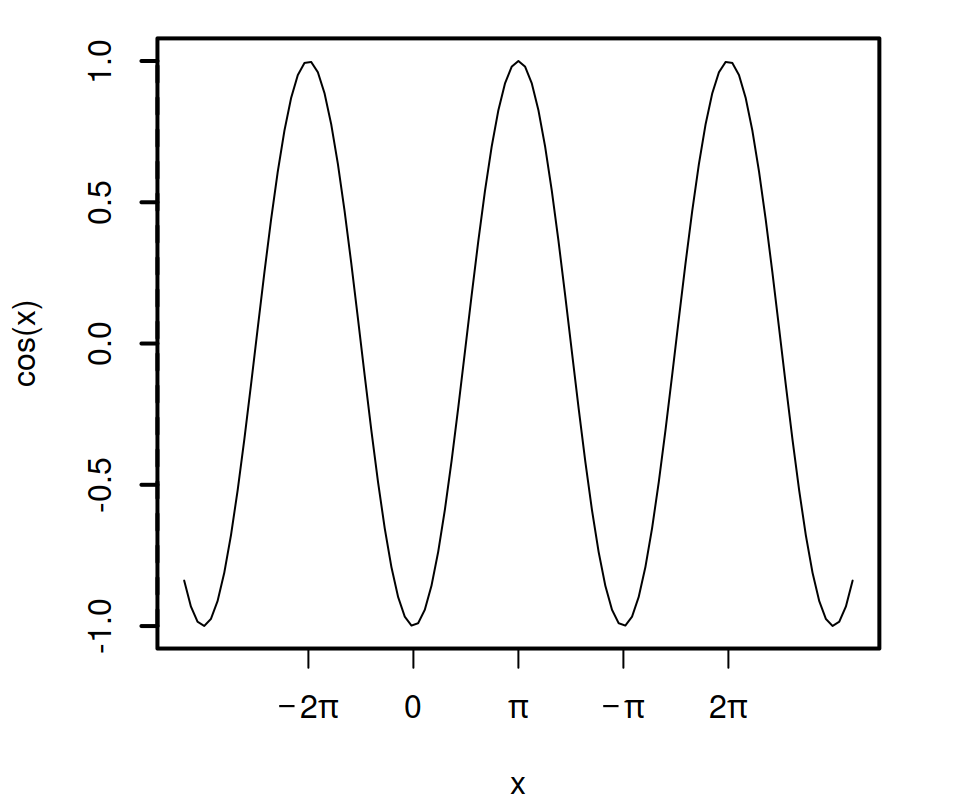
Example 3. Adding a box to the whole plot.
# Plot without axes
curve(cos, -10, 10)

# Border box
box("figure", col = 4, lwd = 4)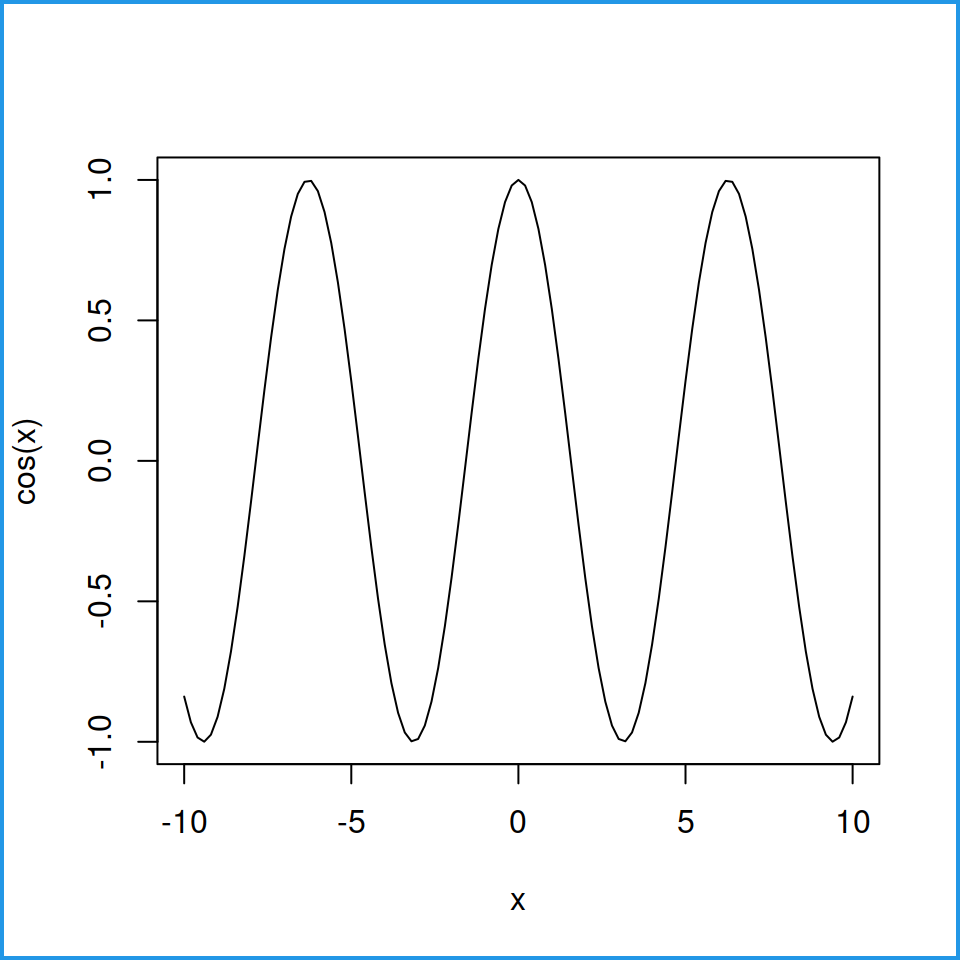
Box type with bty argument
By default, base R plots have a box around them. This box can be customized with the bty argument of the corresponding function. If the plotting function does not support this argument (like boxplot) you can set it inside par function.

Full box: bty = "o" (Default)
curve(cos, -10, 10,
      bty = "o")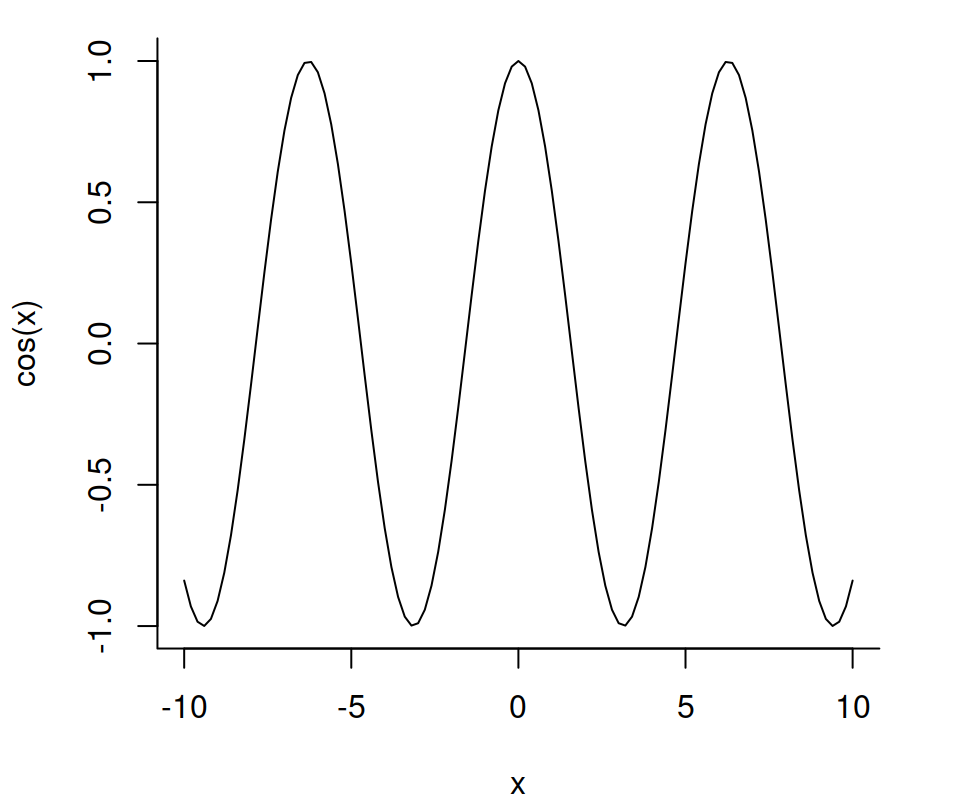
Left and bottom: bty = "L"
curve(cos, -10, 10,
      bty = "L")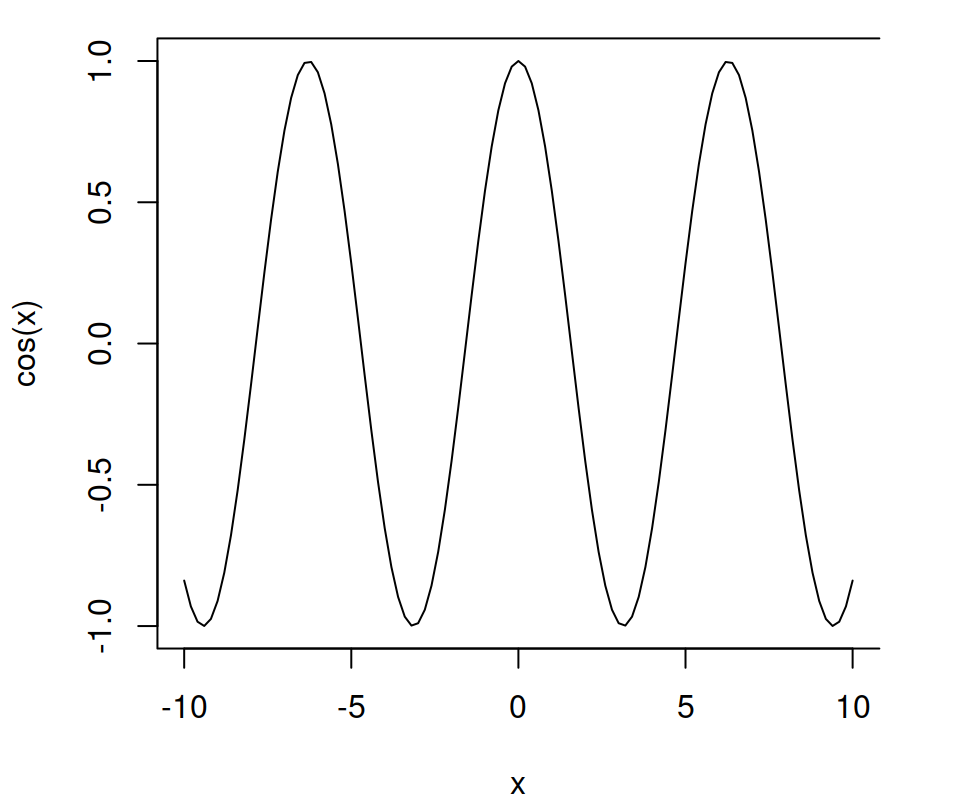
Top, left and bottom: bty = "C"
curve(cos, -10, 10,
      bty = "C")
Top and right: bty = "7"
curve(cos, -10, 10,
      bty = "7")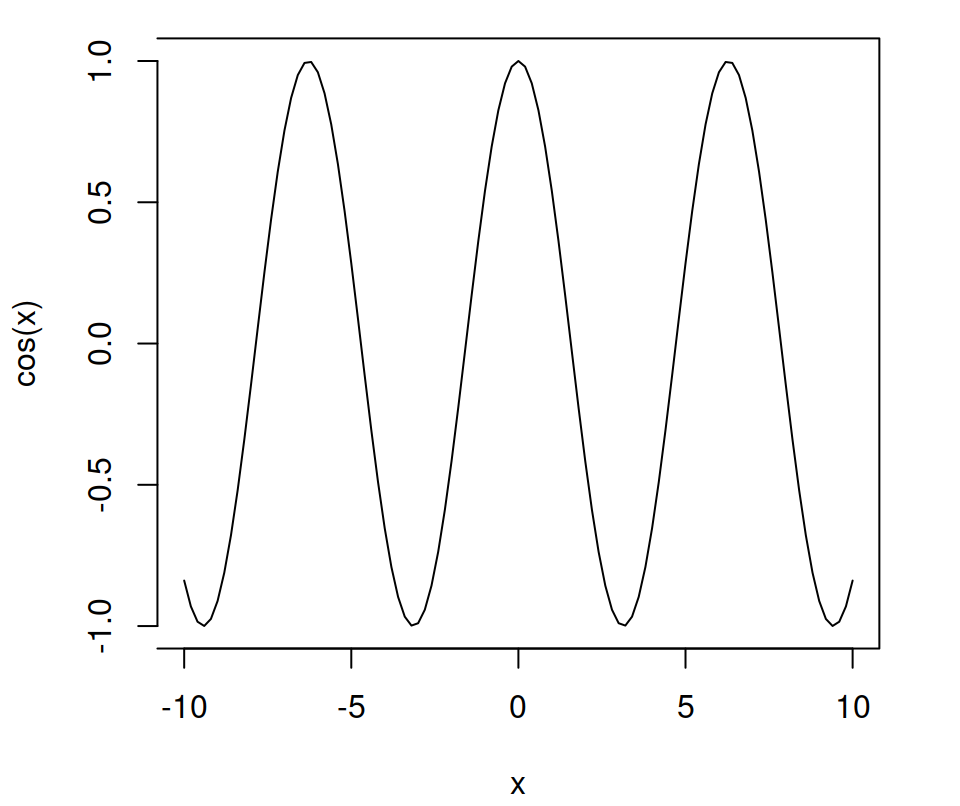
Top, right and bottom: bty = "]"
curve(cos, -10, 10,
      bty = "]")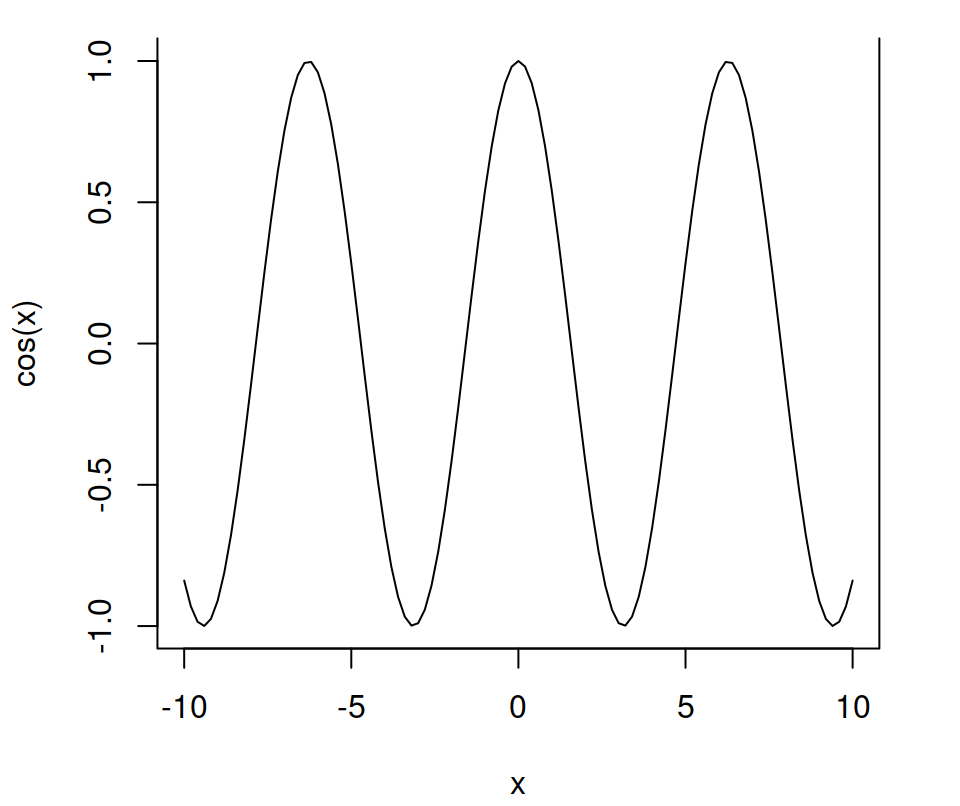
Left, bottom and right: bty = "U"
curve(cos, -10, 10,
      bty = "U")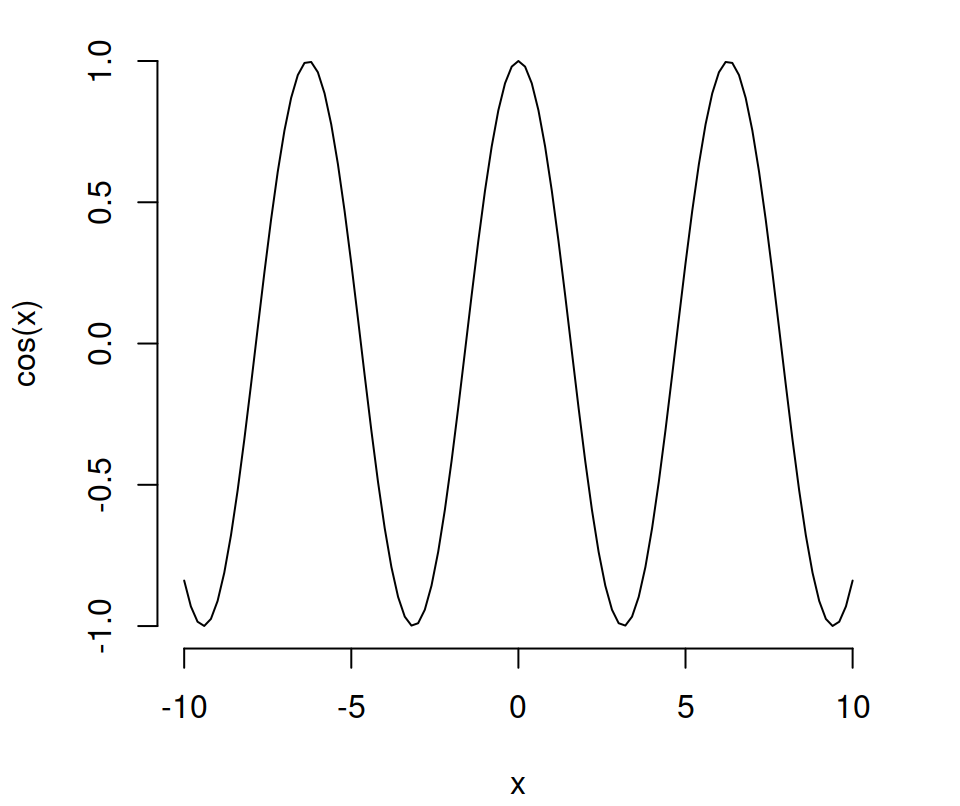
No box: bty = "n"
curve(cos, -10, 10,
      bty = "n")
The bty argument can also be used within the box function, which allows customizing the color, the type and the width of the box.
curve(cos, -10, 10,
      axes = FALSE)

box(col = 2, bty = "U", lty = 2, lwd = 2)
As we pointed out before, with some functions you will need to specify the argument inside the par function. As an example, if you want to draw a box plot without a box you can type:
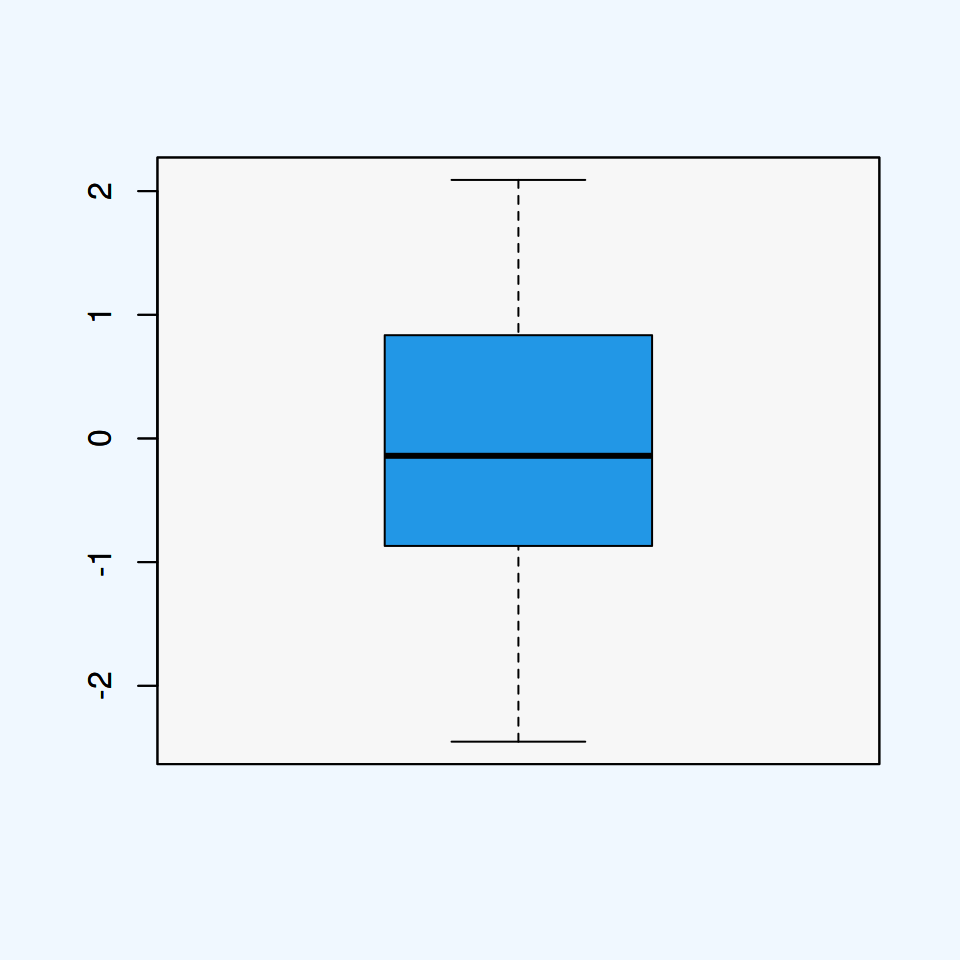
par(bty = "n")

# Data
set.seed(1)
x <- rnorm(50)

# Plot
boxplot(x)
Note that "o", "7", "]", "L" and "U" represent the sides of the box that are actually drawn. This is a good way to remember them. You can also set the letters in lower case instead of in upper case.

Master Statistics
Learn statistics from the basics to advanced techniques, clearly explained
Go to site