CUSTOMIZATION
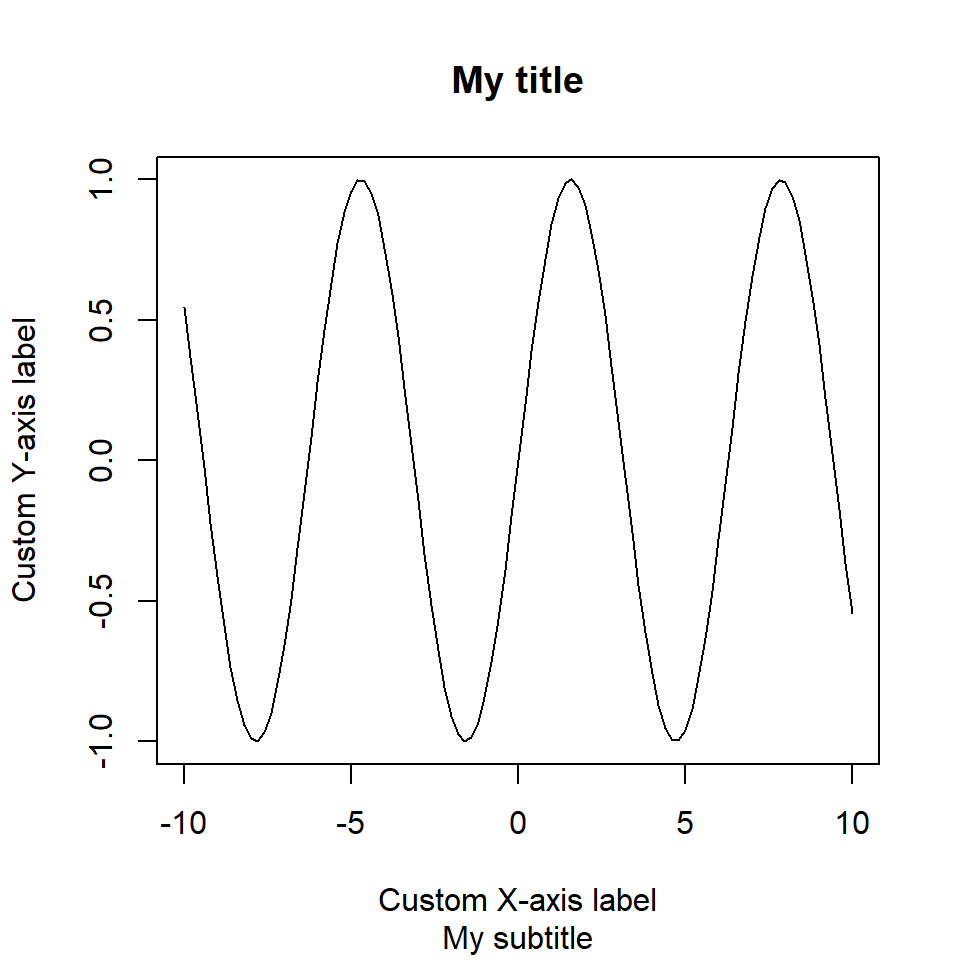
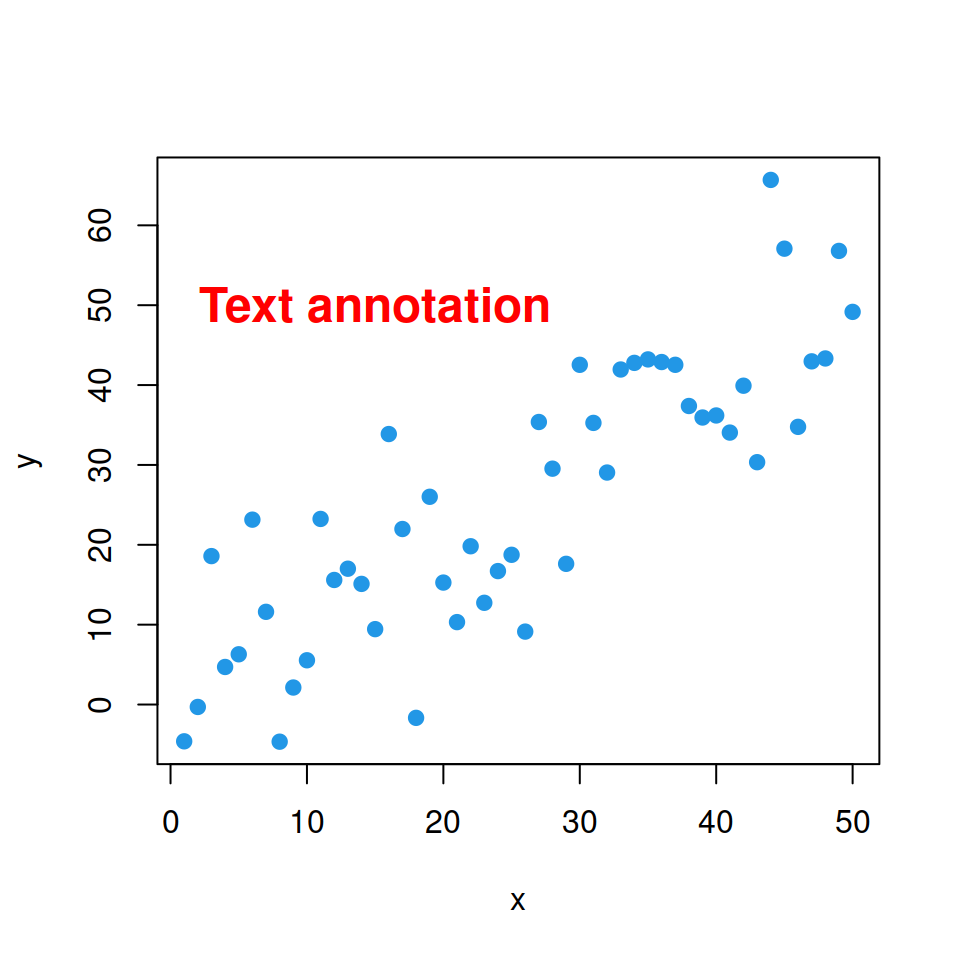
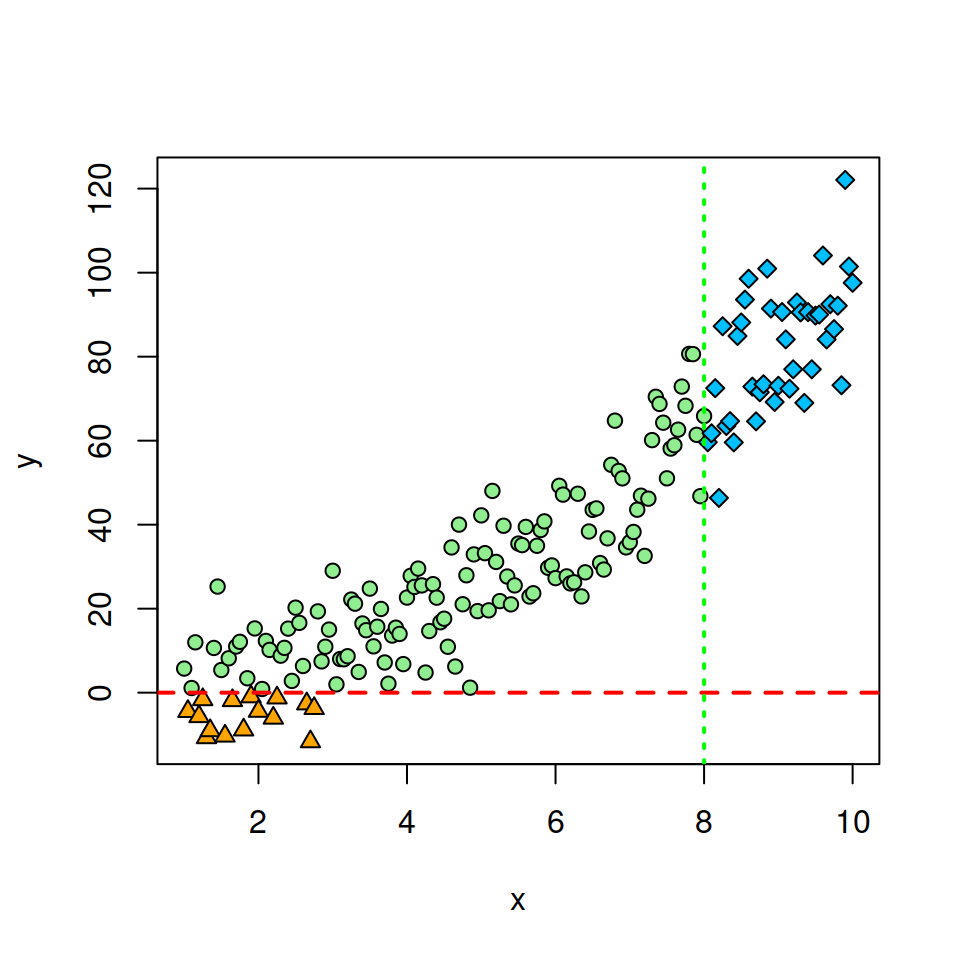
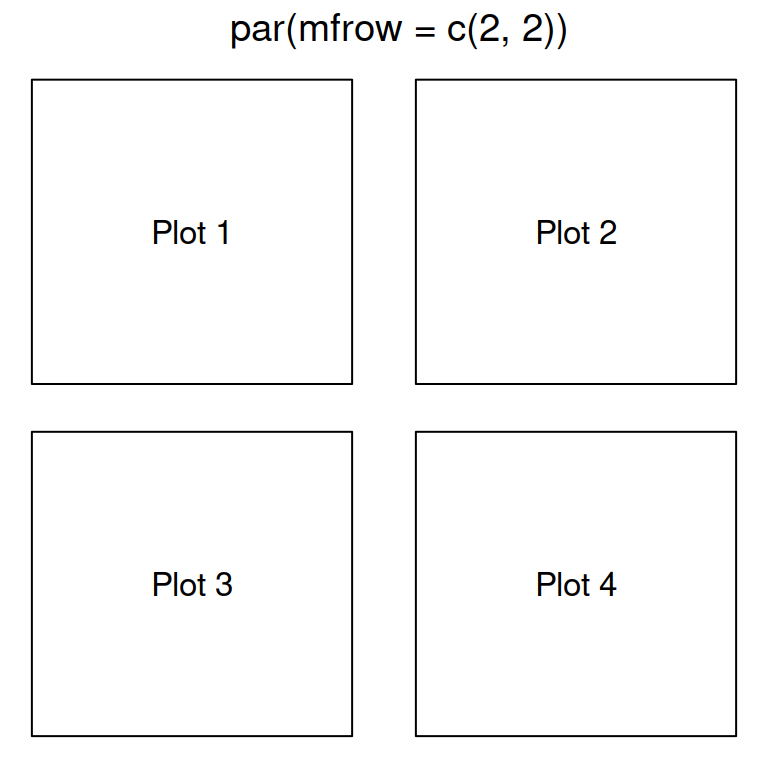
Base R graphics functions (known as high-level plotting functions) can be customized adding legends, texts, grids, modifying the axes, among other functions (known as low-level plotting functions). You can also customize graphical parameters via the arguments of the par function. The latter will allow you to combine plots, change the background color or the margins, for instance. The following tutorials will teach you how to make these customizations.


ALL BASE R CHARTS
The following list contains all the base R graphics tutorials of this site. Each tutorial contains the reproducible code of different customizations of the same or equivalent chart. If you want to filter them choose a category and select Base R.