There exists three main ways to add a grid to a plot in base R: using grid, axis or abline functions.
The grid function
The grid function is specifically designed to add grids to an existing plot. The function allows modifying the number of sections where to divide each axis with the nx and ny arguments, e.g. nx = 2 will create only a vertical line. You can also modify the color, width and type of the lines with the col, lwd and lty arguments, respectively.
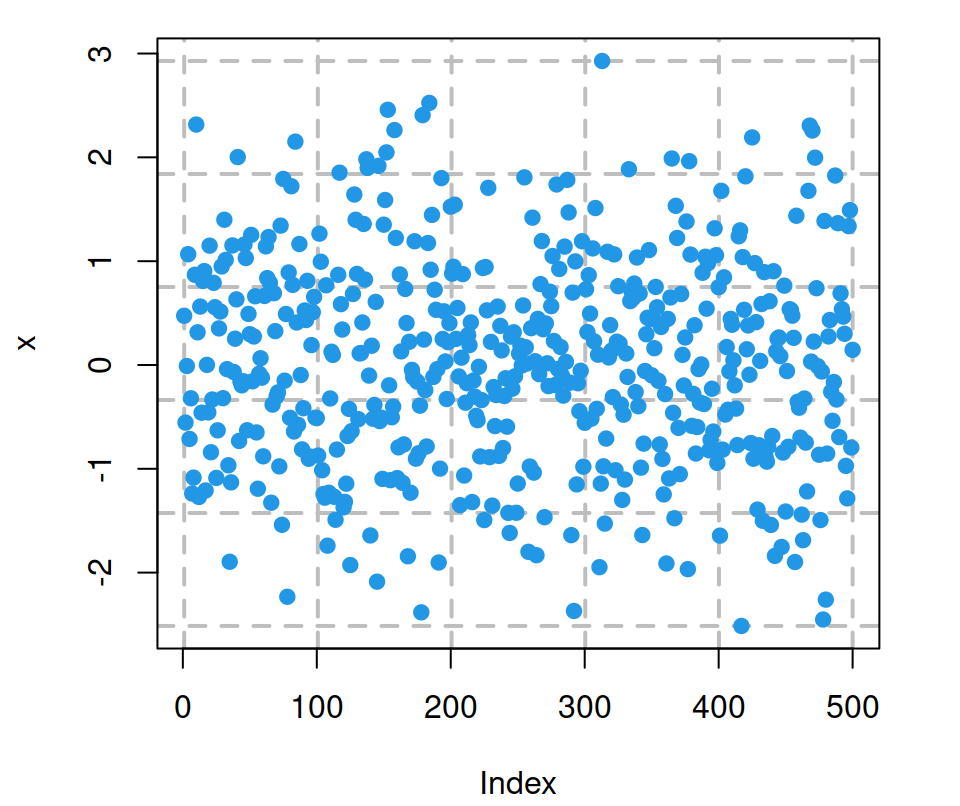
Option 1. Add grid to X and Y axis.
# Data
set.seed(132)
x <- rnorm(500)

plot(x, pch = 19, col = 4)
grid(nx = NULL, ny = NULL,
     lty = 2,      # Grid line type
     col = "gray", # Grid line color
     lwd = 2)      # Grid line width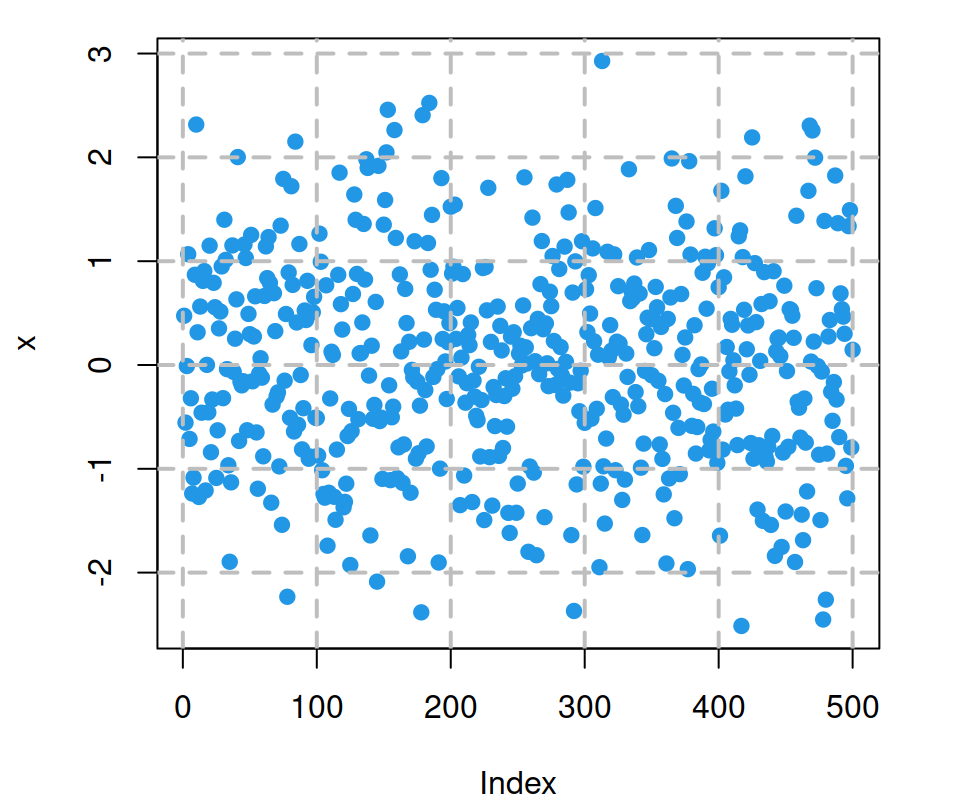
Option 2. Add grid only to Y-axis.
# Data
set.seed(132)
x <- rnorm(500)

plot(x, pch = 19, col = 4)
grid(nx = NA,
     ny = NULL,
     lty = 2, col = "gray", lwd = 2)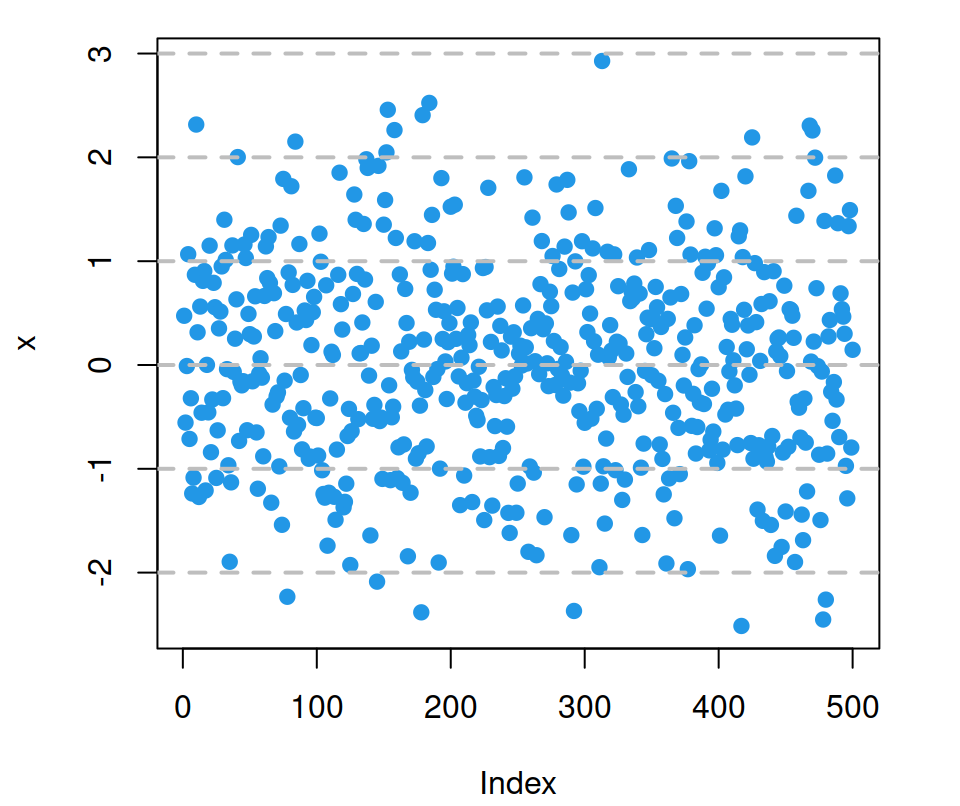
Option 3. Add grid only to X-axis.
# Data
set.seed(132)
x <- rnorm(500)

plot(x, pch = 19, col = 4)
grid(nx = NULL,
     ny = NA,
     lty = 2, col = "gray", lwd = 2)
Option 4. Customize the number of division sections with nx and ny arguments.
# Data
set.seed(132)
x <- rnorm(500)

plot(x, pch = 19, col = 4)
grid(nx = 2, # X-axis divided in two sections
     ny = 3, # Y-axis divided in three sections
     lty = 2, col = "gray", lwd = 2)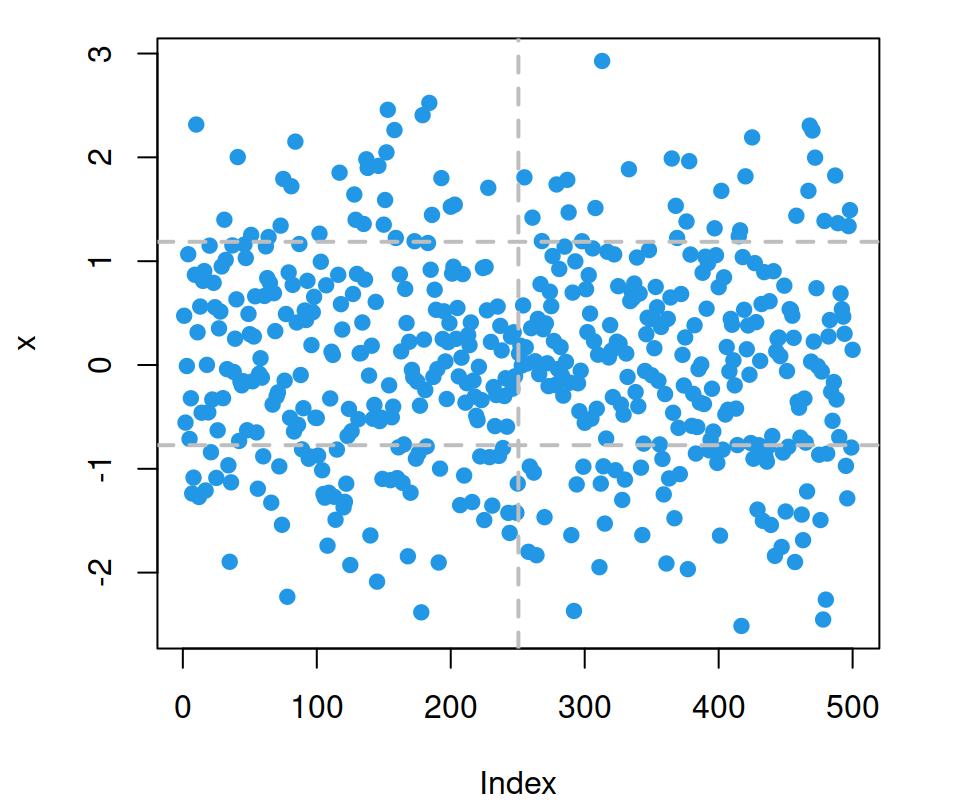
Grid below plot
You may have noticed that the grid is added over the plot. In case you want to have the grid below your plot you have to add your plot over.
Option 1. You can use plot.new() and par(new = TRUE). However, the grid won’t match the axis ticks.
# Data
set.seed(132)
x <- rnorm(500)

plot.new()

grid(nx = NULL, ny = NULL,
     lty = 2, col = "gray", lwd = 2)

par(new = TRUE)
plot(x, pch = 19, col = 4)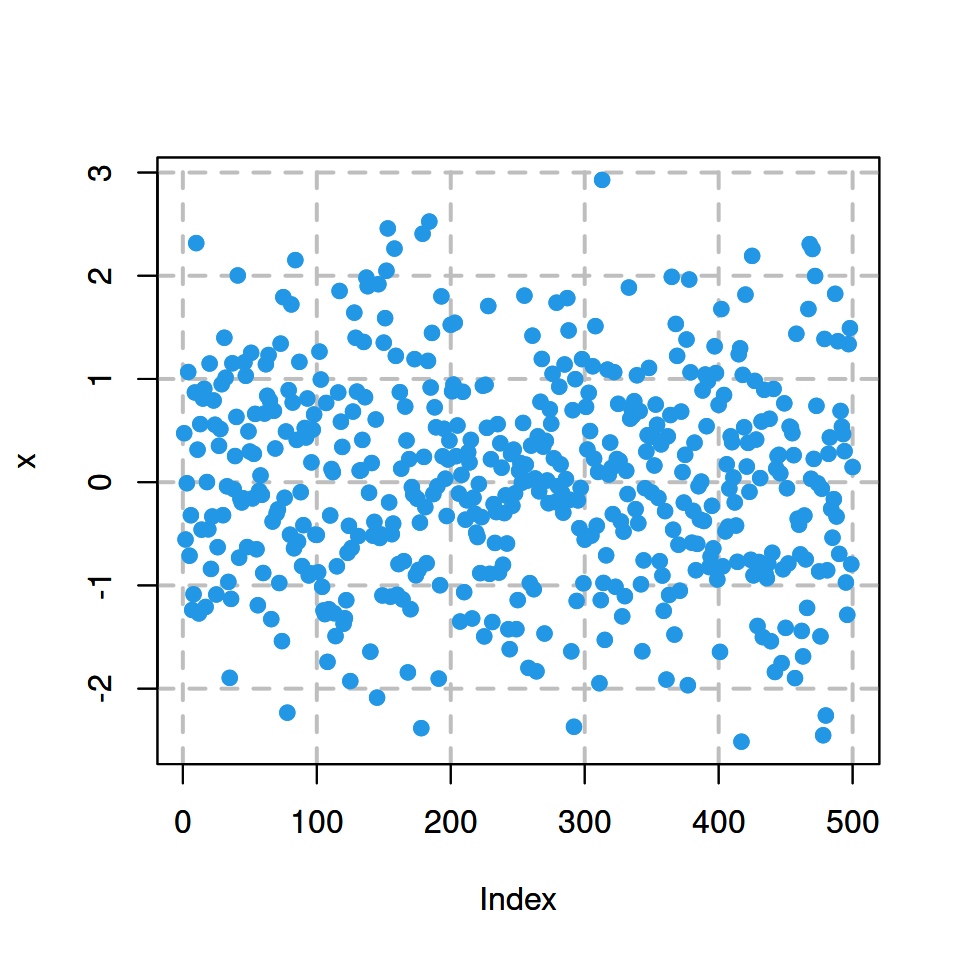
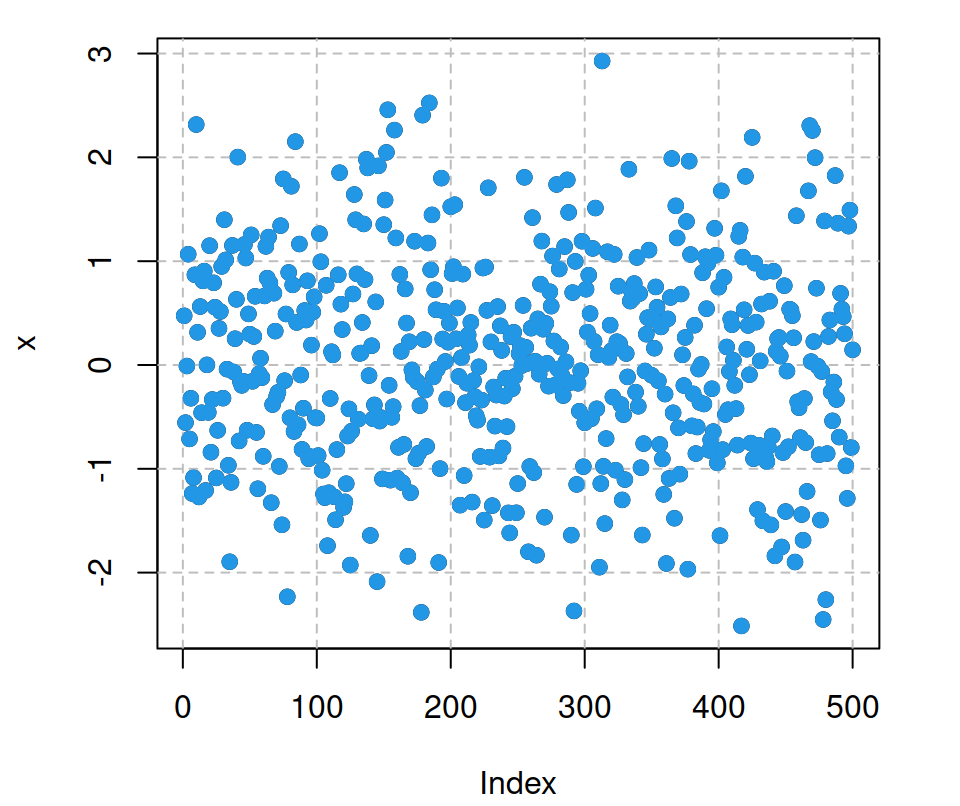
Option 2. Instead of using plot.new() you can use the plotting function to plot your data:
# Data
set.seed(132)
x <- rnorm(500)

plot(x)

grid(nx = NULL, ny = NULL,
     lty = 2, col = "gray", lwd = 2)

par(new = TRUE)
plot(x, pch = 19, col = 4)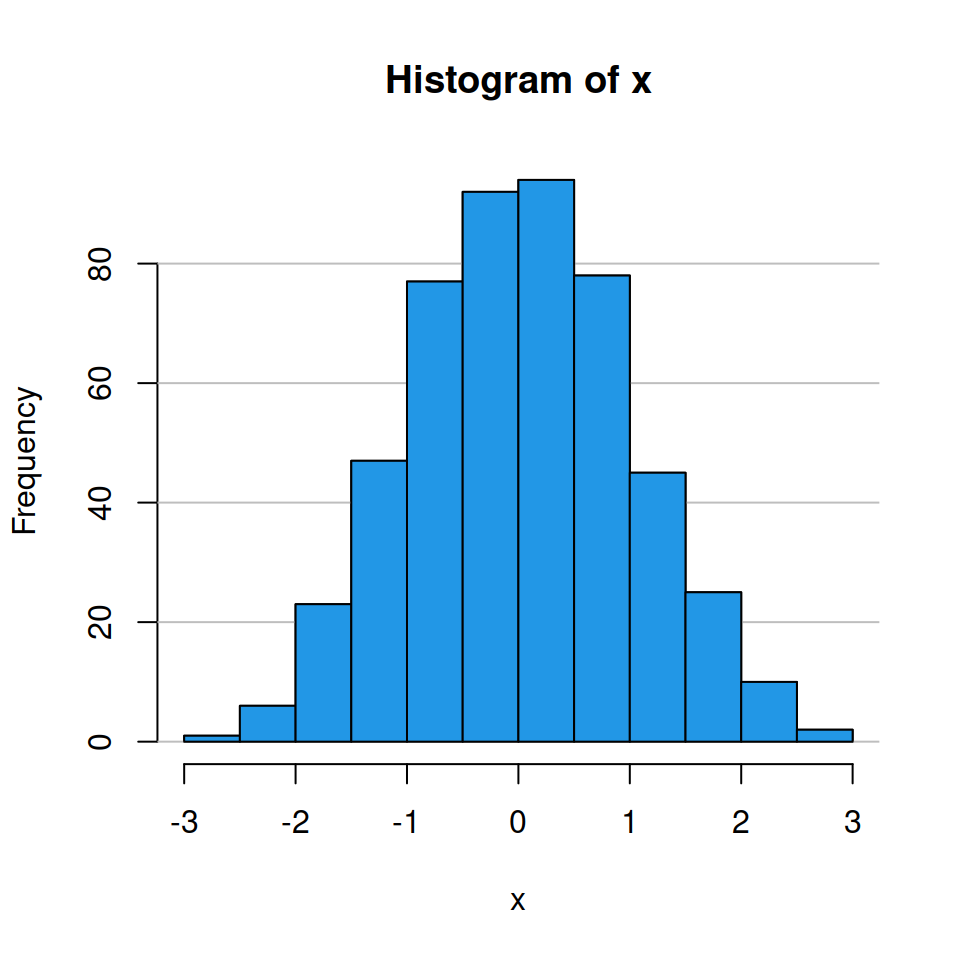
Option 3. If the plotting function you are using (like hist, boxplot or barplot) supports the argument add, set add = TRUE instead of par(new = TRUE).
# Data
set.seed(132)
x <- rnorm(500)

hist(x)
grid(nx = NA, ny = NULL,
     lty = 1, col = "gray", lwd = 1)
hist(x, col = 4,
     add = TRUE)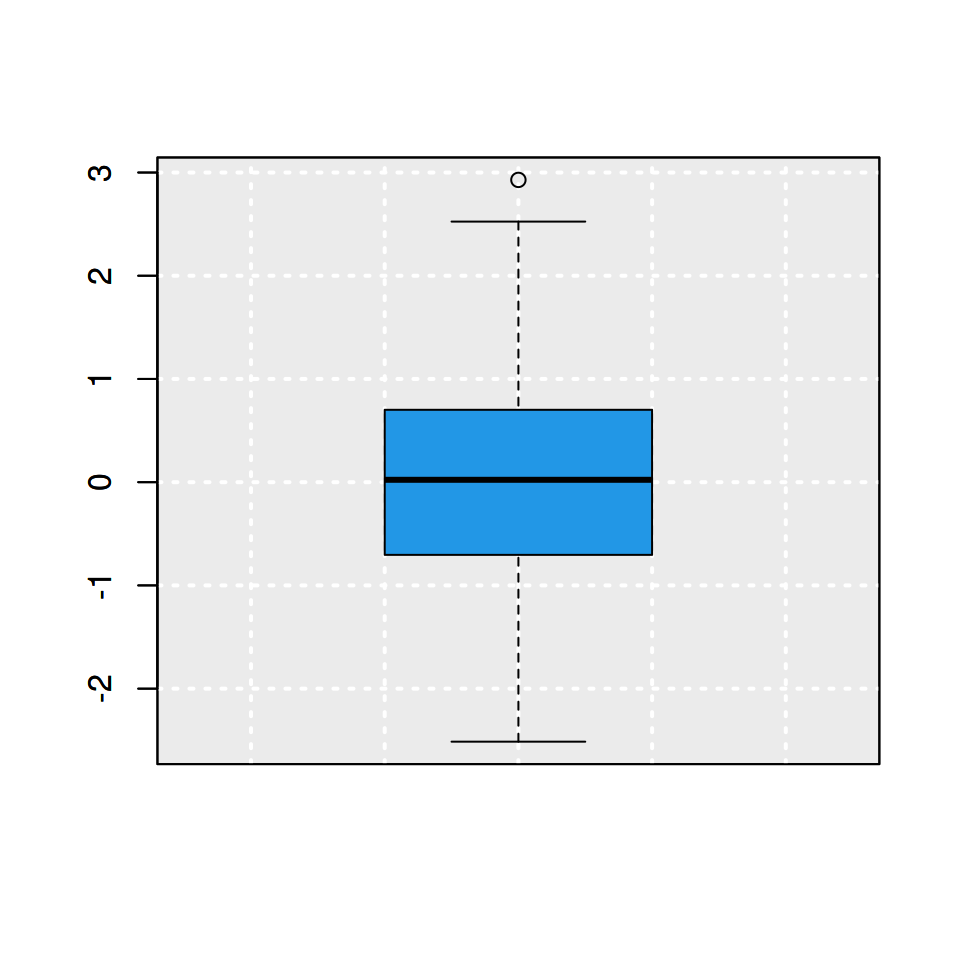
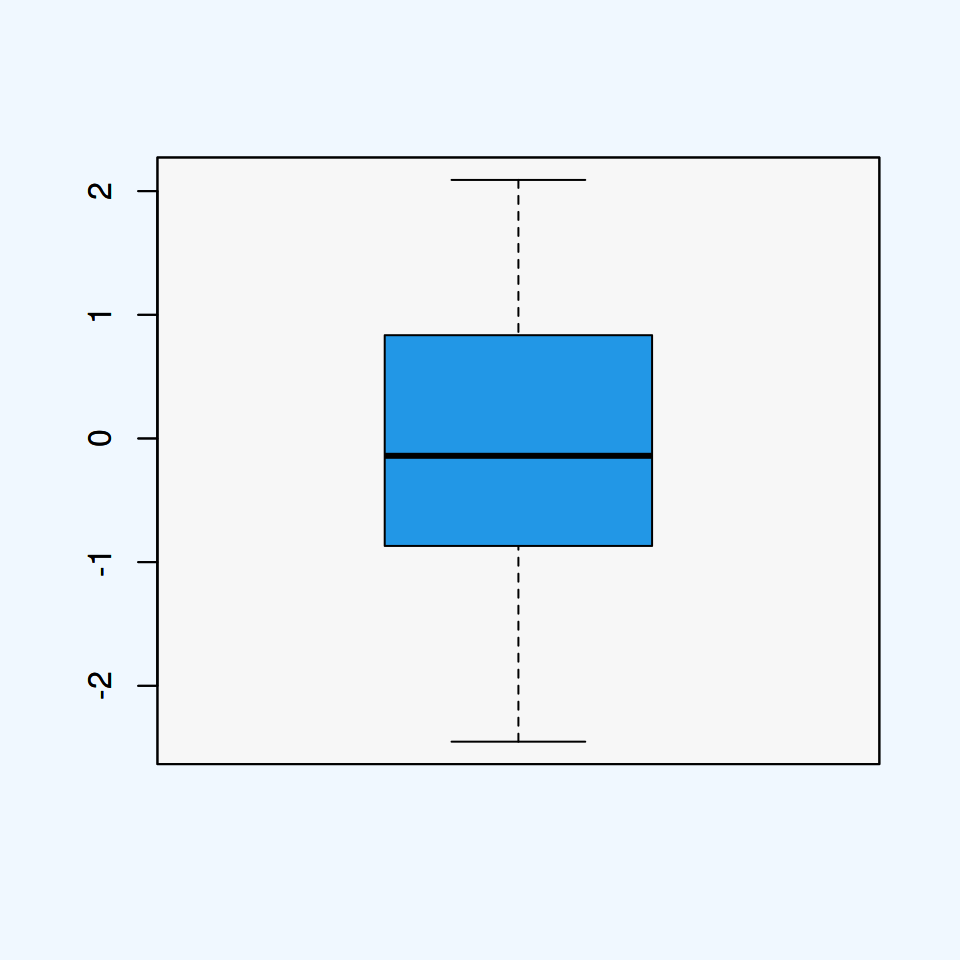
Note that you can add a background color and a grid at the same time as follows:
# Data
set.seed(132)
x <- rnorm(500)

boxplot(x)

# Light gray background
rect(par("usr")[1], par("usr")[3],
     par("usr")[2], par("usr")[4],
     col = "#ebebeb")

# Add white grid
grid(nx = NULL, ny = NULL,
     col = "white", lwd = 2)

# Boxplot
boxplot(x, col = 4, add = TRUE)
If your chart is a scatter plot you can add the points over the grid with the points function.
Adding a grid with the axis function
The axis function allows customizing the axes of the plots. However, if you set tck = 1 the tick marks of the axes will create a grid.
# Data
set.seed(132)
x <- rnorm(500)

plot(x, pch = 19, col = 4)

# Vertical grid
axis(1, tck = 1, lty = 2, col = "gray")

# Horizontal grid
axis(2, tck = 1, lty = 2, col = "gray")

# Grid below plot
par(new = TRUE)
plot(x, pch = 19, col = 4)

# Box of the plot
box()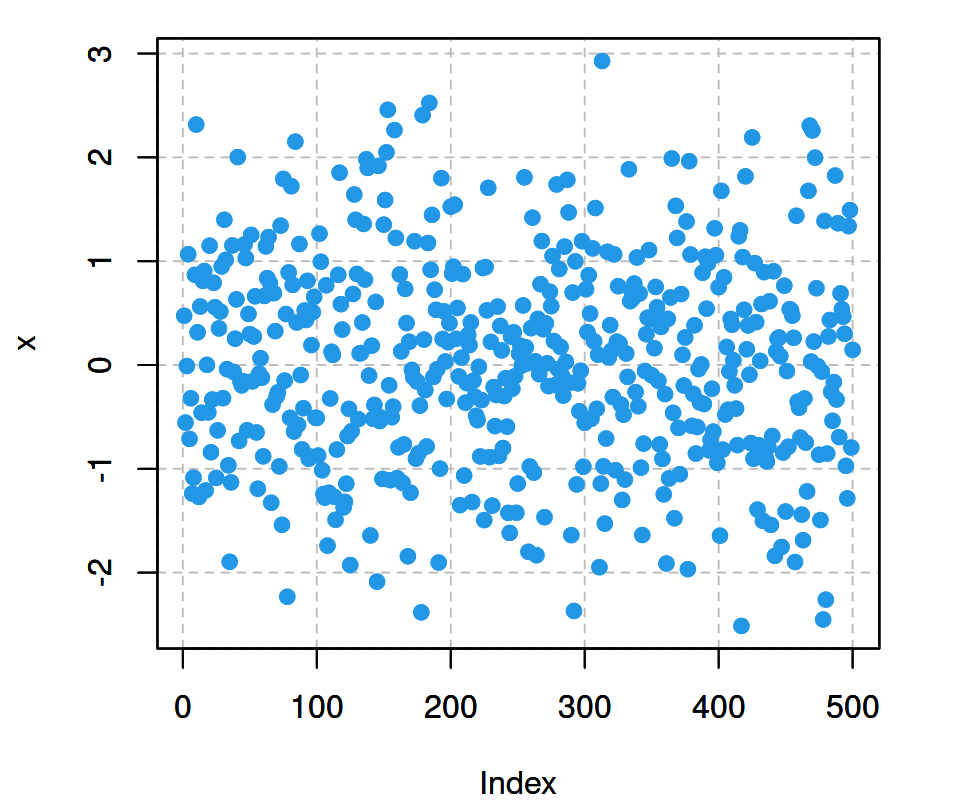
Grid with abline function
Similarly to axis, abline allows you to add grid lines at some values. The main benefit of this approach is that it doesn’t override the axis line, so you don’t have to use the box function to solve it.
# Data
set.seed(132)
x <- rnorm(500)

plot(x)

# Vertical grid
abline(v = seq(0, 500, 100),
       lty = 2, col = "gray")

# Horizontal grid
abline(h = seq(-3, 3, 1),
       lty = 2, col = "gray")

# Grid below points
points(x, pch = 19, col = 4)
Align grid to ticks
When the ticks of the plot are different from the default you can align them using the axis or abline functions in case that specifying nx or ny arguments of the grid function doesn’t align them.
# Data
set.seed(132)
x <- rnorm(500)

plot(x,
     xaxp = c(100, 400, 10),
     yaxp = c(-2, 2, 5))

# Vertical grid
axis(1,
     at = seq(100, 400, by = 20),
     tck = 1, lty = 2, col = "gray")

# Horizontal grid
axis(2,
     at = seq(-2, 2, by = 0.8),
     tck = 1, lty = 2, col = "gray")

# Box of the plot
box()

# Grid below points
points(x, pch = 19, col = 4)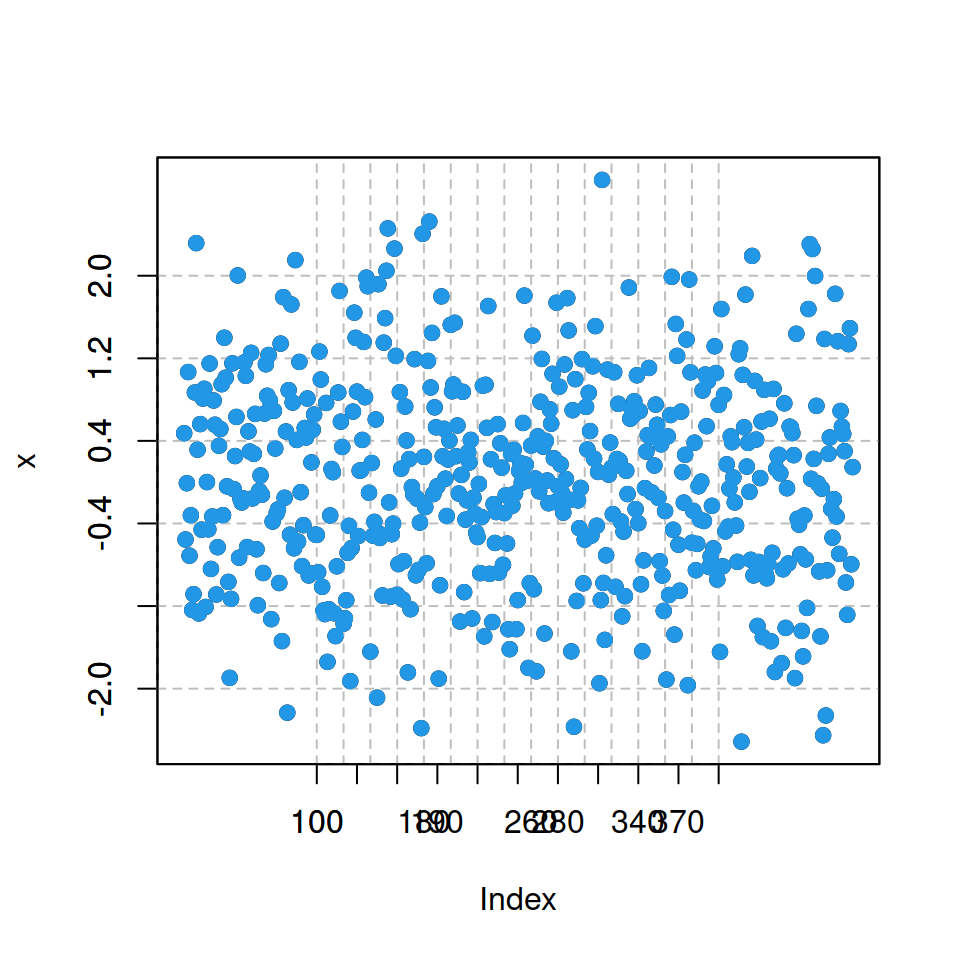
The same can be achieved making use of abline instead of axis.

Master Statistics
Learn statistics from the basics to advanced techniques, clearly explained
Go to site