Sample data set
The chordDiagram function can be used with an adjacency matrix or a data frame. In the following block of code a sample matrix and its equivalent data frame is shown.
set.seed(1)
m <- matrix(sample(15, 15), 5, 3)
rownames(m) <- paste0("Row", 1:5)
colnames(m) <- paste0("Col", 1:3)

# Or use a data frame
df <- data.frame(from = rep(rownames(m), ncol(m)),
                 to = rep(colnames(m), each = nrow(m)),
                 value = as.vector(m))
Basic chord diagram
Given a matrix or a data frame you can pass it to the chordDiagram function of the circlize package. The function will connect the values of the matrix with arcs assigning random colors for each arc every time you run the function.
# install.packages("circlize")
library(circlize)

chordDiagram(m)

# Restart circular layout parameters
circos.clear()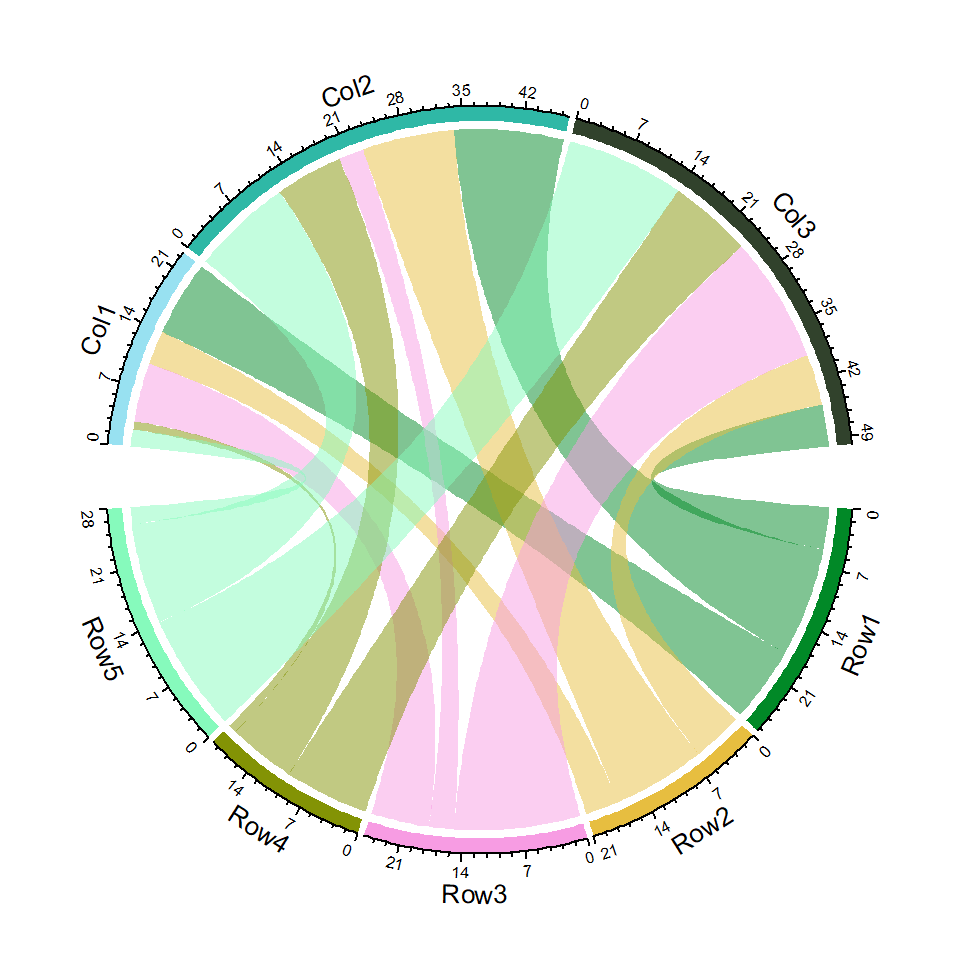
Color customization
Grid colors
The colors representing each columns or rows of the matrix can be customized passing a named vector to the grid.col argument of the function.
# install.packages("circlize")
library(circlize)

colors <- c(Col1 = "lightgrey", Col2 = "grey",
            Col3 = "darkgrey", Row1 = "#FF410D",
            Row2 = "#6EE2FF", Row3 = "#F7C530",
            Row4 = "#95CC5E", Row5 = "#D0DFE6")

chordDiagram(m, grid.col = colors)
circos.clear()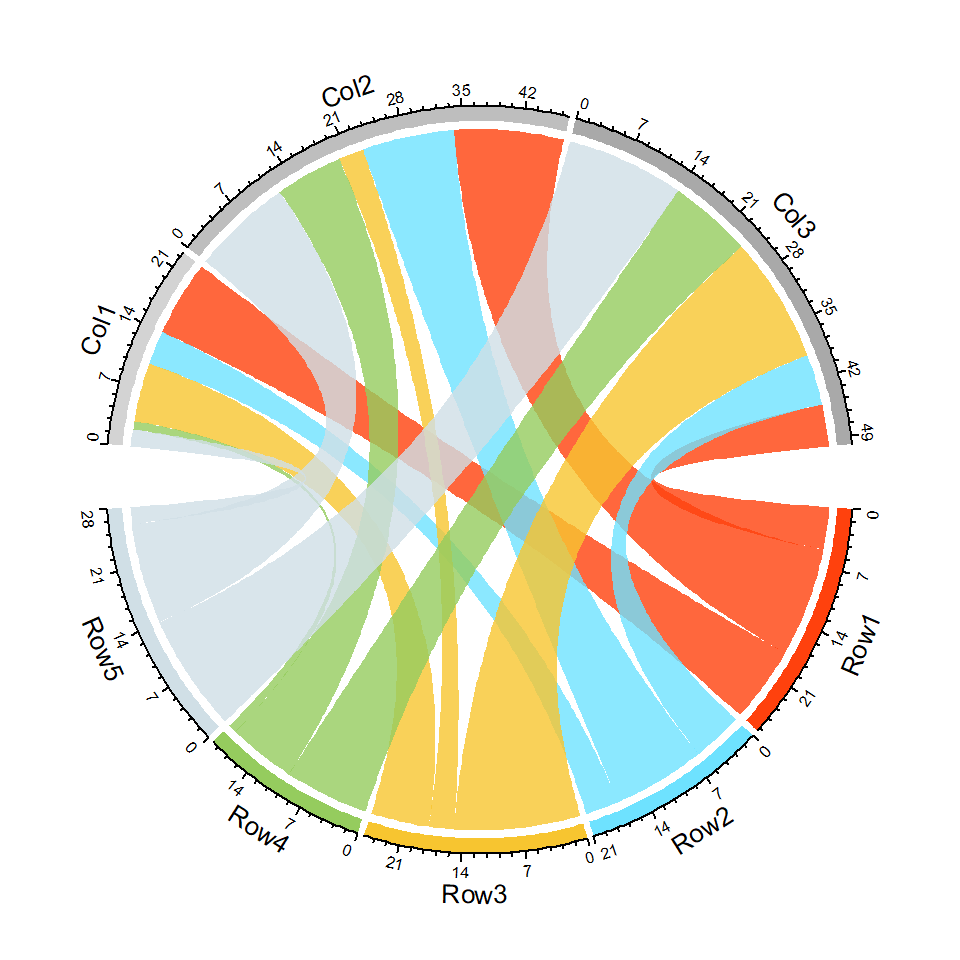
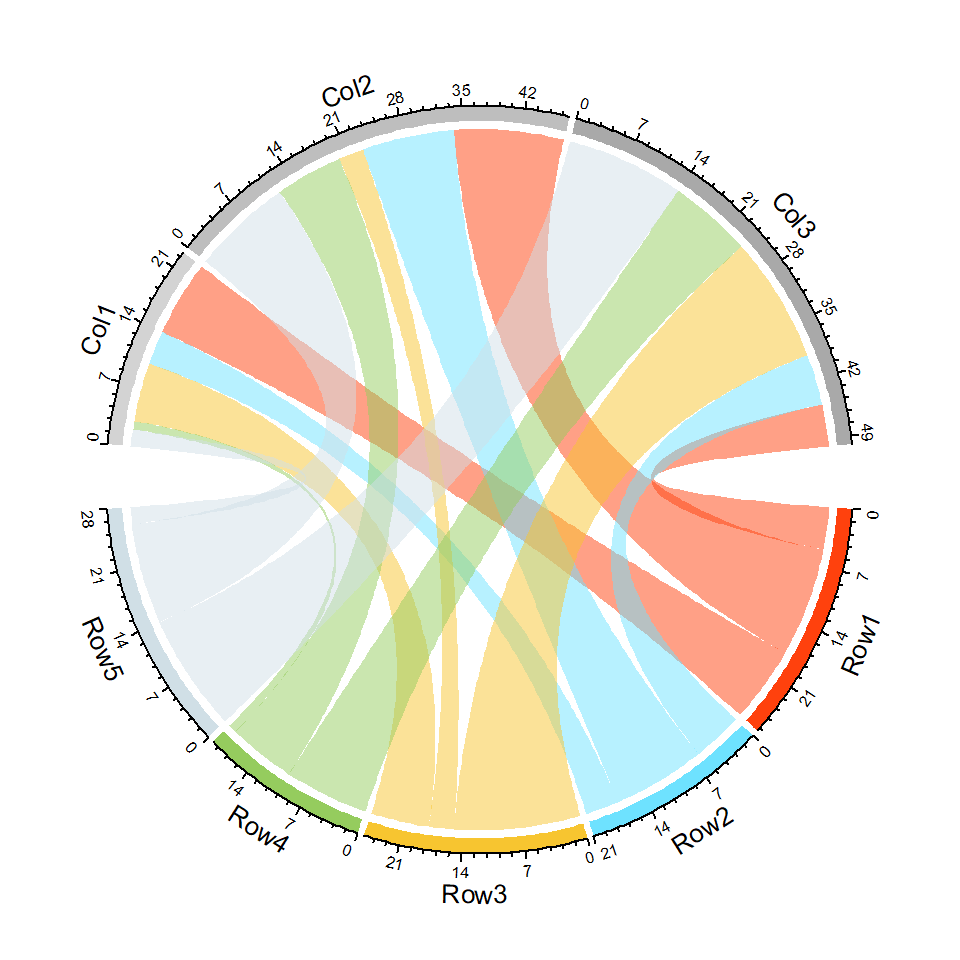
Transparency
The transparency argument controls the level of transparency of the arcs, the lower the more opaque the color. The default value is 0.5.
# install.packages("circlize")
library(circlize)

colors <- c(Col1 = "lightgrey", Col2 = "grey",
            Col3 = "darkgrey", Row1 = "#FF410D",
            Row2 = "#6EE2FF", Row3 = "#F7C530",
            Row4 = "#95CC5E", Row5 = "#D0DFE6")

chordDiagram(m, grid.col = colors,
             transparency = 0.2)
circos.clear()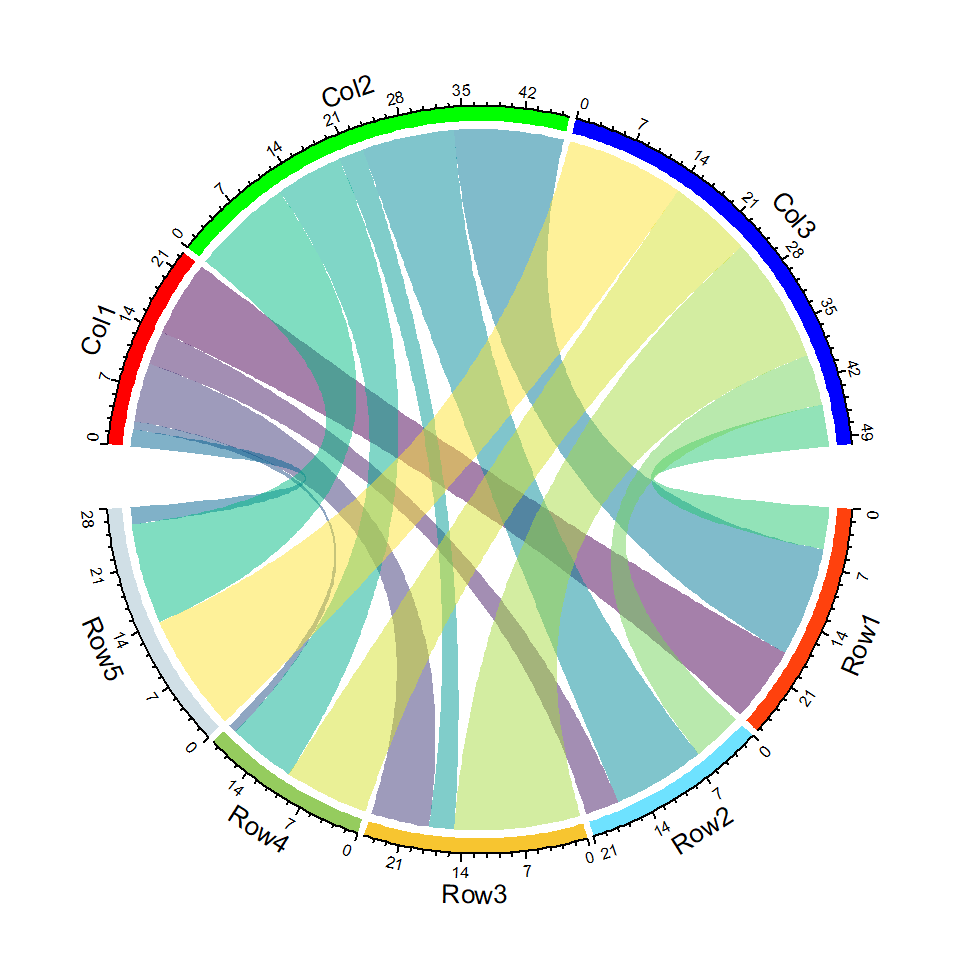
Link colors
The colors of the links can be controlled with the col argument. You will need to specify as many colors as the number of elements of the matrix. Alternatively you can use row.col and column.col.
# install.packages("circlize")
library(circlize)

colors <- c(Col1 = "red", Col2 = "green",
            Col3 = "blue", Row1 = "#FF410D",
            Row2 = "#6EE2FF", Row3 = "#F7C530",
            Row4 = "#95CC5E", Row5 = "#D0DFE6")

chordDiagram(m, grid.col = colors,
             col = hcl.colors(15))
circos.clear()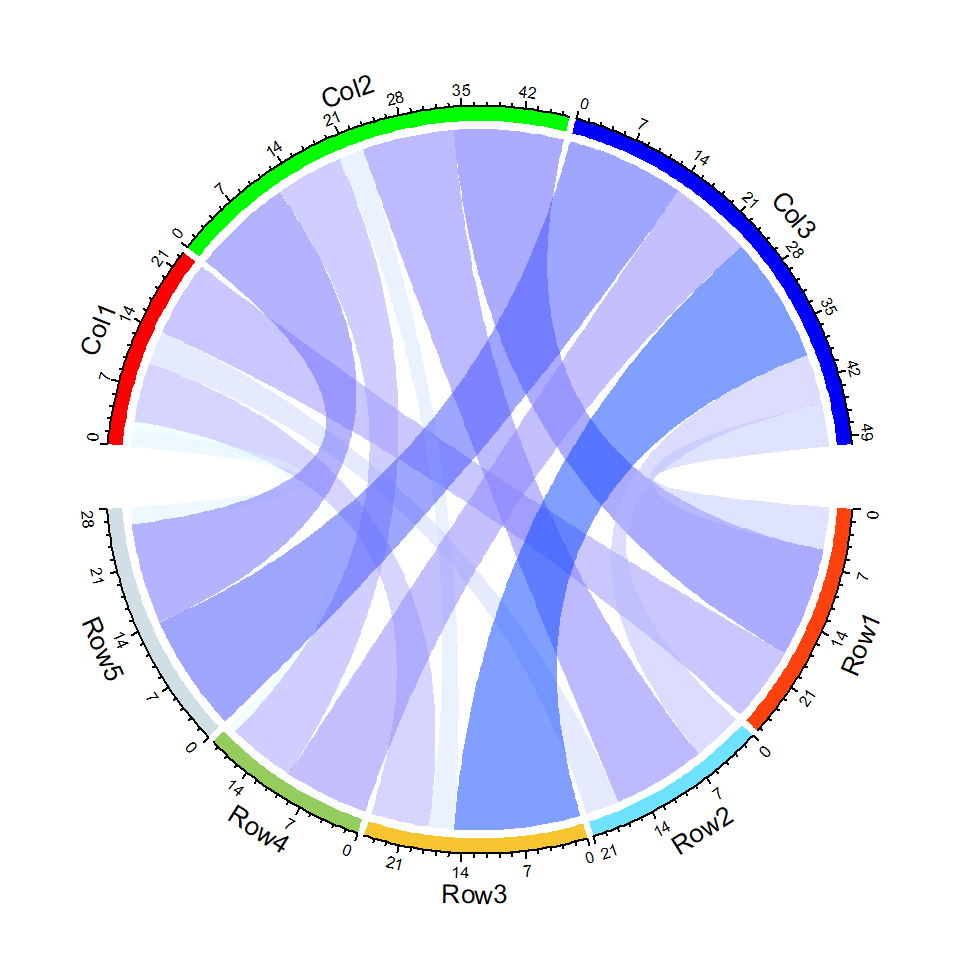
Using a color ramp palette
Note that the col argument also admits a color function created with colorRamp2, as shown in the example below.
# install.packages("circlize")
library(circlize)

colors <- c(Col1 = "red", Col2 = "green",
            Col3 = "blue", Row1 = "#FF410D",
            Row2 = "#6EE2FF", Row3 = "#F7C530",
            Row4 = "#95CC5E", Row5 = "#D0DFE6")
cols <- colorRamp2(range(m), c("#E5FFFF", "#003FFF"))

chordDiagram(m, grid.col = colors, col = cols)
circos.clear()
Link border customization
Link borders
The border of the links can be customized with link.lwd, link.lty and link.border for width, type and color of the link lines.
# install.packages("circlize")
library(circlize)

cols <- hcl.colors(15, "Temps")

chordDiagram(m,
             col = cols,
             transparency = 0.1,
             link.lwd = 1,    # Line width
             link.lty = 1,    # Line type
             link.border = 1) # Border color

circos.clear()
Border of specific rows
It should be noted that the link.border argument accepts a matrix as input. In the following example we are highlighting the third row of the matrix.
# install.packages("circlize")
library(circlize)

cols <- hcl.colors(15, "Geyser")
mb <- matrix("black", nrow = 1, ncol = ncol(m))
rownames(mb) <- rownames(m)[3] # Third row
colnames(mb) <- colnames(m)

chordDiagram(m,
             col = cols,
             transparency = 0.1,
             link.lwd = 2,     # Line width
             link.lty = 2,     # Line type
             link.border = mb) # Border color

circos.clear()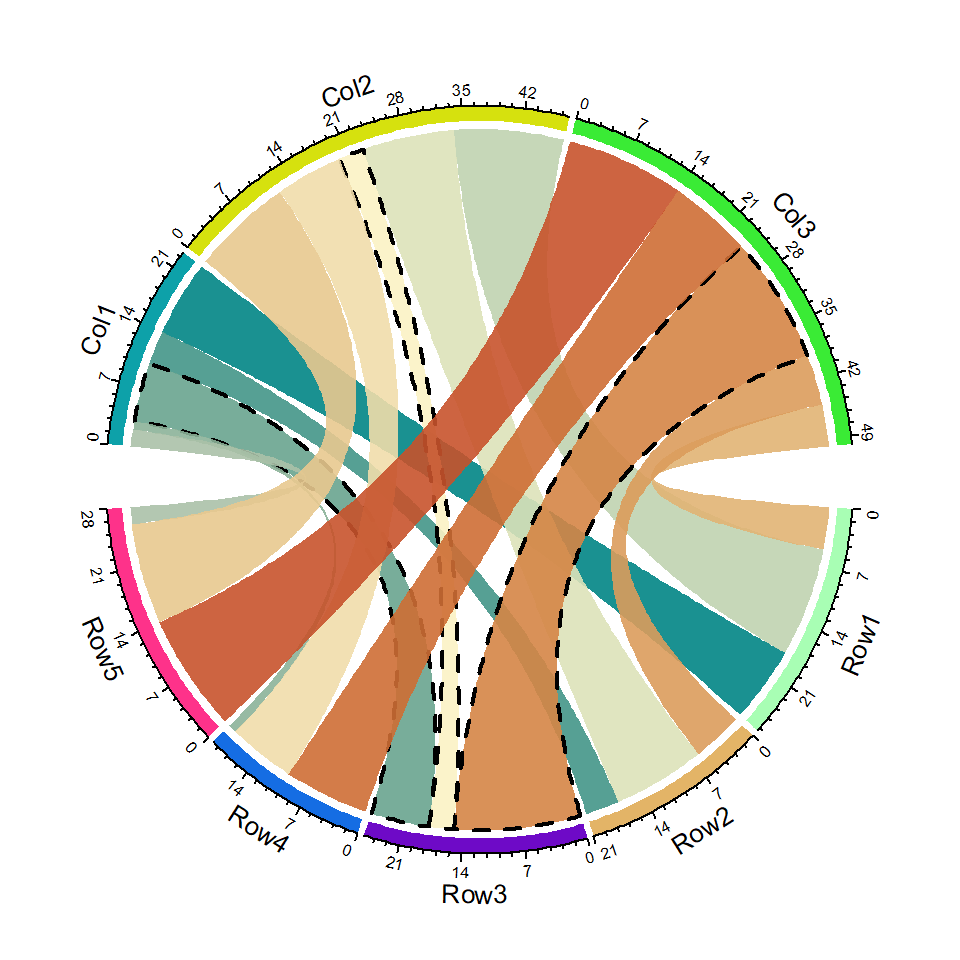
Diagram tracks
By default, the function draws a track with sector names and a track containing the grid and the axis.
Grid track
Setting annotationTrack = "grid" will add only the grid. The height of the track can be customized with annotationTrackHeight.
# install.packages("circlize")
library(circlize)

chordDiagram(m, column.col = c("red", "green", "blue"),
             annotationTrack = "grid",
             annotationTrackHeight = c(0.04, 0.02))

circos.clear()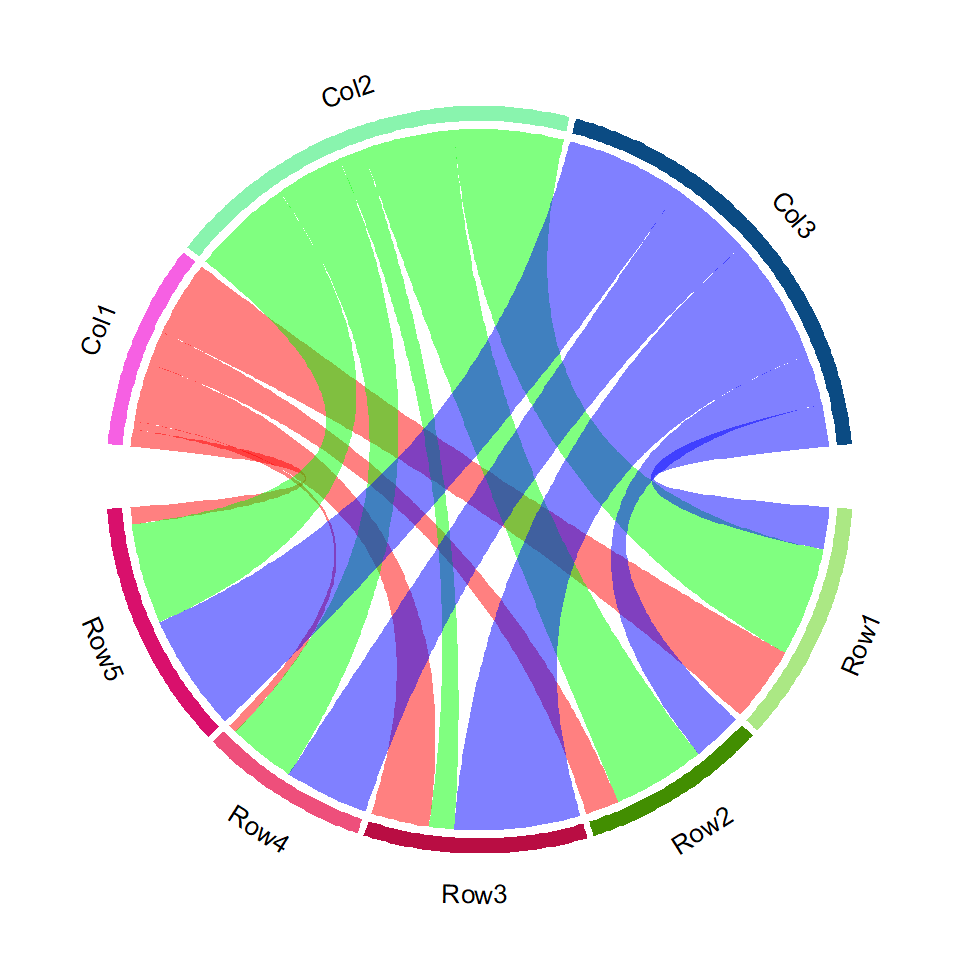
Names and grid track
You can also draw the names and the grid but not the axis.
# install.packages("circlize")
library(circlize)

chordDiagram(m, column.col = c("red", "green", "blue"),
             annotationTrack =  c("name", "grid"))

circos.clear()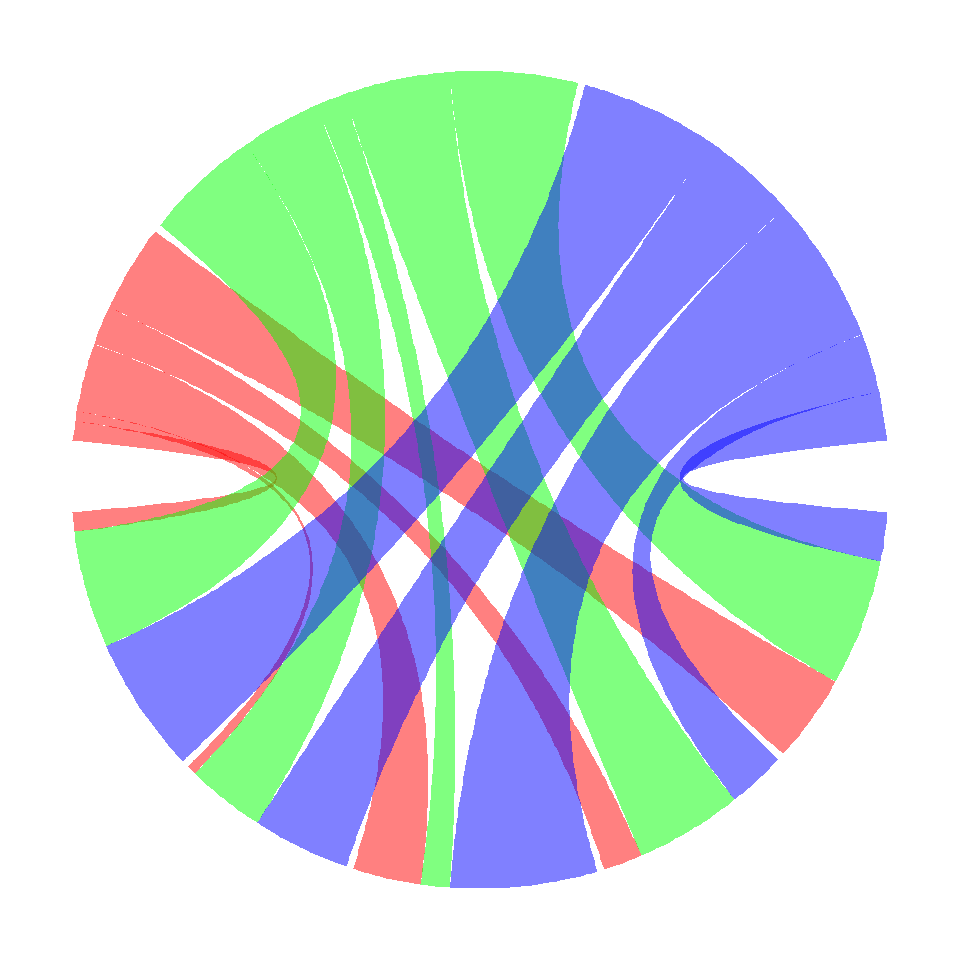
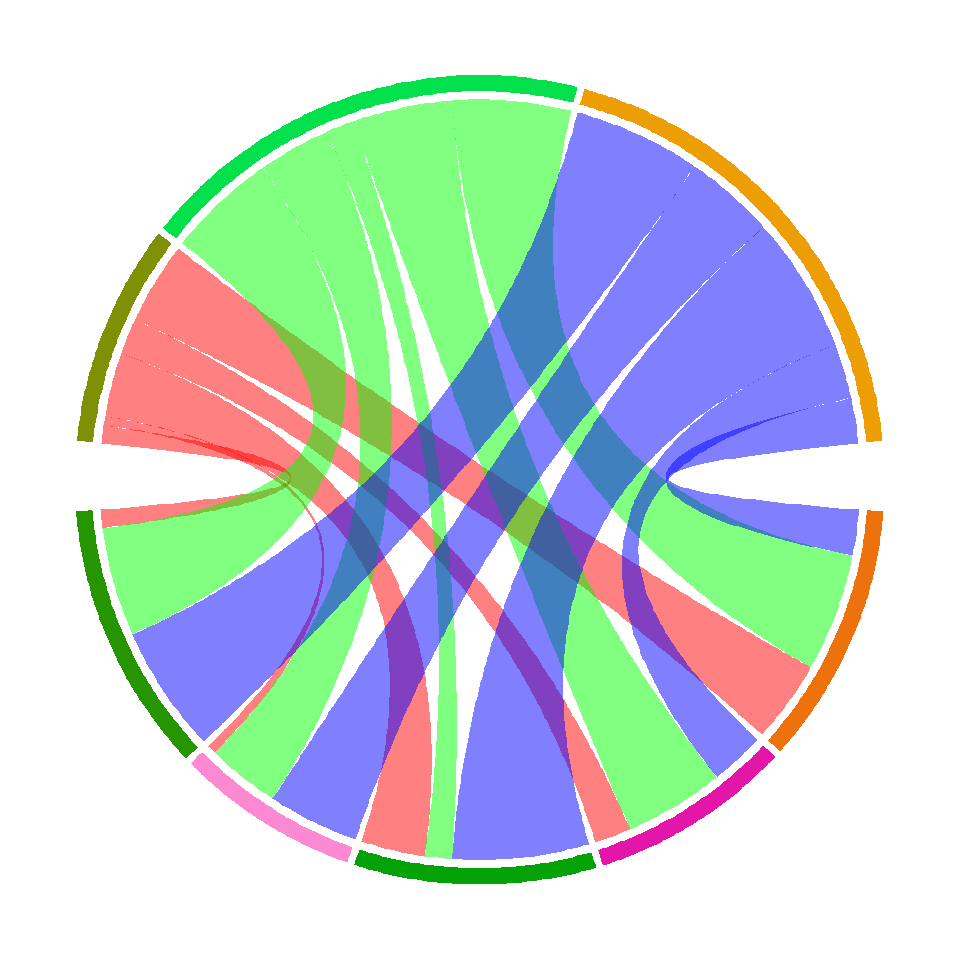
No track
Finally, if you want to remove the track set the annotationTrack argument to NULL.
# install.packages("circlize")
library(circlize)

chordDiagram(m, column.col = c("red", "green", "blue"),
             annotationTrack = NULL)

circos.clear()
Master Statistics
Learn statistics from the basics to advanced techniques, clearly explained
Go to site