Sample data set
In order to create a Sankey diagram in ggplot2 you will need to install the ggsankey library and transform your dataset using the make_long function from the package. The columns of the data must represent x (the current stage), next_x (the following stage), node (the current node) and next_node (the following node). Note that the last stage should point to an NA.
# install.packages("remotes")
# remotes::install_github("davidsjoberg/ggsankey")
library(ggsankey)

df <- mtcars %>%
  make_long(cyl, vs, am, gear, carb)
Sankey plot with ggsankey
The ggsankey package contains a geom named geom_sankey to create the Sankey diagrams in ggplot2. Note that you will need to pass the variables to aes, specifying a factor as the fill color. The function also contains a theme named theme_sankey.
# install.packages("remotes")
# remotes::install_github("davidsjoberg/ggsankey")
library(ggsankey)
# install.packages("ggplot2")
library(ggplot2)
# install.packages("dplyr")
library(dplyr) # Also needed

ggplot(df, aes(x = x,
               next_x = next_x,
               node = node,
               next_node = next_node,
               fill = factor(node))) +
  geom_sankey() +
  theme_sankey(base_size = 16)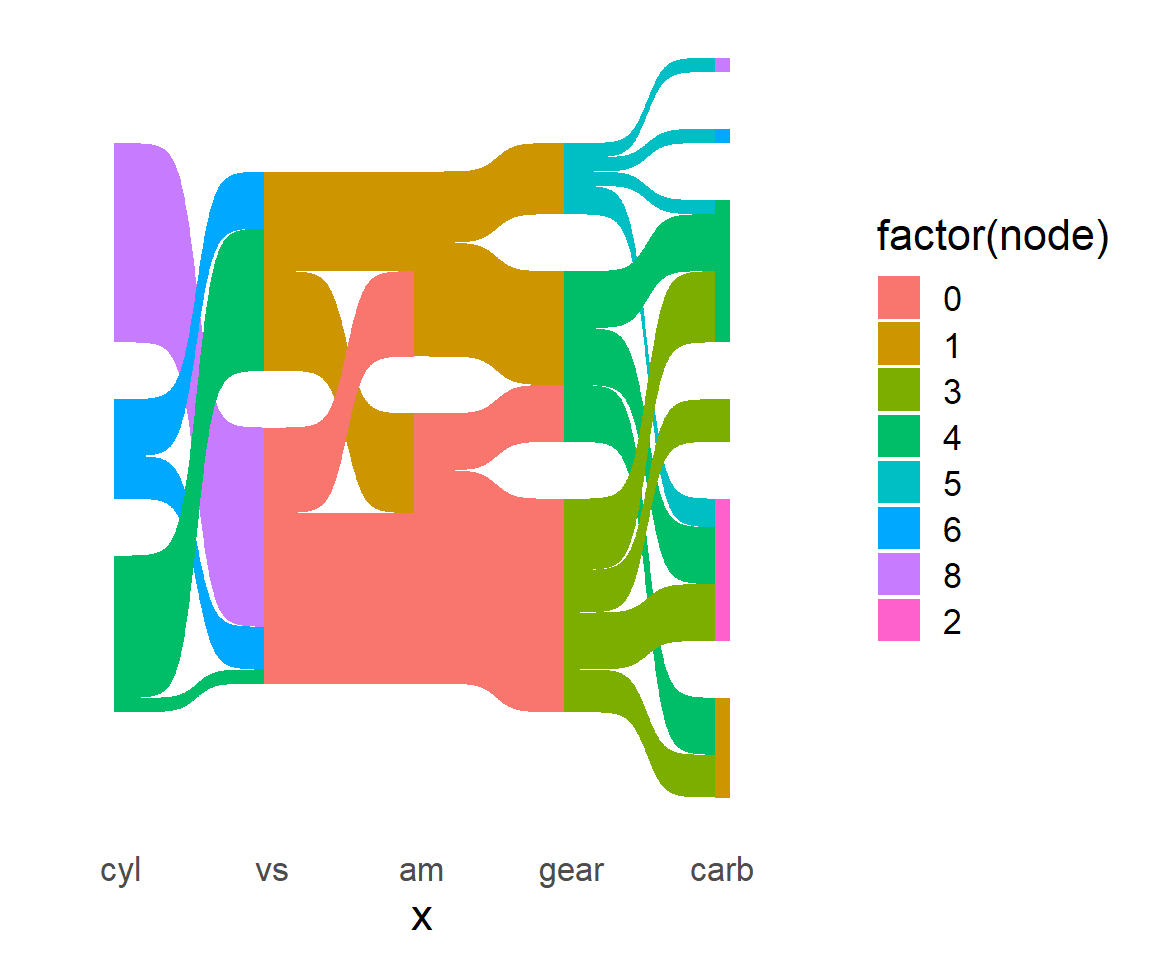
Adding labels
You can also add labels to the Sankey diagram using the geom_sankey_label function of the package. Recall to specify the label inside aes as the variable you want to show.
# install.packages("remotes")
# remotes::install_github("davidsjoberg/ggsankey")
library(ggsankey)
# install.packages("ggplot2")
library(ggplot2)
# install.packages("dplyr")
library(dplyr) # Also needed

ggplot(df, aes(x = x,
               next_x = next_x,
               node = node,
               next_node = next_node,
               fill = factor(node),
               label = node)) +
  geom_sankey() +
  geom_sankey_label() +
  theme_sankey(base_size = 16)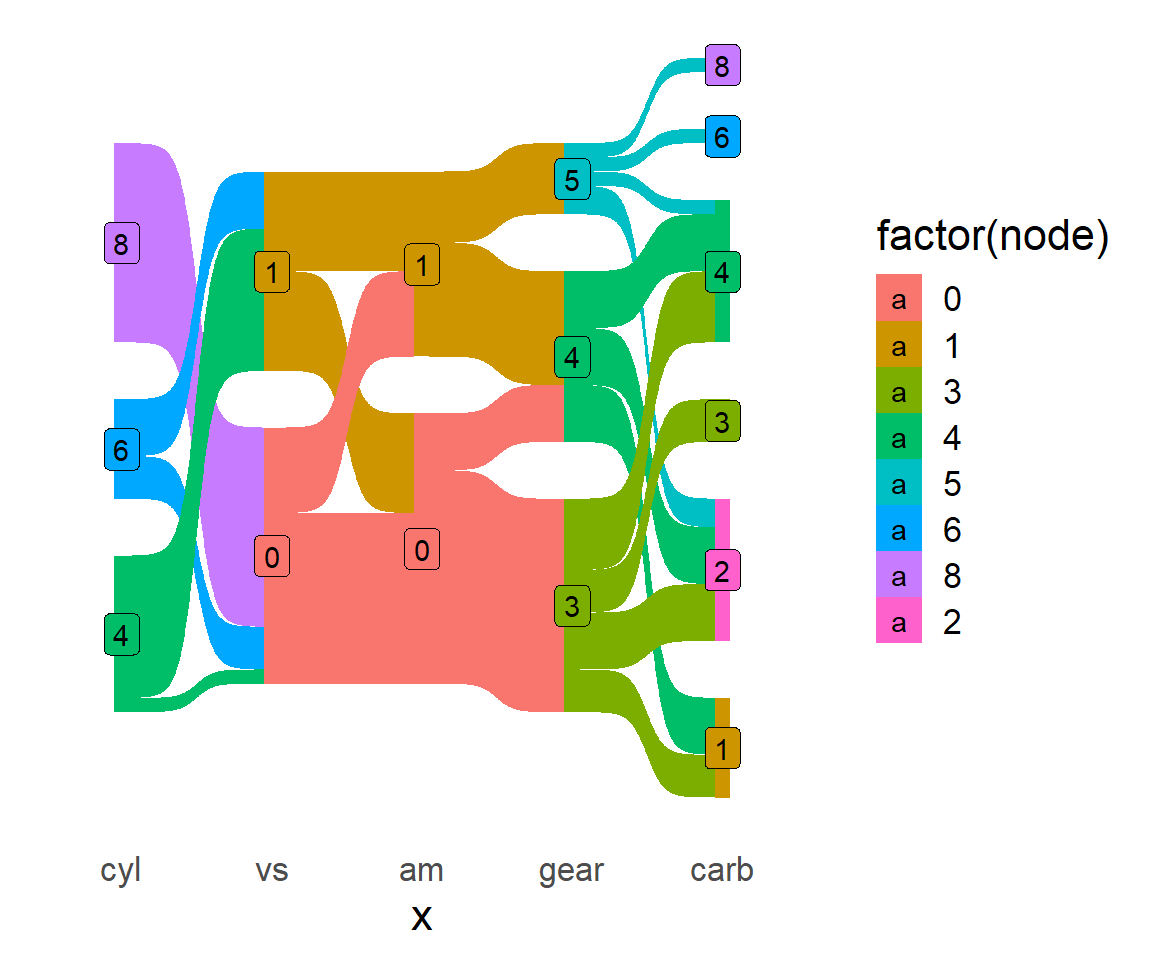
Color customization
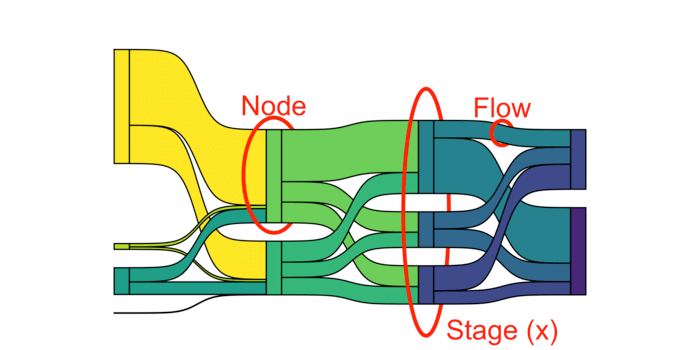
There are several arguments that can be customized to change the appearance of the Sankey diagram in R. The following images were created by the author of the package to serve as reference:
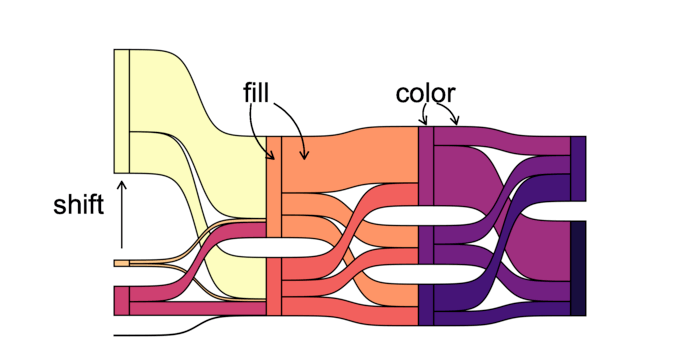
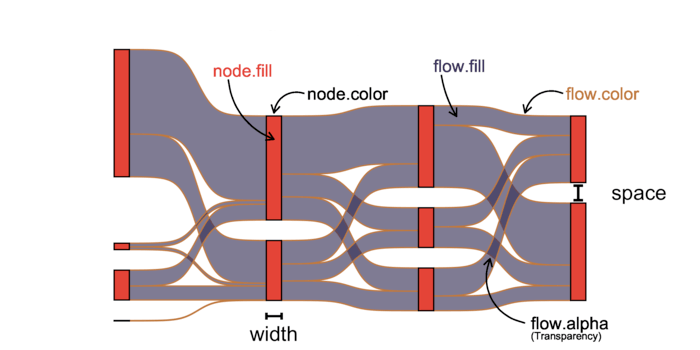
Color and fill of the Sankey plot
As an example, modifying some arguments of the geom_sankey function and changing the fill color palette we can create something like the following:
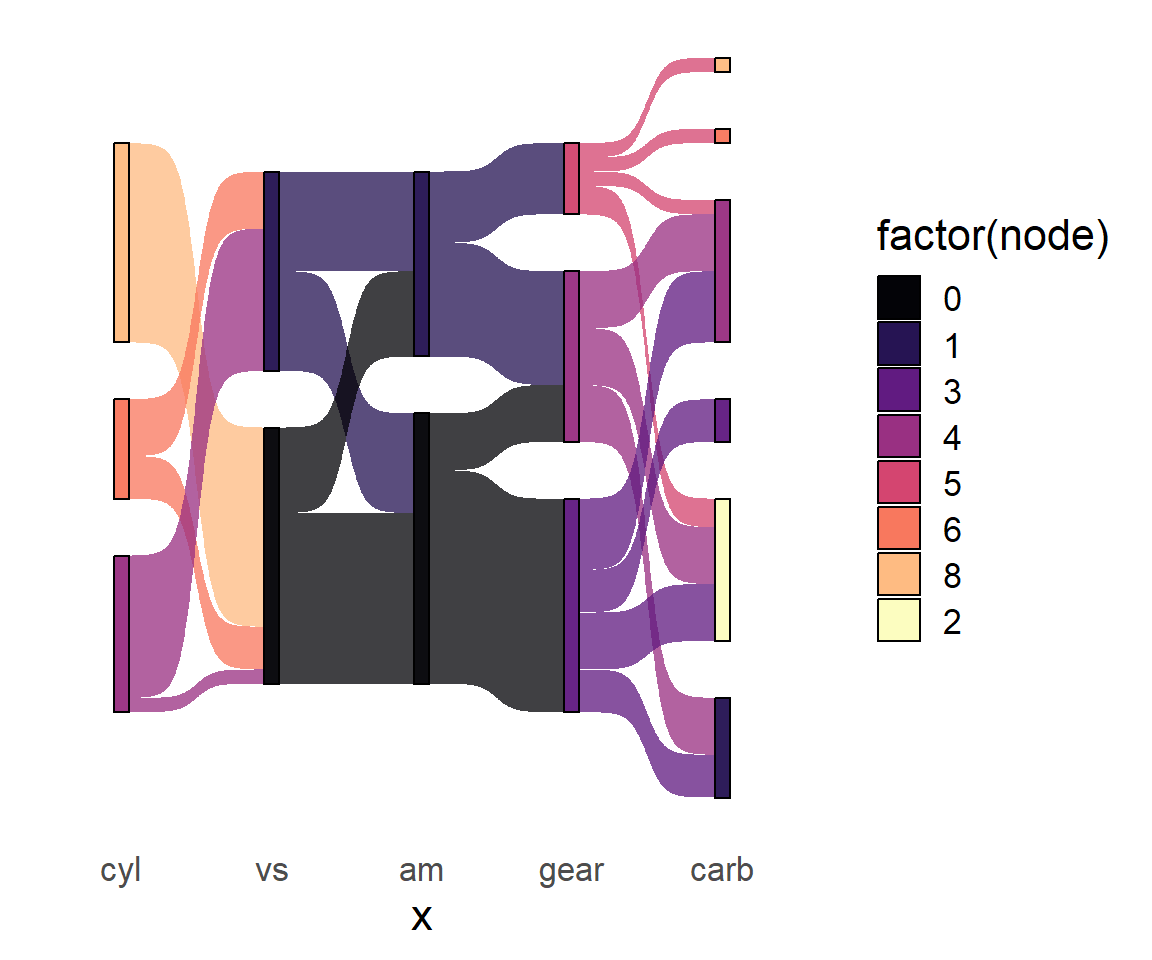
# install.packages("remotes")
# remotes::install_github("davidsjoberg/ggsankey")
library(ggsankey)
# install.packages("ggplot2")
library(ggplot2)
# install.packages("dplyr")
library(dplyr) # Also needed
ggplot(df, aes(x = x,
next_x = next_x,
node = node,
next_node = next_node,
fill = factor(node))) +
geom_sankey(flow.alpha = 0.75, node.color = 1) +
scale_fill_viridis_d(option = "A", alpha = 0.95) +
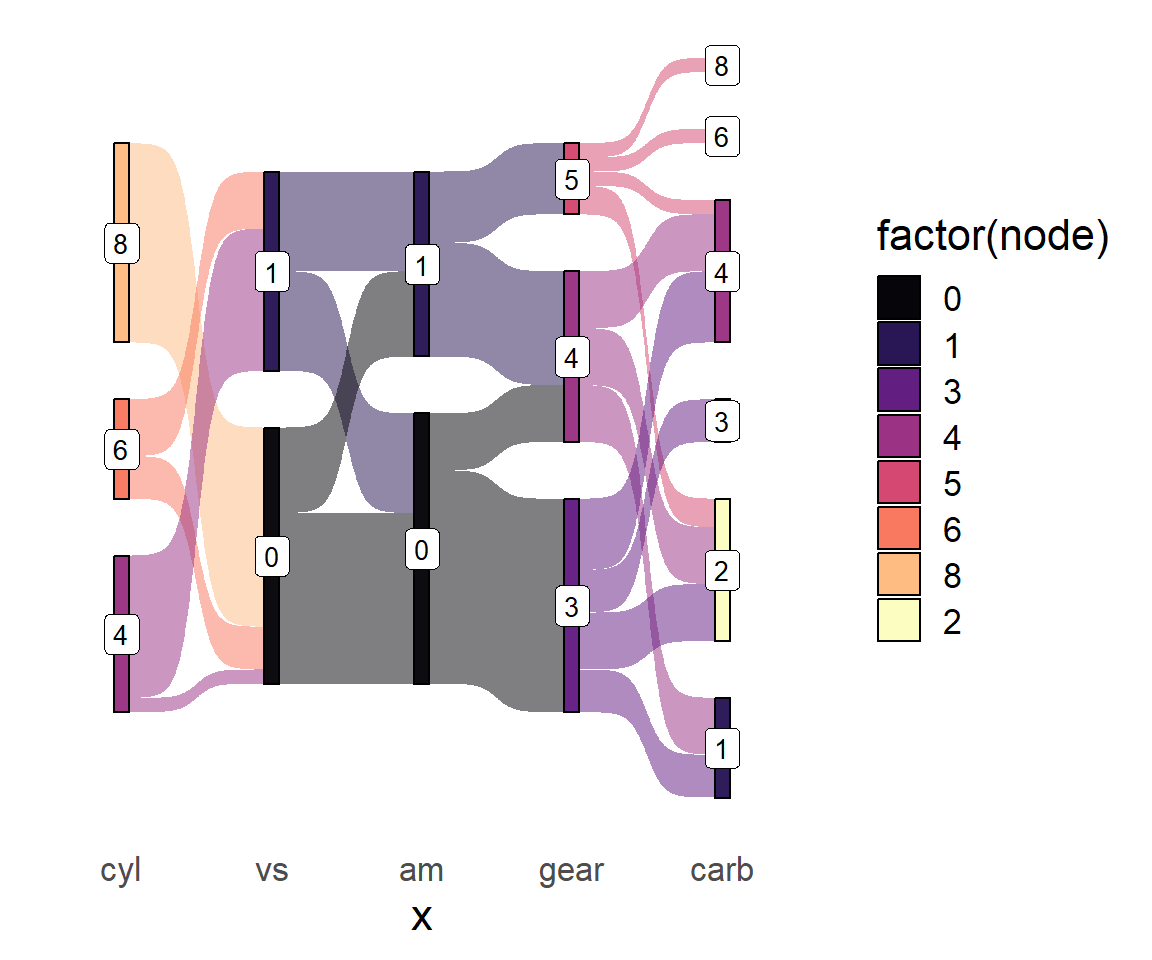
theme_sankey(base_size = 16)Changing the color of the labels
Note that the geom_sankey_label also contains several arguments to change the appearance of the labels of the plot.
# install.packages("remotes")
# remotes::install_github("davidsjoberg/ggsankey")
library(ggsankey)
# install.packages("ggplot2")
library(ggplot2)
# install.packages("dplyr")
library(dplyr) # Also needed

ggplot(df, aes(x = x,
               next_x = next_x,
               node = node,
               next_node = next_node,
               fill = factor(node),
               label = node)) +
  geom_sankey(flow.alpha = 0.5, node.color = 1) +
  geom_sankey_label(size = 3.5, color = 1, fill = "white") +
  scale_fill_viridis_d(option = "A", alpha = 0.95) +
  theme_sankey(base_size = 16)
Legend customization
Changing the title of the legend
As with other ggplot2 charts it is possible to change the title of the legend. In this case you can do the following:
# install.packages("remotes")
# remotes::install_github("davidsjoberg/ggsankey")
library(ggsankey)
# install.packages("ggplot2")
library(ggplot2)
# install.packages("dplyr")
library(dplyr) # Also needed

ggplot(df, aes(x = x,
               next_x = next_x,
               node = node,
               next_node = next_node,
               fill = factor(node),
               label = node)) +
  geom_sankey(flow.alpha = 0.5, node.color = 1) +
  geom_sankey_label(size = 3.5, color = 1, fill = "white") +
  scale_fill_viridis_d() +
  theme_sankey(base_size = 16) +
  guides(fill = guide_legend(title = "Title"))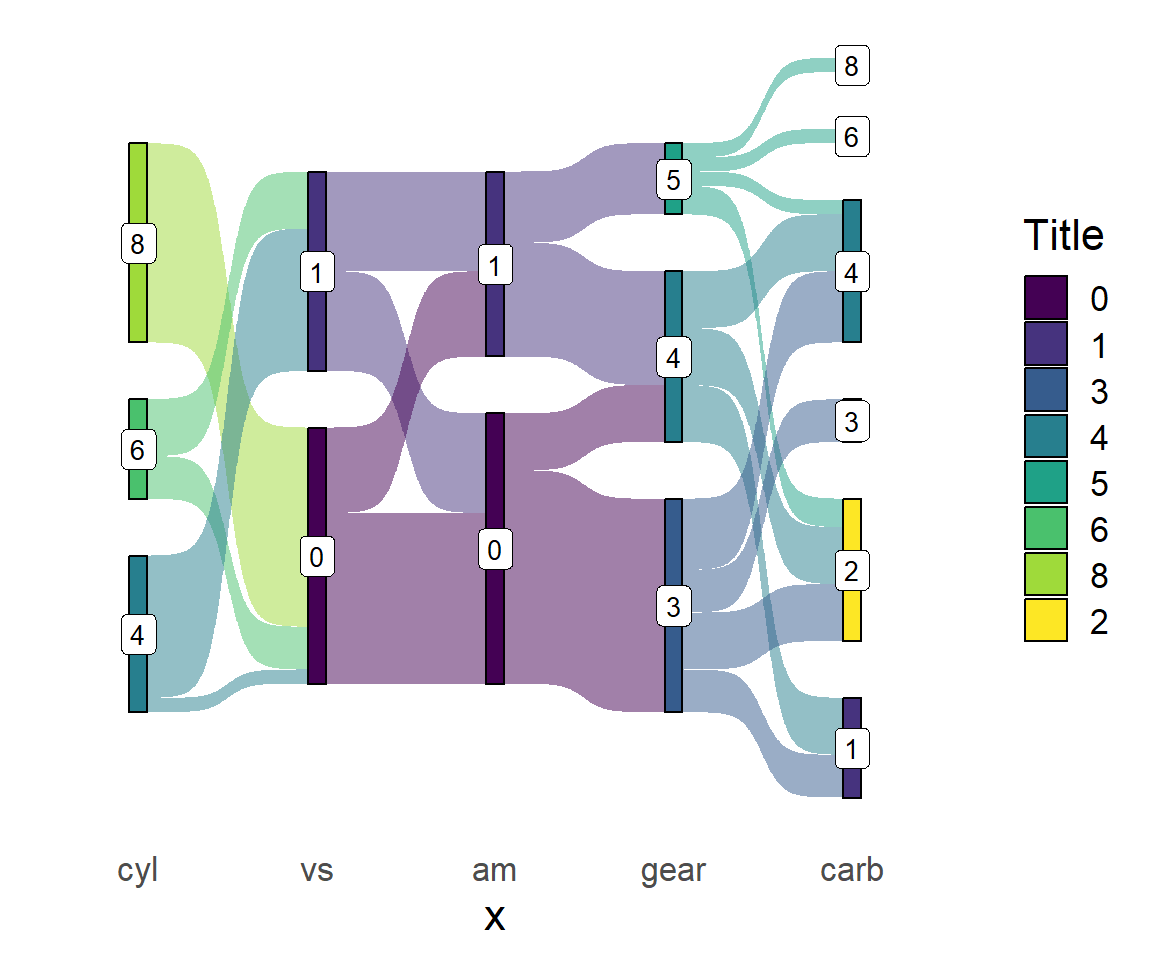
Removing the legend
Finally, if you want to get rid of the legend of the Sankey plot you can set its position to "none".
# install.packages("remotes")
# remotes::install_github("davidsjoberg/ggsankey")
library(ggsankey)
# install.packages("ggplot2")
library(ggplot2)
# install.packages("dplyr")
library(dplyr) # Also needed

ggplot(df, aes(x = x,
               next_x = next_x,
               node = node,
               next_node = next_node,
               fill = factor(node),
               label = node)) +
  geom_sankey(flow.alpha = 0.5, node.color = 1) +
  geom_sankey_label(size = 3.5, color = 1, fill = "white") +
  scale_fill_viridis_d() +
  theme_sankey(base_size = 16) +
  theme(legend.position = "none")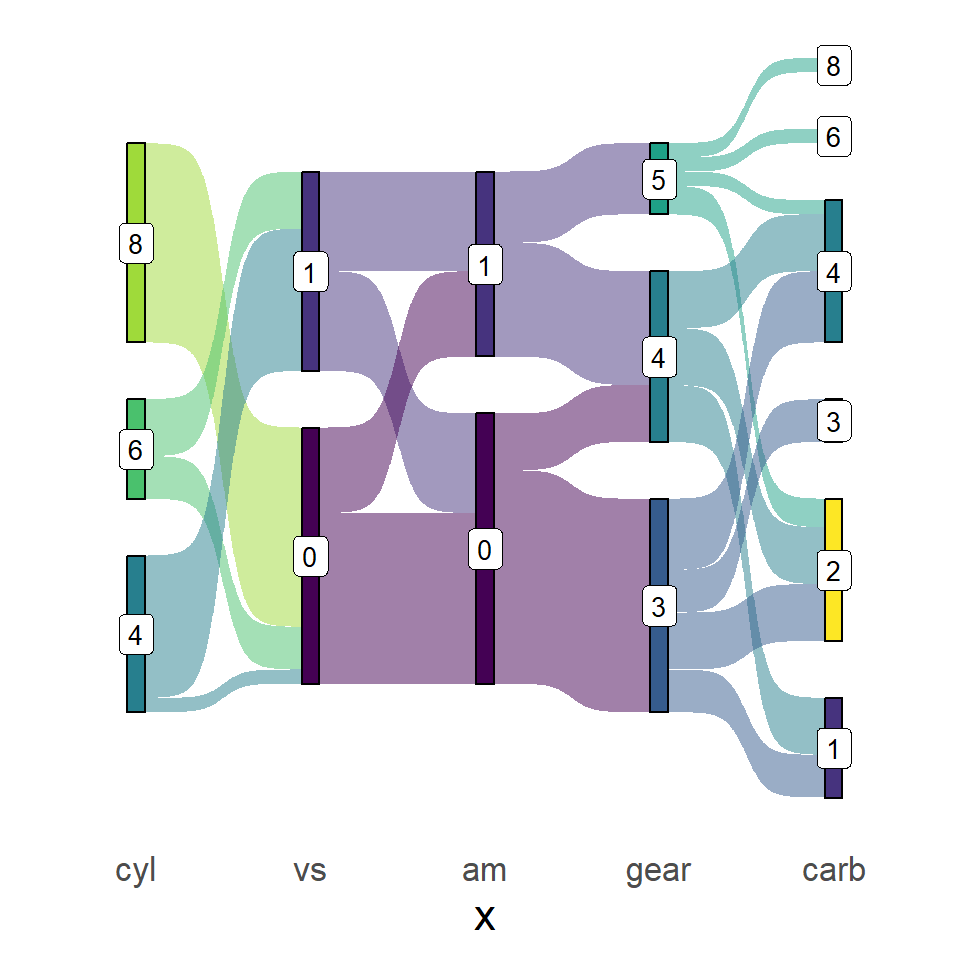

Master Statistics
Learn statistics from the basics to advanced techniques, clearly explained
Go to site