Sample data set
The vaccinations data set from the ggalluvial package contains a survey “that asked respondents their probability of vaccinating for influenza”. The response variable is the discretized probability of vaccinating, freq the number of respondents and survey the survey designation.
# install.packages("ggalluvial")
library(ggalluvial)

vaccinations
Alluvial plot
The ggalluvial package provides the geom_alluvium and geom_stratum functions to create alluvial diagrams in ggplot2. You will need to pass your data in long format, specify the axis variables inside aes and use the previous functions.
Note that you can also add the text for each stratum, add the names of the axis variables (in the following examples you won’t see them because we set theme_void) and change the ggplot2 theme, among other customizations.
# install.packages("ggalluvial")
library(ggalluvial)

ggplot(data = vaccinations,
       aes(axis1 = survey, axis2 = response, y = freq)) +
  geom_alluvium(aes(fill = response)) +
  geom_stratum() +
  geom_text(stat = "stratum",
            aes(label = after_stat(stratum))) +
  scale_x_discrete(limits = c("Survey", "Response"),
                   expand = c(0.15, 0.05)) +
  theme_void()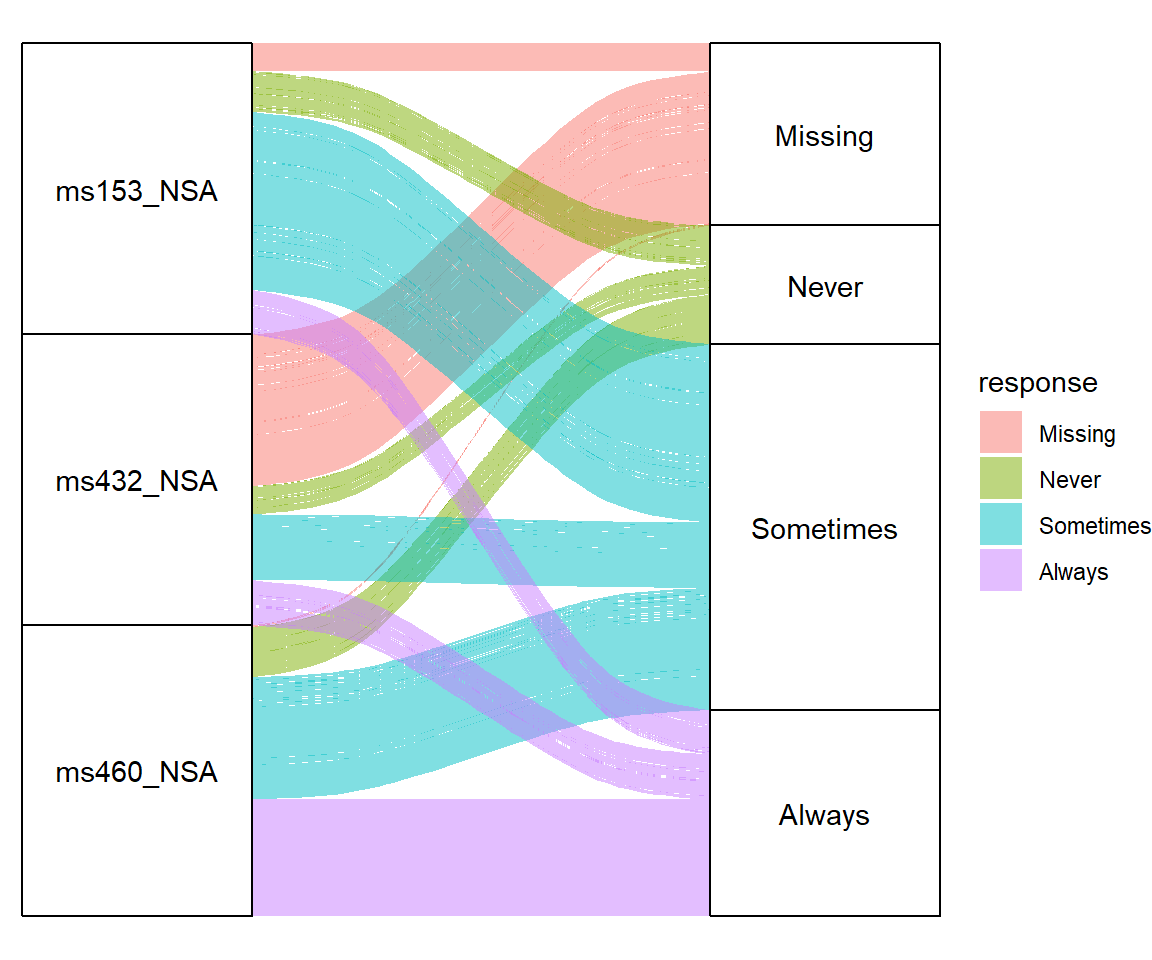
If your data set contains more categorical variables you can pass them to aes (axis1, axis2, axis3 …) as shown in the example below.
# install.packages("ggalluvial")
library(ggalluvial)

ggplot(data = vaccinations,
       aes(axis1 = survey,   # First variable on the X-axis
           axis2 = response, # Second variable on the X-axis
           axis3 = survey,   # Third variable on the X-axis
           y = freq)) +
  geom_alluvium(aes(fill = response)) +
  geom_stratum() +
  geom_text(stat = "stratum",
            aes(label = after_stat(stratum))) +
  scale_x_discrete(limits = c("Survey", "Response"),
                   expand = c(0.15, 0.05)) +
  theme_void()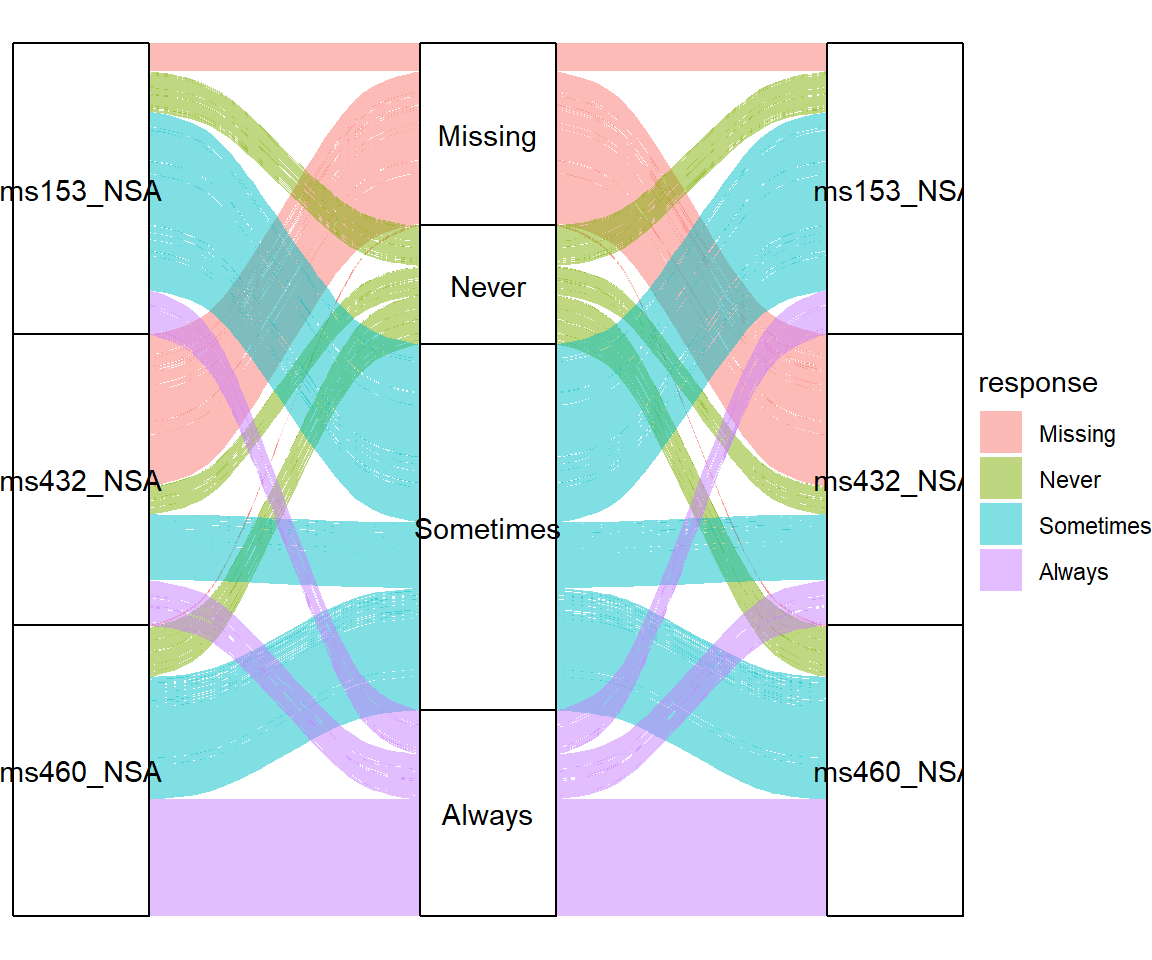
Curve types
The type of flows of the plot area can be customized with the curve_type argument of the geom_alluvium function. The default value is "xspline", which produces approximation splines using four points per curve. The alternatives are listed below:
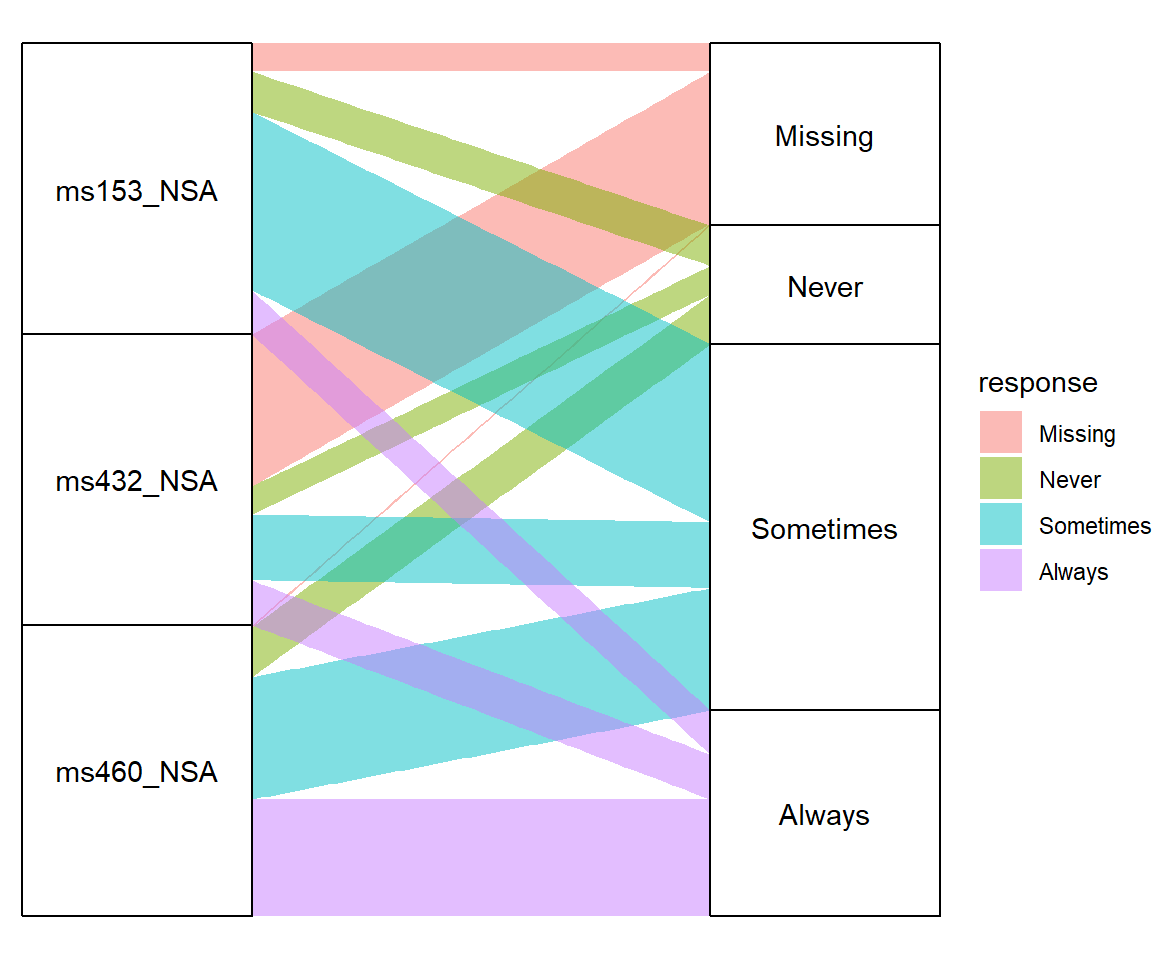
Linear
# install.packages("ggalluvial")
library(ggalluvial)

ggplot(data = vaccinations,
       aes(axis1 = survey, axis2 = response, y = freq)) +
  geom_alluvium(aes(fill = response),
                curve_type = "linear") +
  geom_stratum() +
  geom_text(stat = "stratum",
            aes(label = after_stat(stratum))) +
  scale_x_discrete(limits = c("Survey", "Response"),
                   expand = c(0.15, 0.05)) +
  theme_void()
Cubic
# install.packages("ggalluvial")
library(ggalluvial)

ggplot(data = vaccinations,
       aes(axis1 = survey, axis2 = response, y = freq)) +
  geom_alluvium(aes(fill = response),
                curve_type = "cubic") +
  geom_stratum() +
  geom_text(stat = "stratum",
            aes(label = after_stat(stratum))) +
  scale_x_discrete(limits = c("Survey", "Response"),
                   expand = c(0.15, 0.05)) +
  theme_void()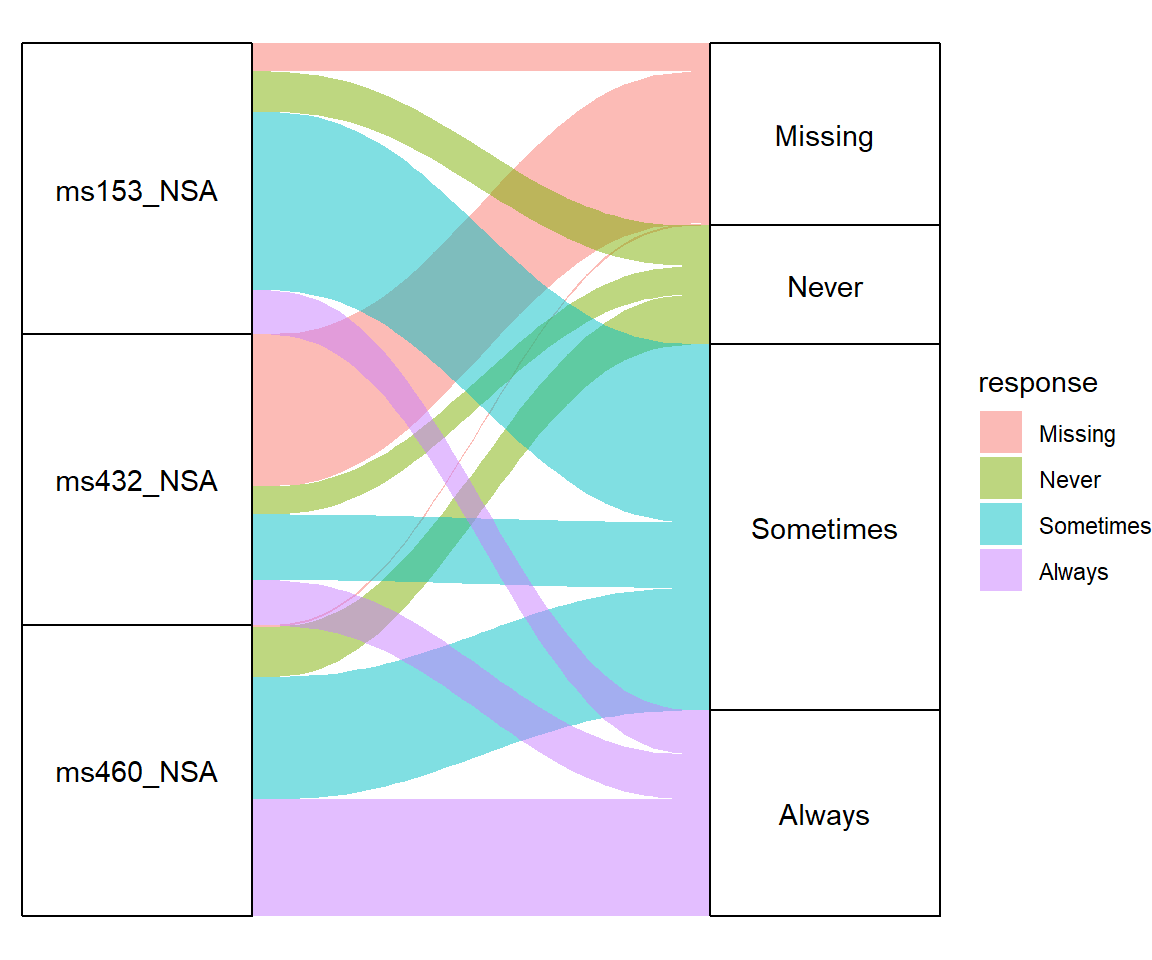
Quintic
# install.packages("ggalluvial")
library(ggalluvial)

ggplot(data = vaccinations,
       aes(axis1 = survey, axis2 = response, y = freq)) +
  geom_alluvium(aes(fill = response),
                curve_type = "quintic") +
  geom_stratum() +
  geom_text(stat = "stratum",
            aes(label = after_stat(stratum))) +
  scale_x_discrete(limits = c("Survey", "Response"),
                   expand = c(0.15, 0.05)) +
  theme_void()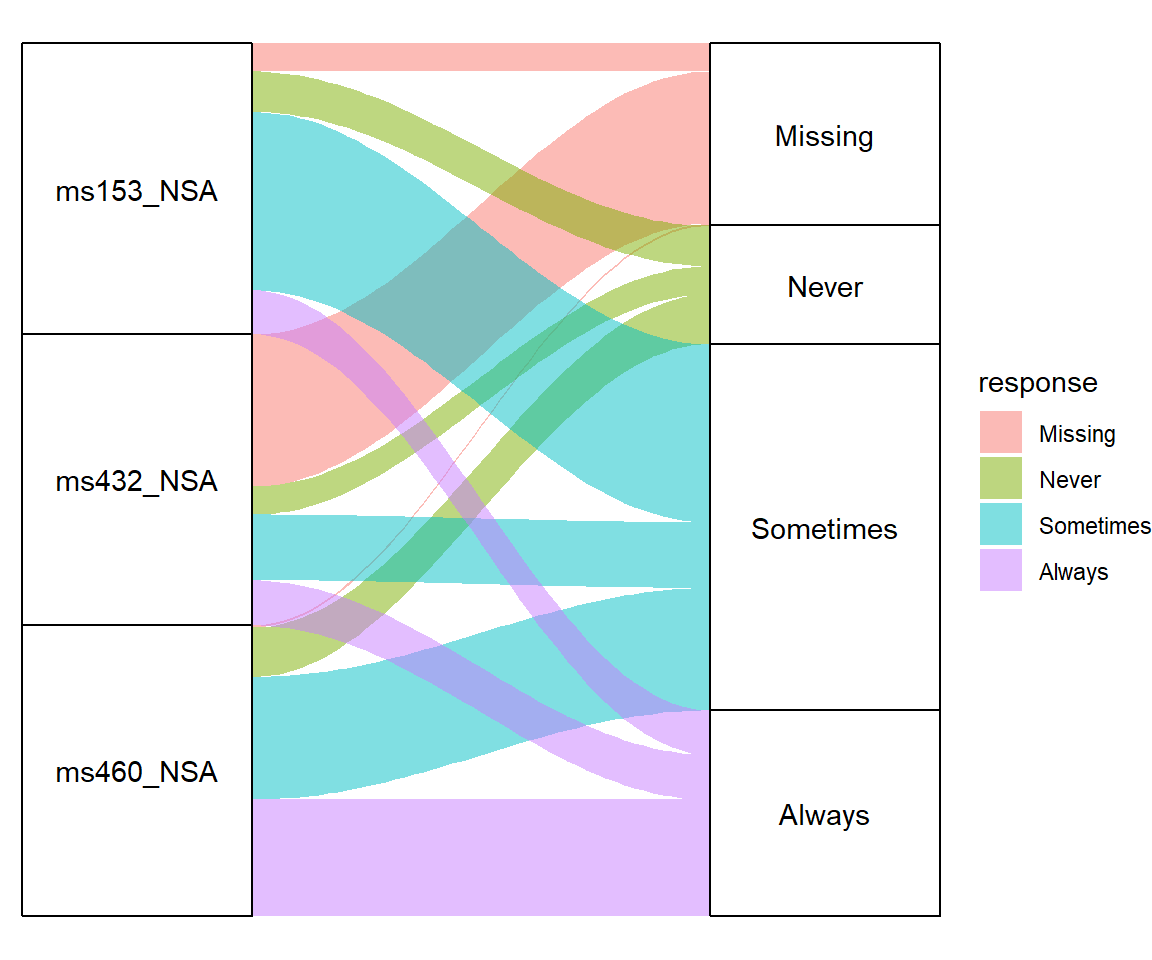
Sine
# install.packages("ggalluvial")
library(ggalluvial)

ggplot(data = vaccinations,
       aes(axis1 = survey, axis2 = response, y = freq)) +
  geom_alluvium(aes(fill = response),
                curve_type = "sine") +
  geom_stratum() +
  geom_text(stat = "stratum",
            aes(label = after_stat(stratum))) +
  scale_x_discrete(limits = c("Survey", "Response"),
                   expand = c(0.15, 0.05)) +
  theme_void()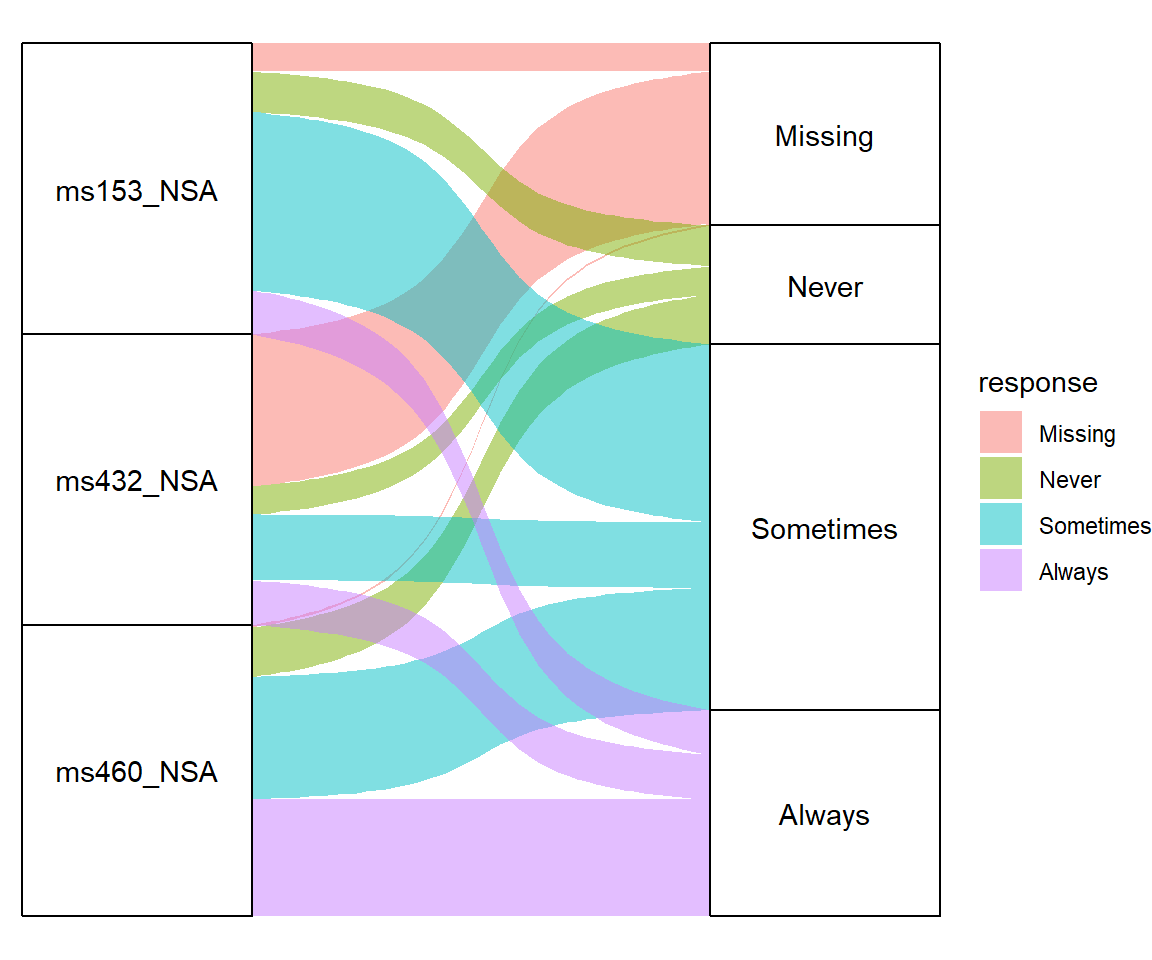
Arctangent
# install.packages("ggalluvial")
library(ggalluvial)

ggplot(data = vaccinations,
       aes(axis1 = survey, axis2 = response, y = freq)) +
  geom_alluvium(aes(fill = response),
                curve_type = "arctangent") +
  geom_stratum() +
  geom_text(stat = "stratum",
            aes(label = after_stat(stratum))) +
  scale_x_discrete(limits = c("Survey", "Response"),
                   expand = c(0.15, 0.05)) +
  theme_void()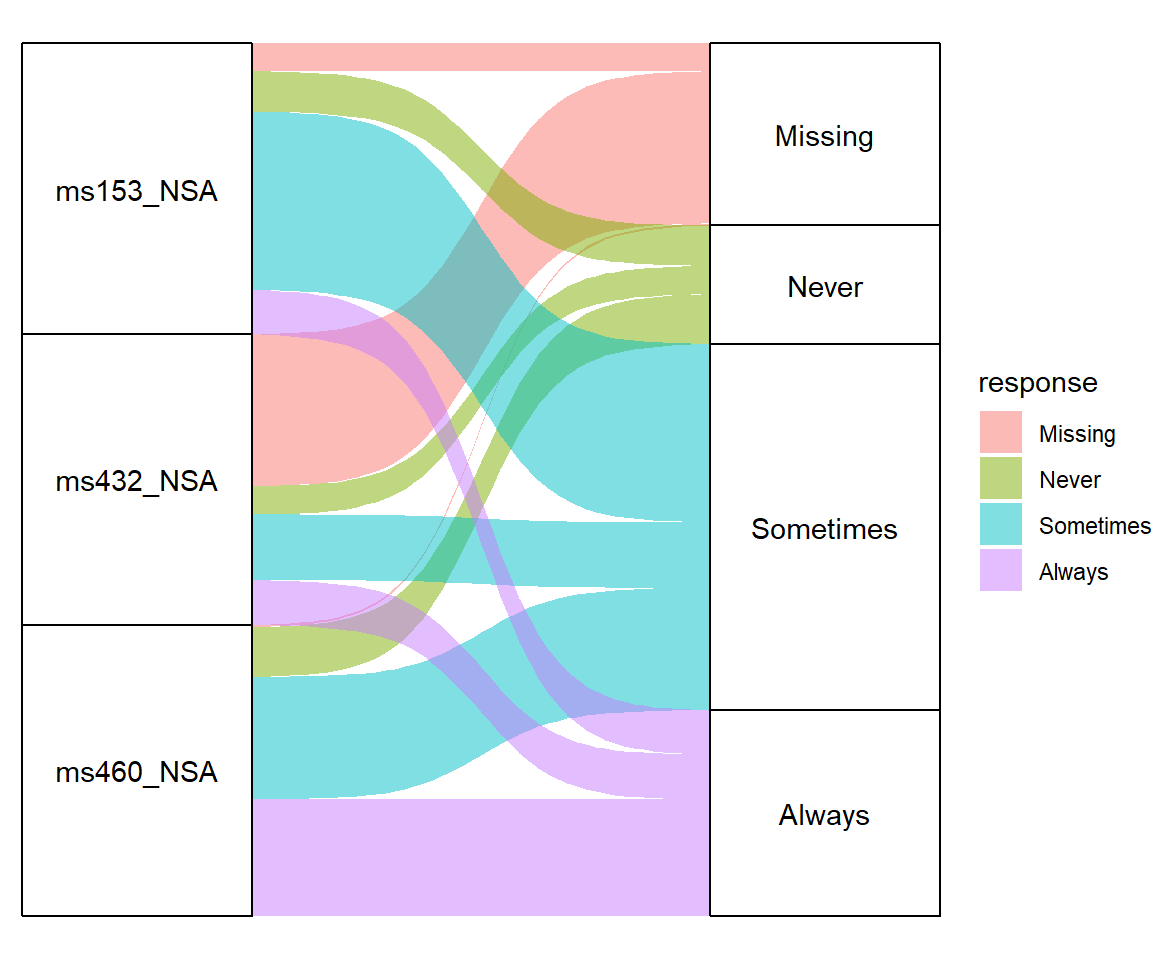
Sigmoid
# install.packages("ggalluvial")
library(ggalluvial)

ggplot(data = vaccinations,
       aes(axis1 = survey, axis2 = response, y = freq)) +
  geom_alluvium(aes(fill = response),
                curve_type = "sigmoid") +
  geom_stratum() +
  geom_text(stat = "stratum",
            aes(label = after_stat(stratum))) +
  scale_x_discrete(limits = c("Survey", "Response"),
                   expand = c(0.15, 0.05)) +
  theme_void()
Note that there is an additional argument named curve_range for alternative curve types based on asymptotic functions. Type geom_alluvium for additional details.
Color customization
It is possible to customize the colors of the flows. You can set a single color for them, use a predefined color palette or use your own vector of colors. Note that you can also modify the colors of the stratum boxes.
Fill color
# install.packages("ggalluvial")
library(ggalluvial)

ggplot(data = vaccinations,
       aes(axis1 = survey, axis2 = response, y = freq)) +
  geom_alluvium(aes(fill = "red")) +
  geom_stratum() +
  geom_text(stat = "stratum",
            aes(label = after_stat(stratum))) +
  scale_x_discrete(limits = c("Survey", "Response"),
                   expand = c(0.15, 0.05)) +
  scale_fill_viridis_d()
  theme_void()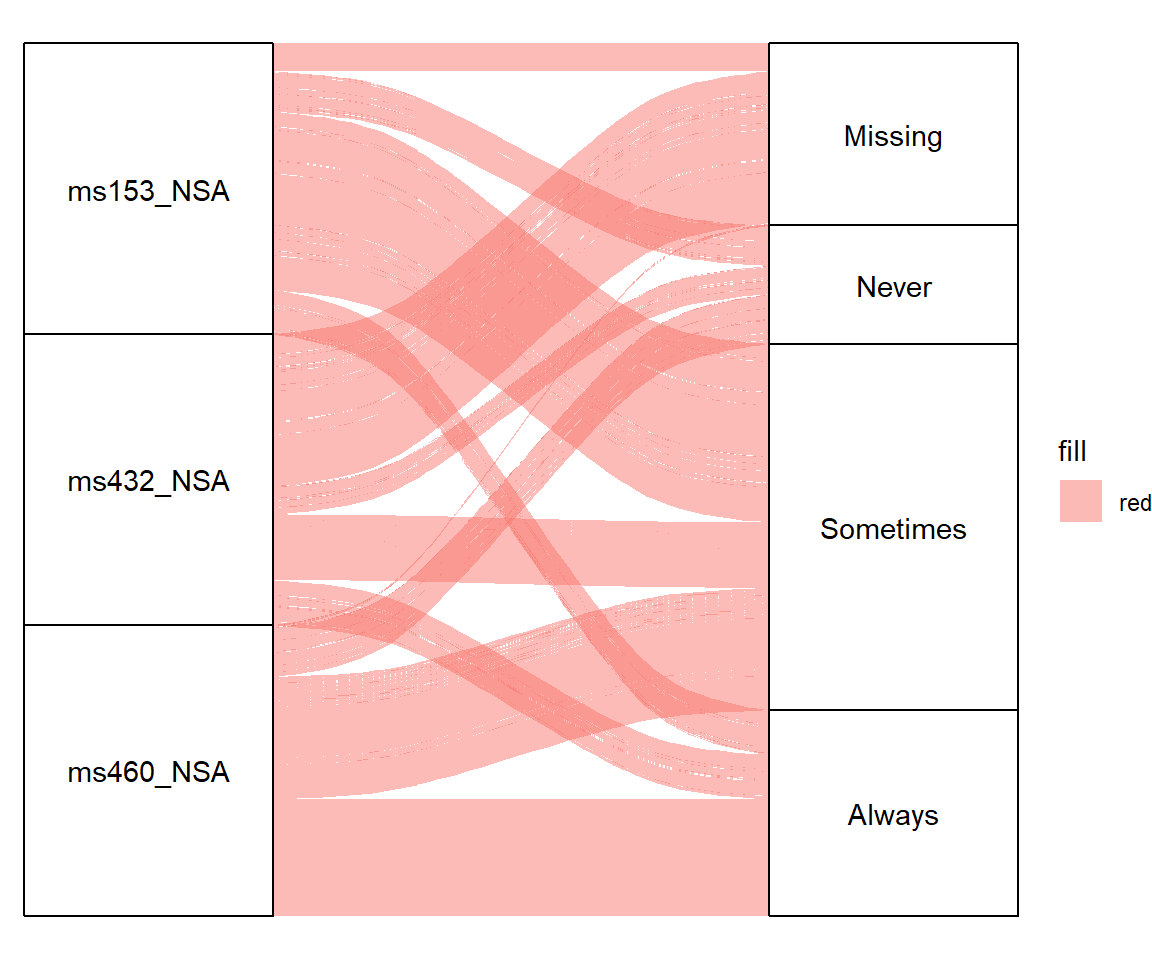
Color palette
# install.packages("ggalluvial")
library(ggalluvial)

ggplot(data = vaccinations,
       aes(axis1 = survey, axis2 = response, y = freq)) +
  geom_alluvium(aes(fill = response)) +
  geom_stratum() +
  geom_text(stat = "stratum",
            aes(label = after_stat(stratum))) +
  scale_x_discrete(limits = c("Survey", "Response"),
                   expand = c(0.15, 0.05)) +
  scale_fill_viridis_d() +
  theme_void()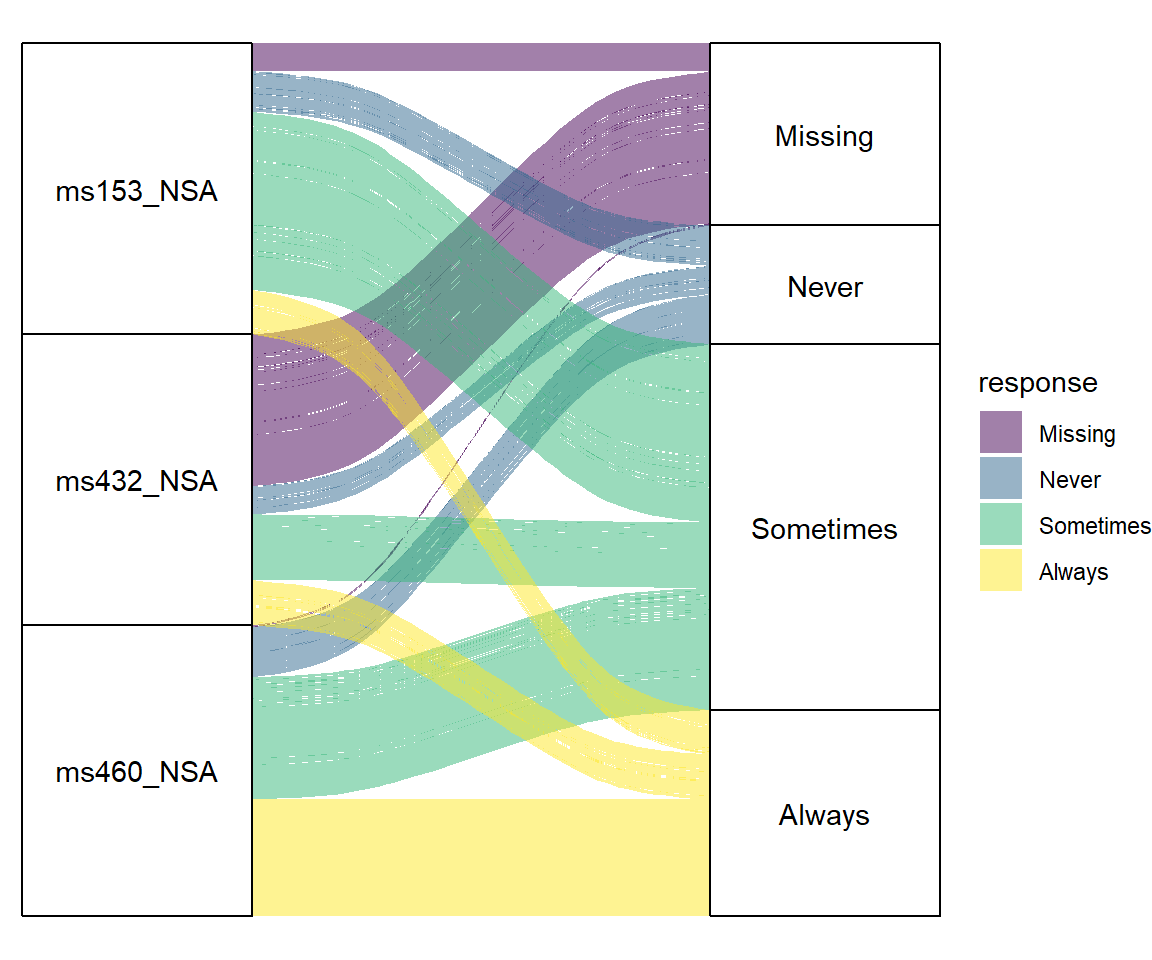
Custom colors
# install.packages("ggalluvial")
library(ggalluvial)

# Colors
colors <- hcl.colors(4, "Red-Blue")

ggplot(data = vaccinations,
       aes(axis1 = survey, axis2 = response, y = freq)) +
  geom_alluvium(aes(fill = response)) +
  geom_stratum() +
  geom_text(stat = "stratum",
            aes(label = after_stat(stratum))) +
  scale_x_discrete(limits = c("Survey", "Response"),
                   expand = c(0.15, 0.05)) +
  scale_fill_manual(values = colors) +
  theme_void()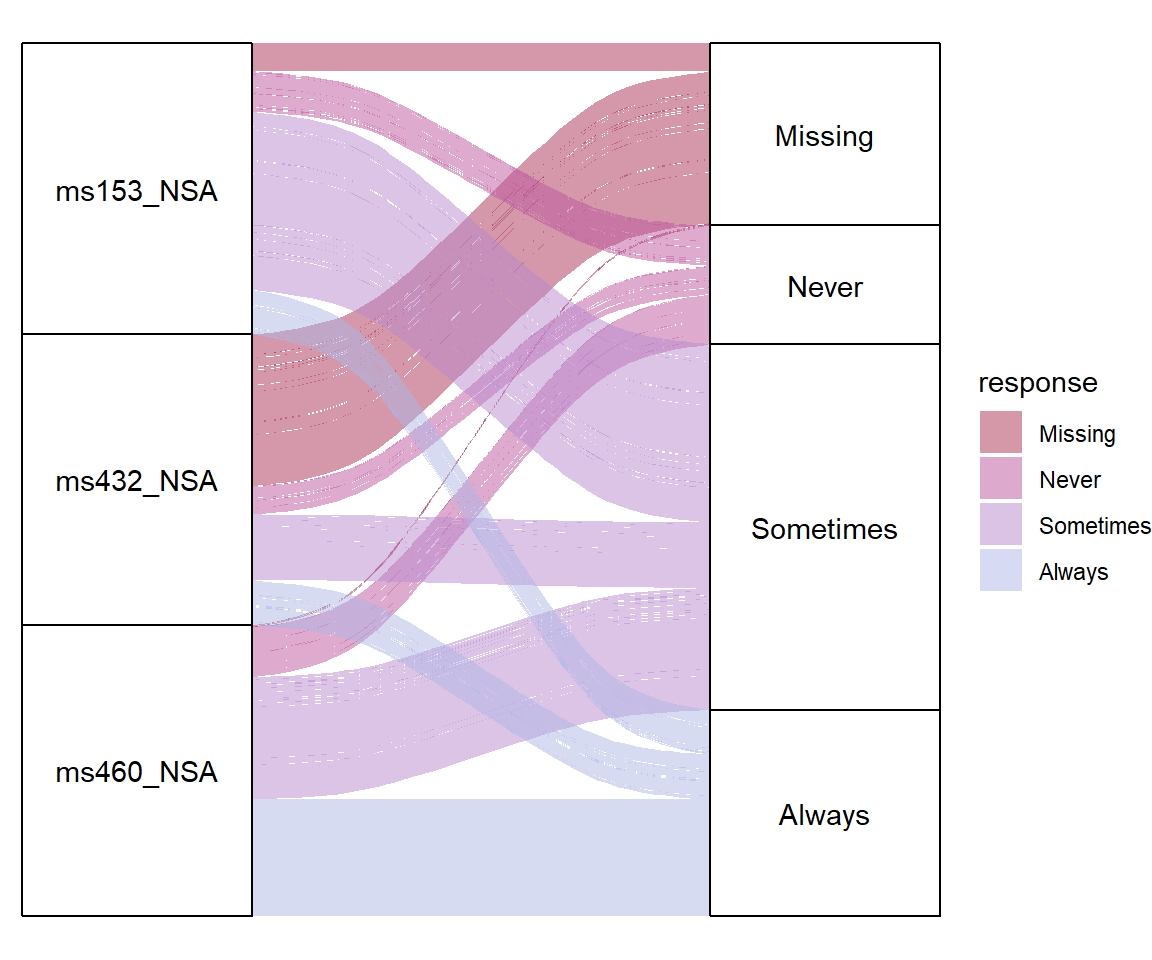
Stratum color
# install.packages("ggalluvial")
library(ggalluvial)

ggplot(data = vaccinations,
       aes(axis1 = survey, axis2 = response, y = freq)) +
  geom_alluvium(aes(fill = response)) +
  geom_stratum(aes(fill = response)) +
  geom_text(stat = "stratum",
            aes(label = after_stat(stratum))) +
  scale_x_discrete(limits = c("Survey", "Response"),
                   expand = c(0.15, 0.05)) +
  theme_void()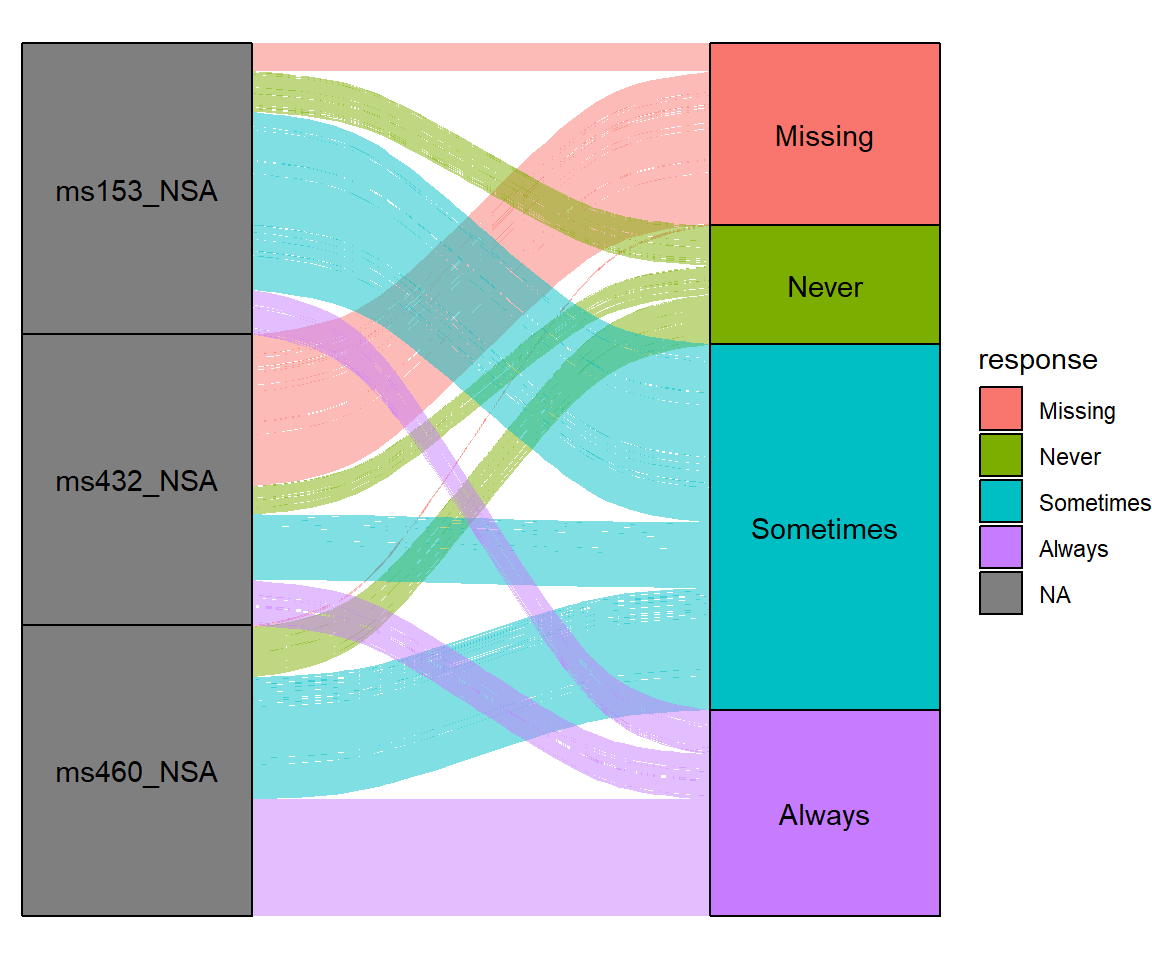
Legend customization
As the ggalluvial package was built with ggplot2 it is possible to customize the legend of the plots, such as changing its title, the key labels, its position or remove it as shown in the following examples
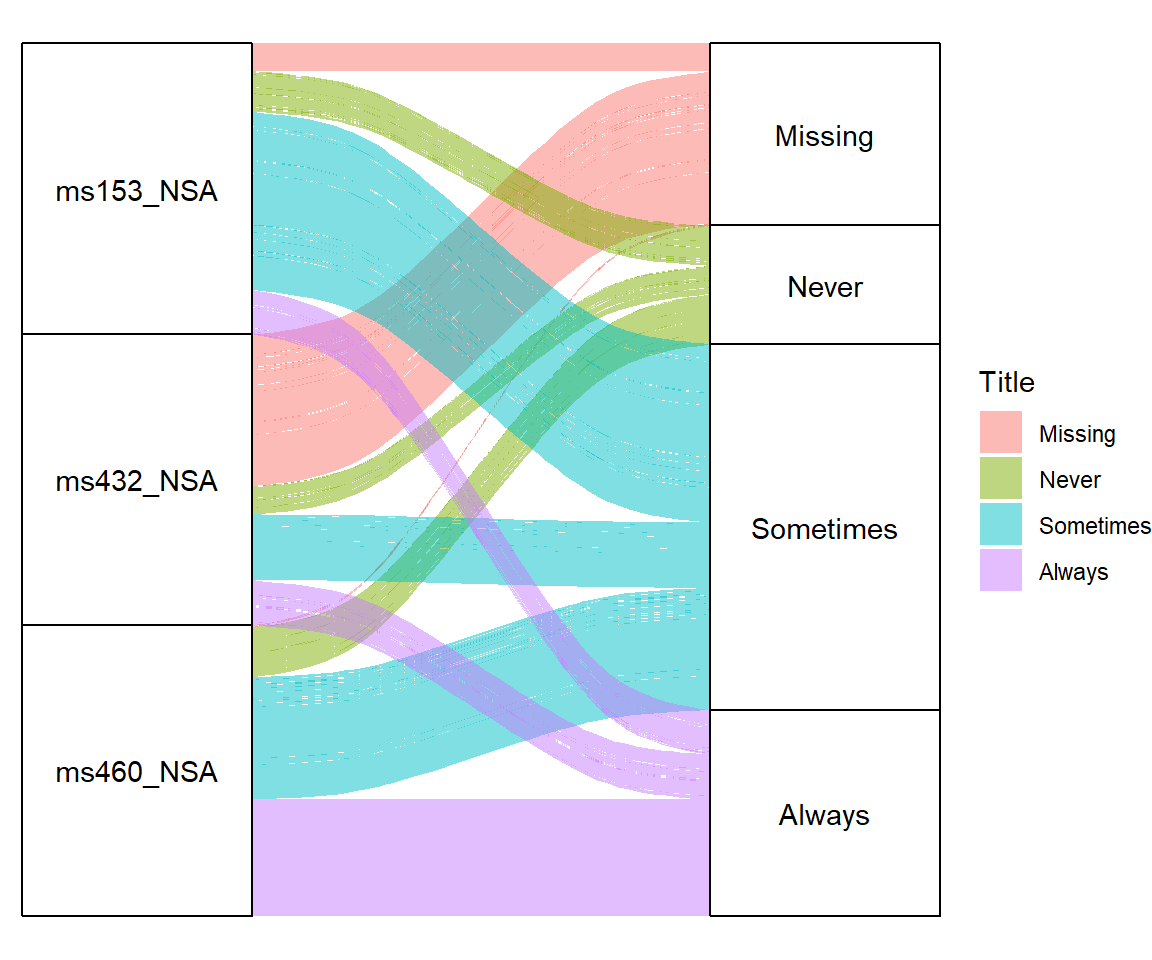
Legend title
# install.packages("ggalluvial")
library(ggalluvial)

ggplot(data = vaccinations,
       aes(axis1 = survey, axis2 = response, y = freq)) +
  geom_alluvium(aes(fill = response)) +
  geom_stratum() +
  geom_text(stat = "stratum",
            aes(label = after_stat(stratum))) +
  scale_x_discrete(limits = c("Survey", "Response"),
                   expand = c(0.15, 0.05)) +
  theme_void() +
  guides(fill = guide_legend(title = "Title"))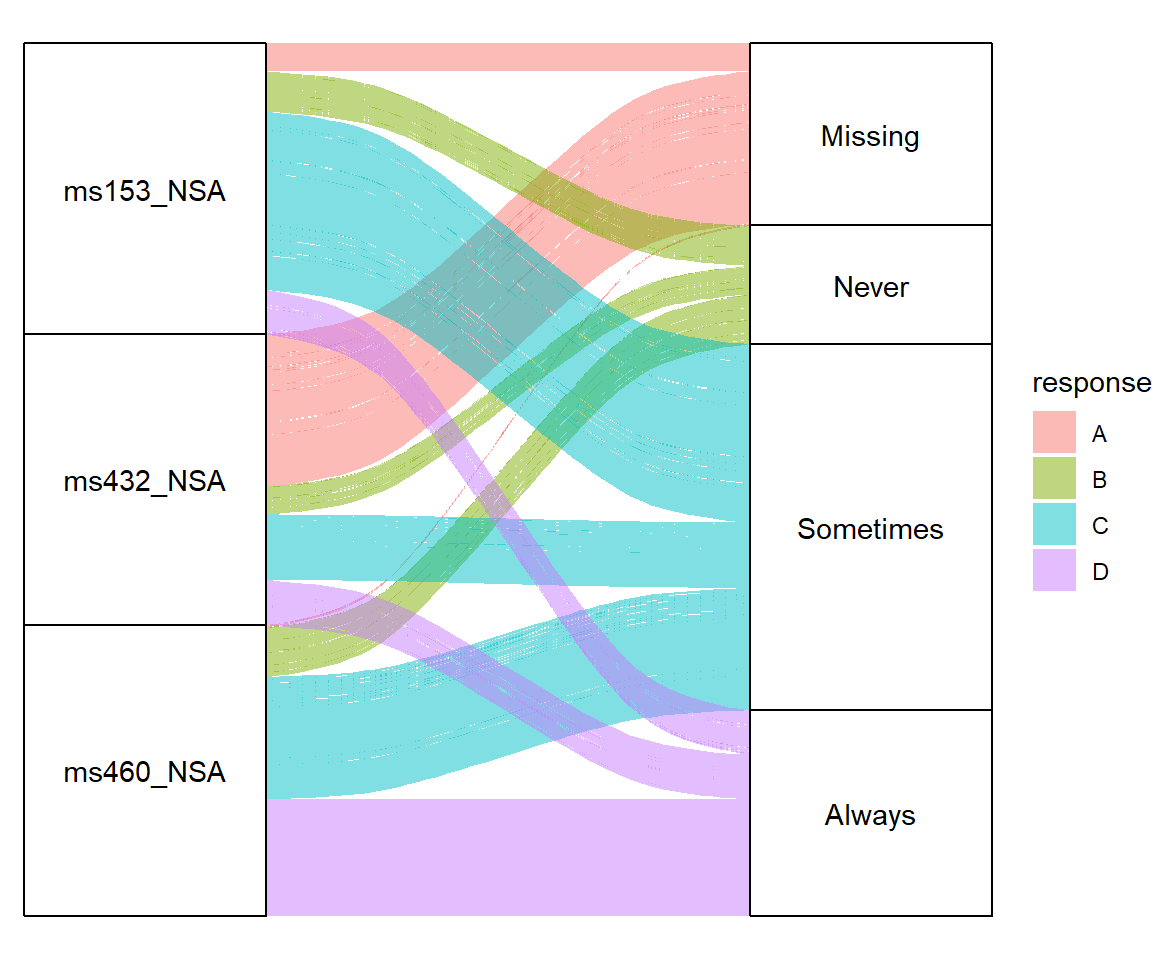
Legend key labels
# install.packages("ggalluvial")
library(ggalluvial)

ggplot(data = vaccinations,
       aes(axis1 = survey, axis2 = response, y = freq)) +
  geom_alluvium(aes(fill = response)) +
  geom_stratum() +
  geom_text(stat = "stratum",
            aes(label = after_stat(stratum))) +
  scale_x_discrete(limits = c("Survey", "Response"),
                   expand = c(0.15, 0.05)) +
  theme_void() +
  scale_fill_hue(labels = c("A", "B", "C", "D"))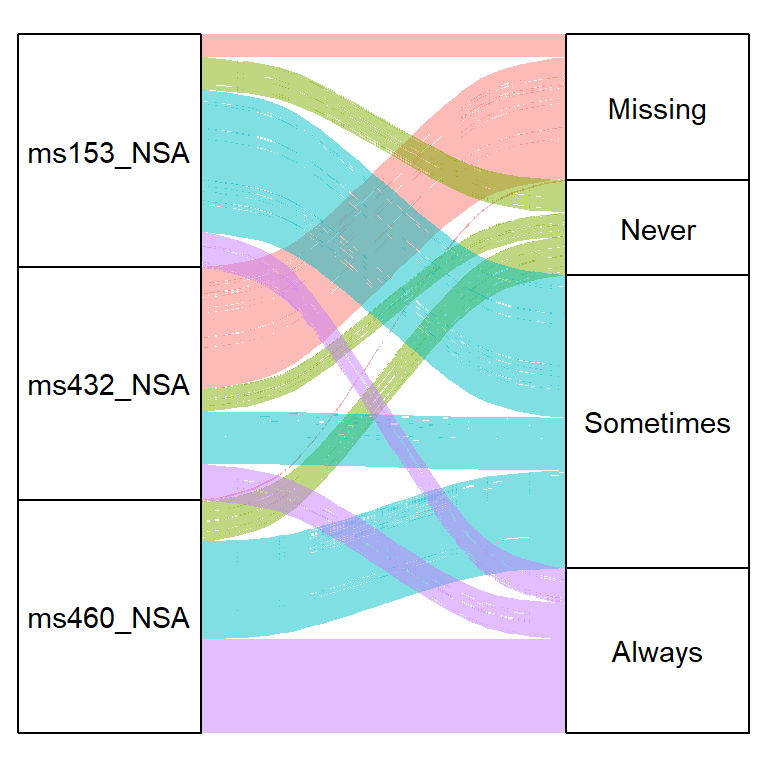
Remove the legend
# install.packages("ggalluvial")
library(ggalluvial)

ggplot(data = vaccinations,
       aes(axis1 = survey, axis2 = response, y = freq)) +
  geom_alluvium(aes(fill = response)) +
  geom_stratum() +
  geom_text(stat = "stratum",
            aes(label = after_stat(stratum))) +
  scale_x_discrete(limits = c("Survey", "Response"),
                   expand = c(0.15, 0.05)) +
  theme_void() +
  theme(legend.position = "none")
Master Statistics
Learn statistics from the basics to advanced techniques, clearly explained
Go to site