Sample data set
Consider the following data set that contains two variables that represent values and its corresponding event, date or group.
# install.packages("ggalluvial")
library(ggalluvial)

group <- LETTERS[1:6]
value <- c(2000, 4000, 2000,
           -1500, -1000, -2500)
df <- data.frame(x = group, y = value)
Waterfall graph
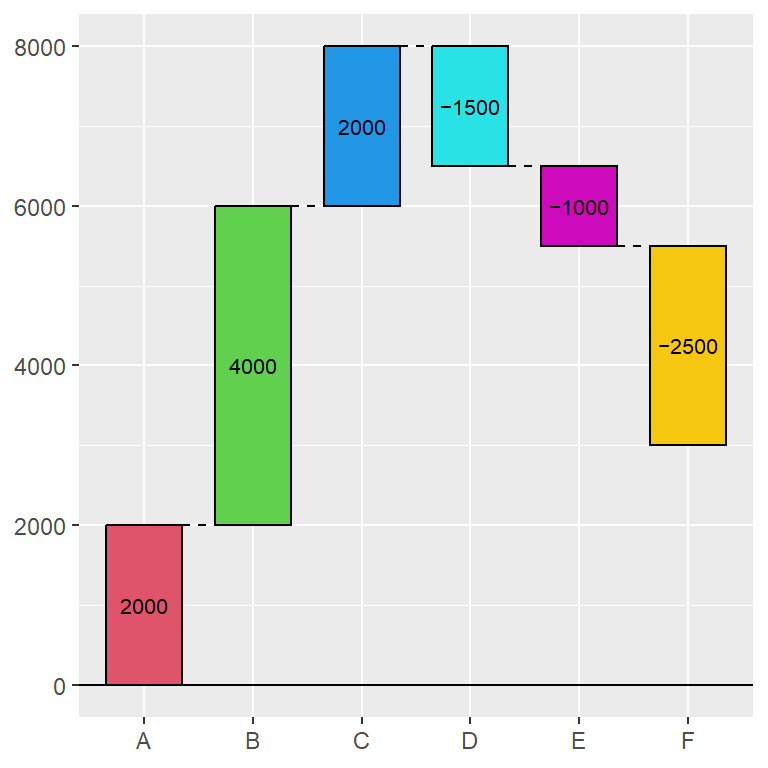
In order to create a waterfall chart in ggplot2 making use of the waterfalls package you can pass your data frame with groups and values or pass the vectors to the values and labels arguments of the waterfall function.
# install.packages("waterfalls")
library(waterfalls)

waterfall(df)

# Equivalent to:
waterfall(values = value, labels = group)
Calculate the total
Setting the argument calc_total to TRUE the final pool will be calculated and a new rectangle will be added to the chart containing the result. You can change the axis name of this rectangle with total_axis_text.
# install.packages("waterfalls")
library(waterfalls)

waterfall(df, calc_total = TRUE)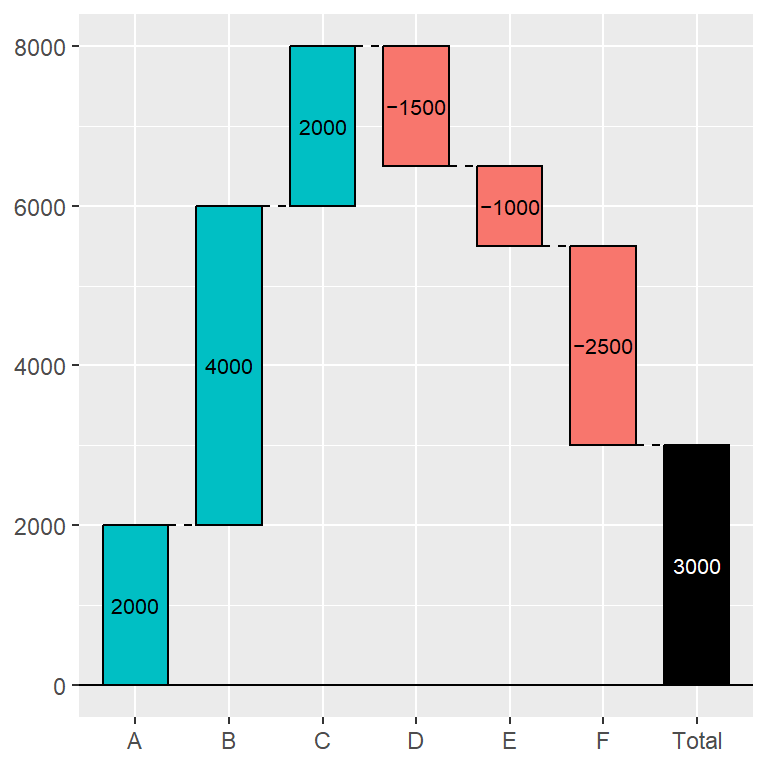
Rectangles width
Note that the rect_width argument controls the width of the rectangles. The default value is 0.7.
# install.packages("waterfalls")
library(waterfalls)

waterfall(df, rect_width = 0.4)
Remove lines between rectangles
Between successive rectangles there are dashed lines joining the rectangles. You can remove them setting draw_lines to FALSE.
# install.packages("waterfalls")
library(waterfalls)

waterfall(df, draw_lines = FALSE)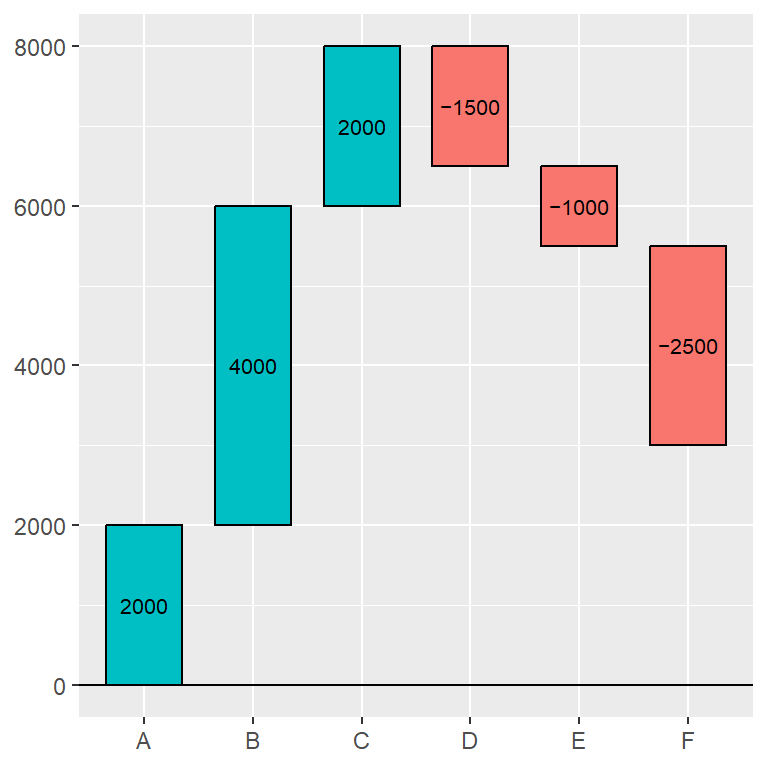
Lines type
If you want to keep the lines between the rectangles but prefer to change its line type you can change it with the linetype argument.
# install.packages("waterfalls")
library(waterfalls)

waterfall(df, linetype = 1)
Color customization
Fill the rectangles with custom colors
By default fill_by_sign = TRUE, so the positive and negative values will each have the same color. If you set this argument to FALSE you can set custom colors with the fill_colours argument.
# install.packages("waterfalls")
library(waterfalls)

waterfall(df,
          fill_by_sign = FALSE,
          fill_colours = 2:7)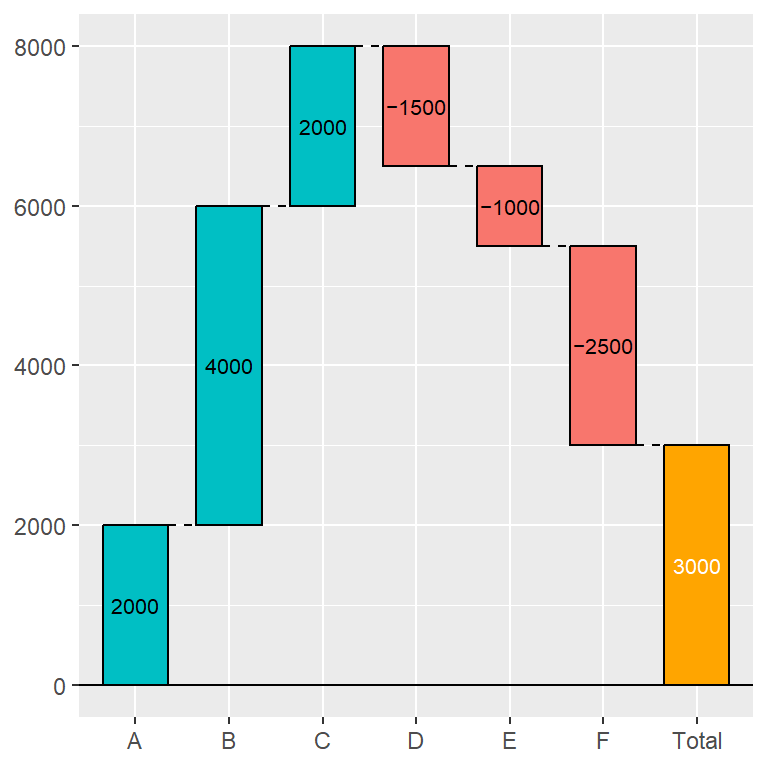
Total rectangle colors
If you added the total with calc_total = TRUE you can change the color of the rectangle with total_rect_color and the color of its text with total_rect_text_color.
# install.packages("waterfalls")
library(waterfalls)

waterfall(df, calc_total = TRUE,
          total_rect_color = "orange",
          total_rect_text_color = "white")
Border color
Note that you can also change the color of the border of the rectangles. If you set them to NA no borders will be displayed, as shown below.
# install.packages("waterfalls")
library(waterfalls)

waterfall(df, rect_border = NA)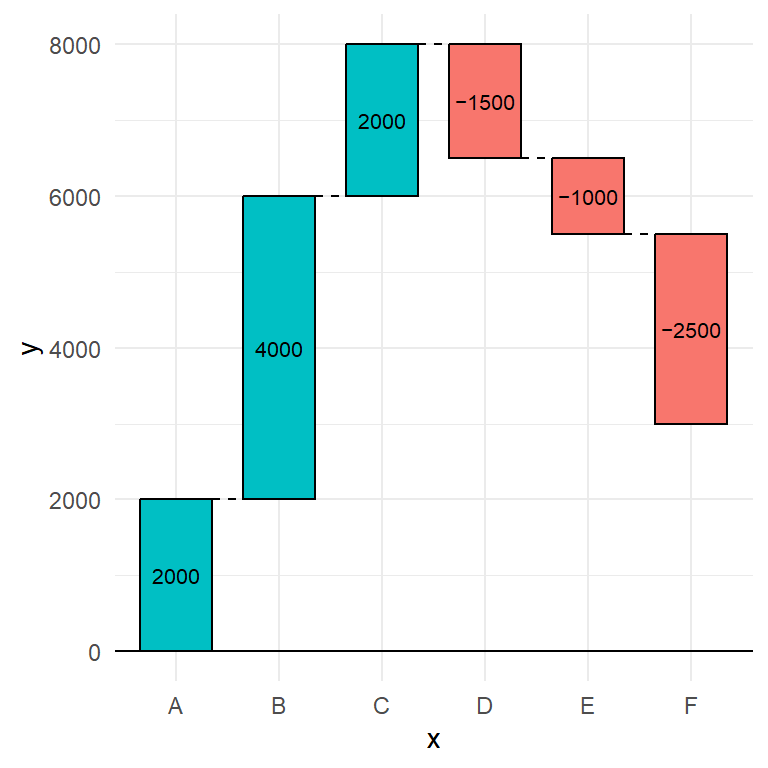
Change the theme
Finally, as the package is based on ggplot2 you can add more layers to it, as a title, subtitle or change the default theme, as shown below, among other customizations.
# install.packages("waterfalls")
library(waterfalls)
# install.packages("ggplot2)
library(ggplot2)

waterfall(df) +
  theme_minimal()
Master Statistics
Learn statistics from the basics to advanced techniques, clearly explained
Go to site