Reading images and documents
You can import an image (PNG or JPEG) to R with the image_read function from the magick package. If you assign the result to an object then you can print it with the print function. Note that you can set info = FALSE to avoid printing the information about the image.
# install.packages("magick")
library(magick)

# Reading a PNG
image <- image_read('https://raw.githubusercontent.com/R-CoderDotCom/samples/main/bird.png')

# Printing the image
print(image, info = FALSE)
Get the image details
If you want to obtain the width, height and other details about the image you can use the image_info function and assing the result to a variable. Then, you will be able to access each of the elements, such as the width and height of the imported image.
# install.packages("magick")
library(magick)

image <- image_read('https://raw.githubusercontent.com/R-CoderDotCom/samples/main/bird.png')

# Image details
info <- image_info(image)

# See the details
print(info)

# You can also access to each element
info$width # 250px
info$height # 250px
format width height colorspace matte filesize density
1 PNG 720 893 sRGB TRUE 68794 72x72Read a SVG
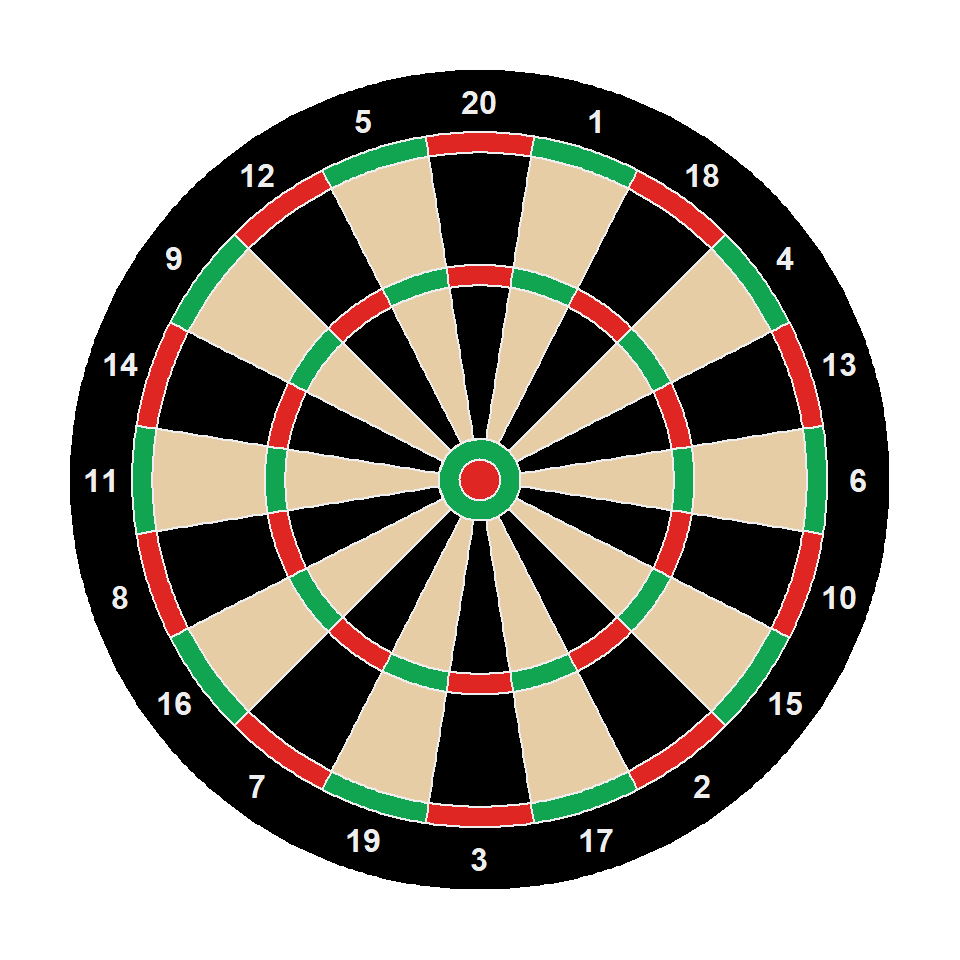
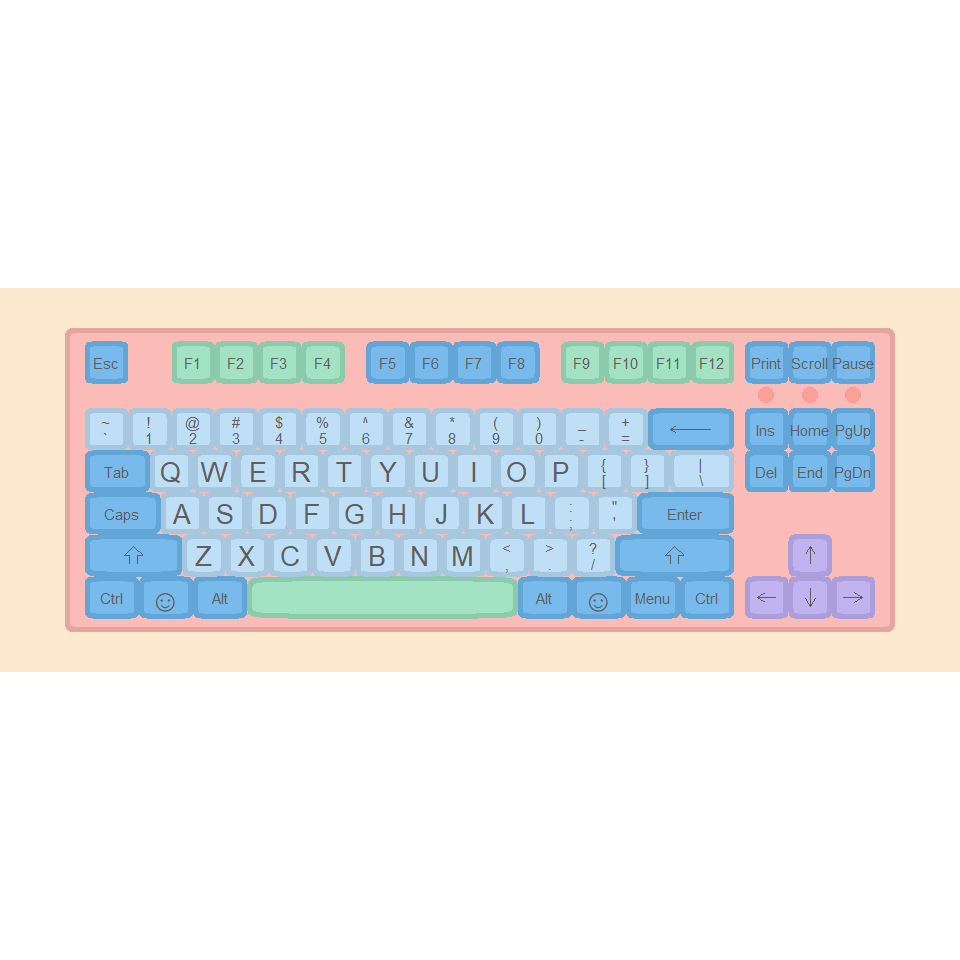
With the image_read_svg function you will be able to import a SVG file. In this scenario, you will need to set the width and height with the corresponding arguments.
# install.packages("magick")
library(magick)

# Read a SVG
tiger <- image_read_svg('https://raw.githubusercontent.com/R-CoderDotCom/samples/main/tiger.svg',
                        width = 500, height = 500)

print(image, info = FALSE)
You can convert an image to other formats with the image_convert function, specifying the desired output format in the format argument of the function.
Read a PDF document as image
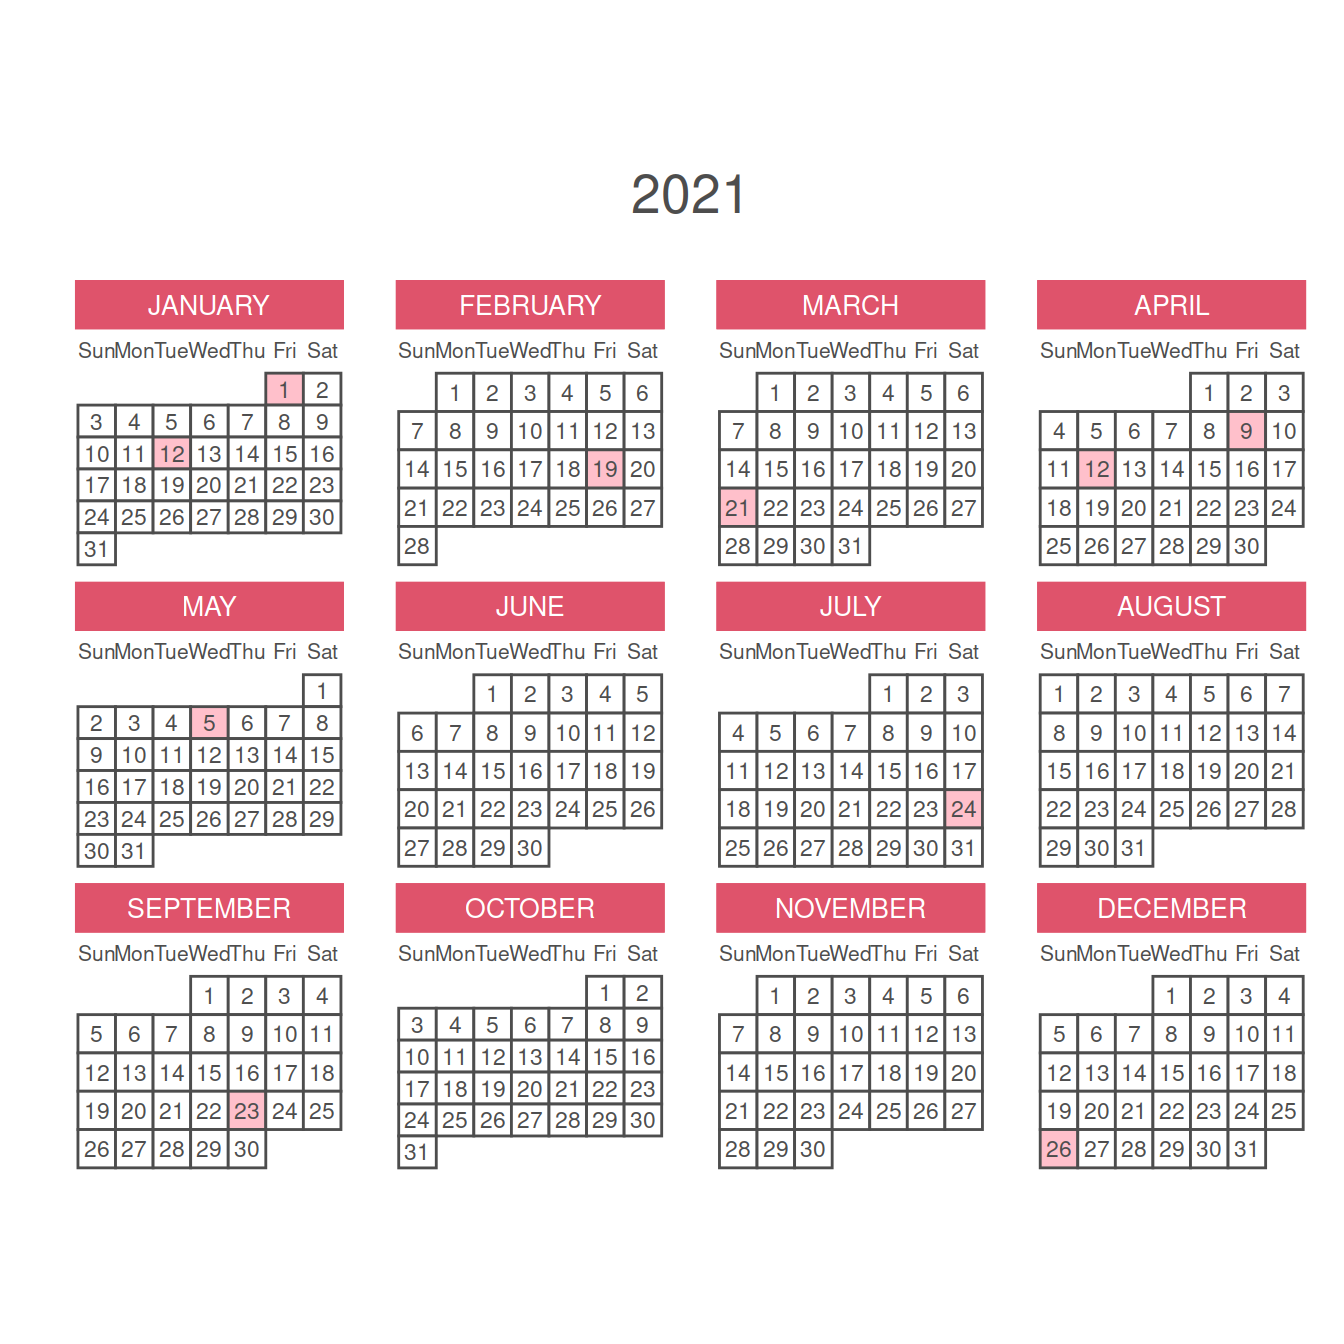
The image_read_pdf function allows reading PDF documents and transforming each page into a PNG. You can choose any page or pages with the pages argument, but if not specified, all pages will be converted and then you will be able to see all.
# install.packages("magick")
# install.packages("pdftools")
library(magick)
# Read a PDF
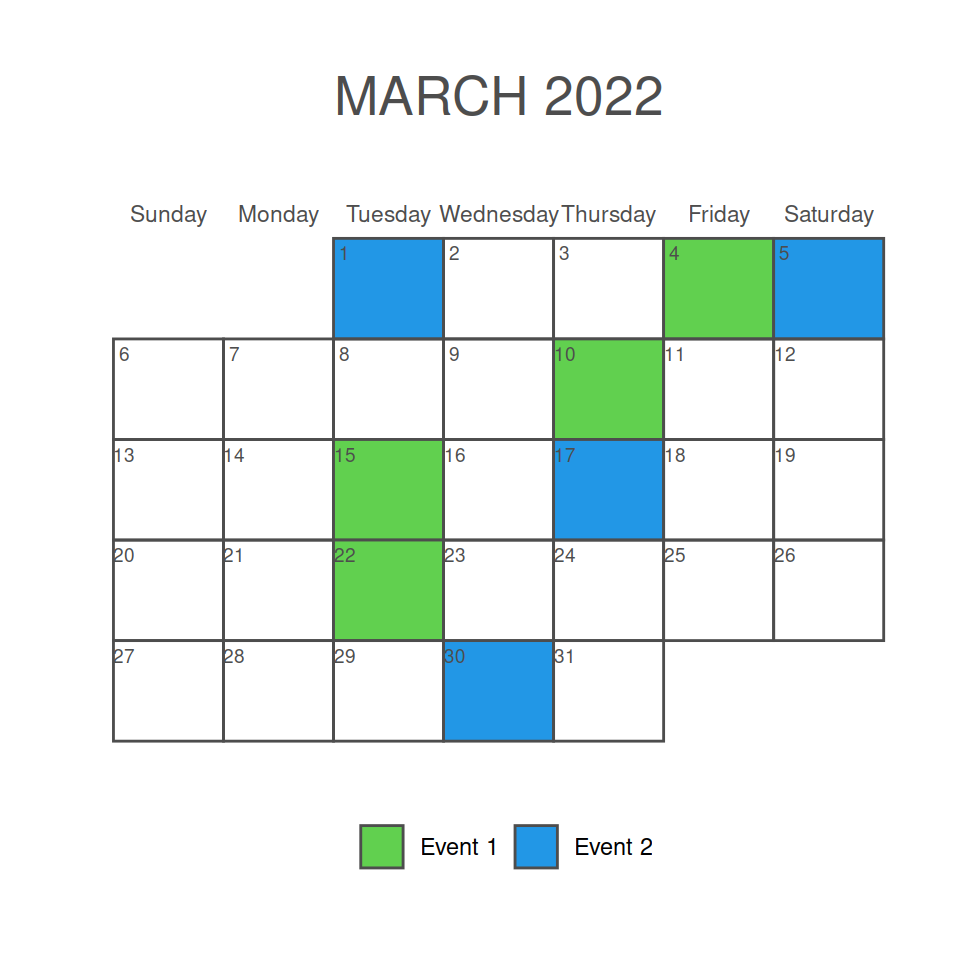
pdf_doc <- image_read_pdf('https://cran.r-project.org/web/packages/calendR/calendR.pdf')
# All pages
pdf_doc
# Page 1
pdf_doc[[1]]
# Read only page one
pdf_page <- image_read_pdf('https://cran.r-project.org/web/packages/calendR/calendR.pdf', pages = 1)
pdf_page
It is possible to extract the text from an image with the image_ocr function. For instance, in the previous example you could write cat(image_ocr(pdf_doc)) to extract the text. Note that the tesseract package must be installed in order to work.
There are several functions to export the images, gifs and videos created with magick package. These functions are: image_write, image_write_gif and image_write_video.
Image editing
The magick package provides several functions to scale, crop, trim, rotate and paint images. These functions will be highlighted in the following blocks of code.
Resize and crop
Scale the image to a specific width
If your image is too big or too small you can make use of the image_scale function to scale it to the desired size. By default, you can input an integer as character to scale the width of the image to that size in pixels.
# install.packages("magick")
library(magick)

r <- image_read('https://raw.githubusercontent.com/R-CoderDotCom/samples/main/bird.png')

image_scale(r, "200")
Scale the image to a specific height
If you add an x before the number instead of width the number will be interpreted as the desired height of the scaled image.
# install.packages("magick")
library(magick)

r <- image_read('https://raw.githubusercontent.com/R-CoderDotCom/samples/main/bird.png')

image_scale(r, "x400")
Trim the margins of the image
If your image is a PNG and the transparent area is big you can use the image_trim function to trim the margins of the image.
# install.packages("magick")
library(magick)

r <- image_read('https://raw.githubusercontent.com/R-CoderDotCom/samples/main/bird.png')

image_trim(r)
Crop the image
Making use of the image_crop function you can crop the image. In order to crop an image you will need to specify a geometry indicating the width and height for the resulting image and where to make the crop.
# install.packages("magick")
library(magick)

r <- image_read('https://raw.githubusercontent.com/R-CoderDotCom/samples/main/bird.png')

# Width: 200px, height: 300px,
# starting at +200px from the left and 300 from the top
image_crop(r, geometry = "200x300+200+300")
Rotate
Rotating the image
With image_rotate you can rotate the image the angle specified in degrees.
# install.packages("magick")
library(magick)

r <- image_read('https://raw.githubusercontent.com/R-CoderDotCom/samples/main/bird.png')

image_rotate(r, degrees = 45)
Vertical flip
The image_flip function is a shortcut if you want to flip the image vertically instead of specifying the degrees.
# install.packages("magick")
library(magick)

r <- image_read('https://raw.githubusercontent.com/R-CoderDotCom/samples/main/bird.png')

image_flip(r)
Horizontal flip (mirror)
You can mirror the image (horizontal flip) with the image_flop function, as shown in the example below.
# install.packages("magick")
library(magick)

r <- image_read('https://raw.githubusercontent.com/R-CoderDotCom/samples/main/bird.png')

image_flop(r)
Paint
Background color
If your image is a PNG with transparent background you can set a background color with the image_background function. The color can be specified using the color argument.
# install.packages("magick")
library(magick)

r <- image_read('https://raw.githubusercontent.com/R-CoderDotCom/samples/main/bird.png')

image_background(r, color = "#cbe7ff")
Adding a border
You can add a border to your image with image_border. For that purpose, you will need to specify a color and a geometry. In the following example we are creating a border with a height of 8 pixels and width of 10 pixels. An alternative function to add a border is image_frame.
# install.packages("magick")
library(magick)

r <- image_read('https://raw.githubusercontent.com/R-CoderDotCom/samples/main/bird.png')

image_border(r, color = "#cbe7ff", geometry = "8x10")
Fill with color at a specific point
The image_fill function allows changing a specific color that exists on a point. In the following example we are changing the color to blue at "+420+520", which means that the point is placed at x = 420 and y = 520 coordinates, but note that the image of the sample has gradient colors, so the result is not good. This function will be very useful, for instance, to change the background color of a PNG file.
# install.packages("magick")
library(magick)

r <- image_read('https://raw.githubusercontent.com/R-CoderDotCom/samples/main/bird.png')

image_fill(r, "blue", "+420+540")
Adding texts to images
With image_annotate it is possible to add texts over images. You just need to pass the desired image and the text and then set the size, the angle, the gravity (type gravity_types() for the list of available options) or locations and other styling, such as the color, stroke, weight or font family with the arguments provided by the function.
# install.packages("magick")
library(magick)

r <- image_read('https://raw.githubusercontent.com/R-CoderDotCom/samples/main/bird.png')

image_annotate(r, "Text over an image", size = 75, gravity = "center", color = "black")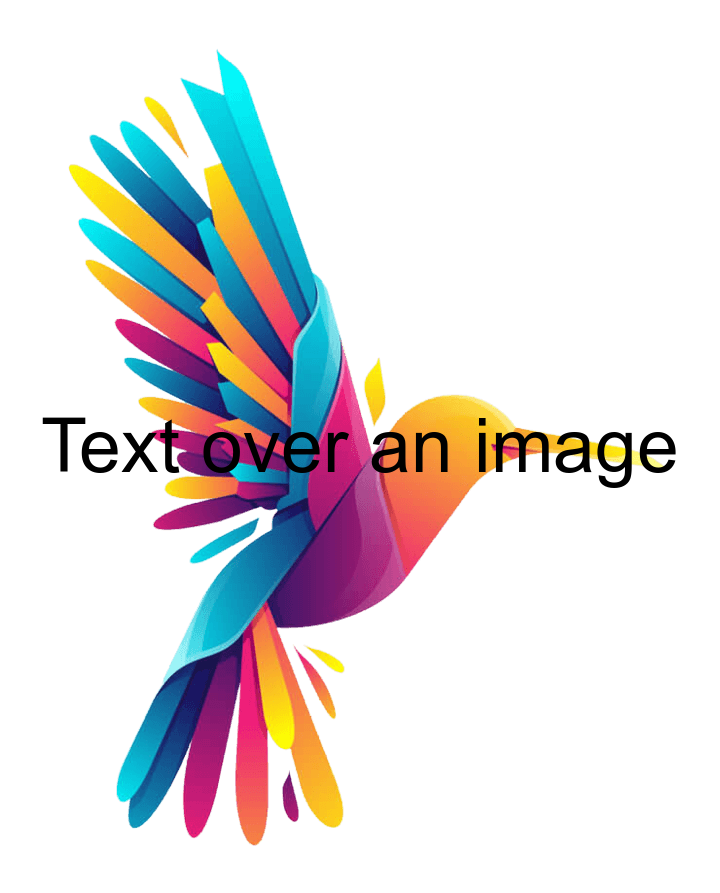
Text inside a box
Note that the function also provides an argument named boxcolor that can be set to any color to create a box around the text.
# install.packages("magick")
library(magick)

r <- image_read('https://raw.githubusercontent.com/R-CoderDotCom/samples/main/bird.png')

image_annotate(r, "Text over an image", size = 75, gravity = "center", color = "black",
               degrees = 45, boxcolor = "white")
Image effects and filters
Adding blur
You can distort an image by adding blur to it with the image_blur function. This function provides two arguments named radius (defaults to 1) and sigma (defaults to 0.5) to customize the level of blur.
# install.packages("magick")
library(magick)

r <- image_read('https://raw.githubusercontent.com/R-CoderDotCom/samples/main/bird.png')

image_blur(r, radius = 10, sigma = 5)
Adding noise
The image_noise function allows adding noise to the image. By default, the noise is gaussian, but you can check the available noise types with noise_types().
# install.packages("magick")
library(magick)

r <- image_read('https://raw.githubusercontent.com/R-CoderDotCom/samples/main/bird.png')

image_noise(r)
Invert the color
With image_negate you will be able to invert the colors of the image.
# install.packages("magick")
library(magick)

r <- image_read('https://raw.githubusercontent.com/R-CoderDotCom/samples/main/bird.png')

image_negate(r)
Charcoal effect
The magick package also provides some effects, such as the charcoal effect with image_charcoal.
# install.packages("magick")
library(magick)

r <- image_read('https://raw.githubusercontent.com/R-CoderDotCom/samples/main/bird.png')

image_charcoal(r)
Implode effect
Other effect is the implode effect, which will implode the image based on a implode factor.
# install.packages("magick")
library(magick)

r <- image_read('https://raw.githubusercontent.com/R-CoderDotCom/samples/main/bird.png')

image_implode(r, factor = 0.75)
Oil paint effect
The last effect we are going to highlight is the oil paint effect that can be created with the image_oilpaint function.
# install.packages("magick")
library(magick)

r <- image_read('https://raw.githubusercontent.com/R-CoderDotCom/samples/main/bird.png')

image_oilpaint(r, radius = 10)
The package provides other effects, such as image_despeckle, image_reducenoise, image_motion_blur and image_emboss.
Drawing over images
It is possible to draw over the images making use of the image_draw function. You just need to set draw and then start adding base R elements, such as lines, text, markers, etc. Recall that you can get the width and height of the image with image_info, so you will know the axis limits.
# install.packages("magick")
library(magick)

r <- image_read('https://raw.githubusercontent.com/R-CoderDotCom/samples/main/bird.png')

# Get the size of the image before drawing
info <- image_info(r)
width <- info$width
height <- info$height

# Set an image_draw object
img <- image_draw(r)

# Add some elements
abline(h = height / 2, col = 'blue', lwd = '10', lty = "dotted")
abline(v = width / 2, col = 'blue', lwd = '10', lty = "dotted")
rect(xleft = (width / 2) - 75, ybottom = (height / 2) - 75,
     xright = (width / 2) + 75, ytop = (height / 2) + 75, border = "red", lwd = 5)
text(600, 600, "Text", cex = 5)

dev.off()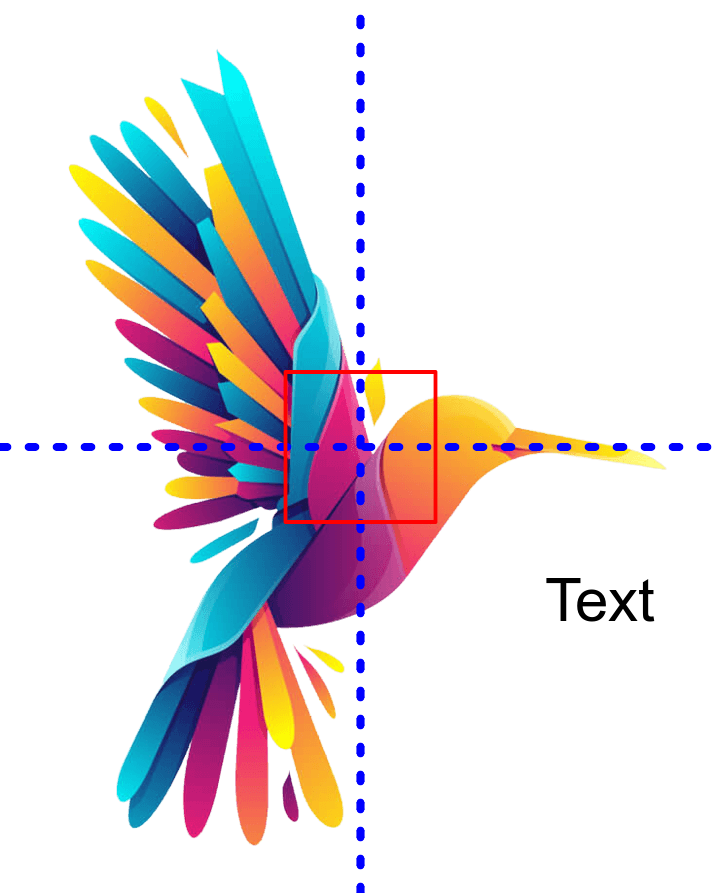
Composing images
Appending images side by side
It is possible to append several images with the image_append function. By default, the function will append the images side by side, but the images can also be stacked when stack = TRUE.
# install.packages("magick")
library(magick)

# Read some images
r1 <- image_read('https://raw.githubusercontent.com/R-CoderDotCom/samples/main/bird.png')
r2 <- image_read_svg('https://raw.githubusercontent.com/R-CoderDotCom/samples/main/tiger.svg', width = 500, height = 500)

# Join the images
r <- c(r1, r2)

# Append the images
image_append(r)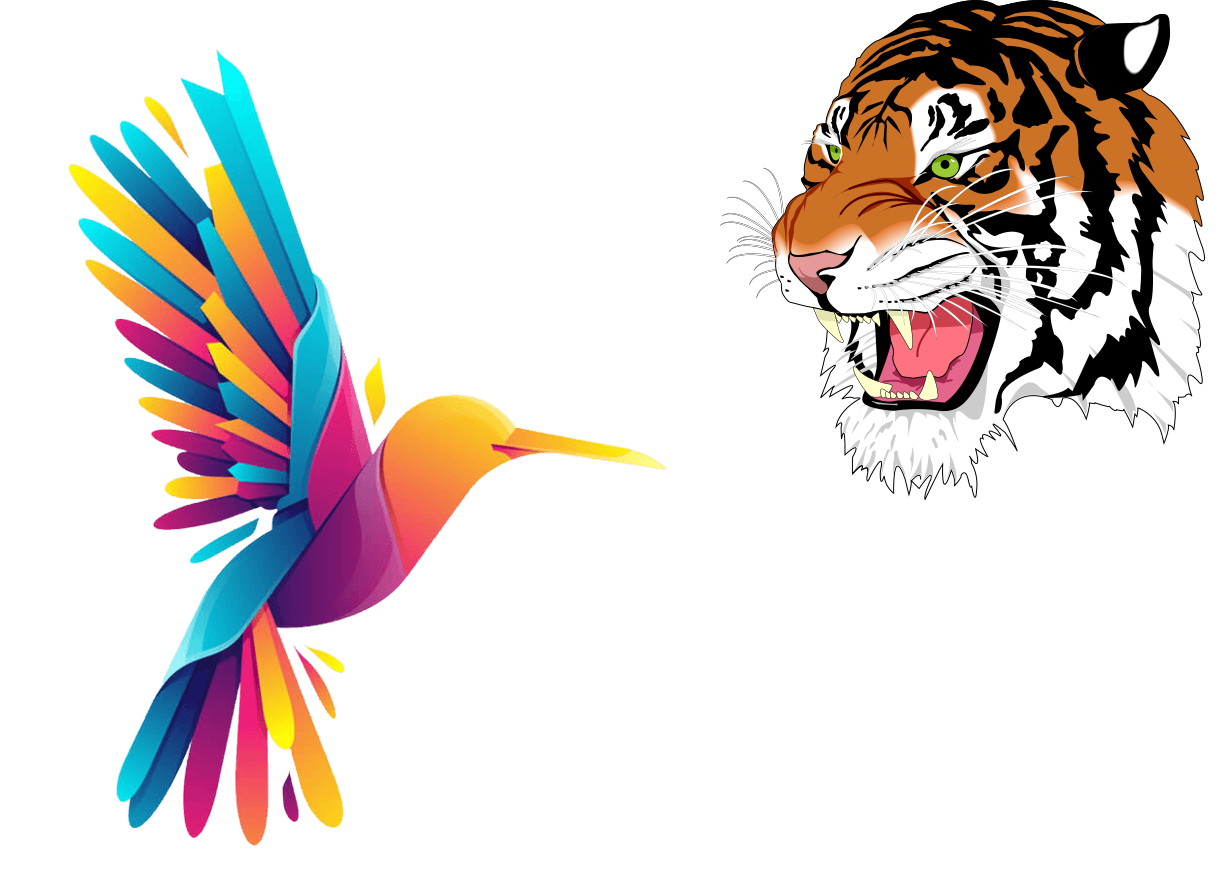
Combining several images
You can combine several images with the image_mosaic function. An alternative is image_flatten, which will combine the images based on the size of the first image.
# install.packages("magick")
library(magick)

# Read some images
r1 <- image_read('https://raw.githubusercontent.com/R-CoderDotCom/samples/main/bird.png')
r2 <- image_read_svg('https://raw.githubusercontent.com/R-CoderDotCom/samples/main/tiger.svg', width = 500, height = 500)

# Join the images
r <- c(r1, r2)

# Combine the images
image_mosaic(r)
Composing several images
The image_composite function composes an image over another using an operator. The default operator is "atop", but you can write compose_types() in order to get the full list of available operators.
# install.packages("magick")
library(magick)

# Read some images
r1 <- image_read('https://raw.githubusercontent.com/R-CoderDotCom/samples/main/bird.png')
r2 <- image_read_svg('https://raw.githubusercontent.com/R-CoderDotCom/samples/main/tiger.svg', width = 500, height = 500)

# Compose the images
image_composite(image = r1, composite_image = r2)
Image over ggplot2 chart
A really interesting feature of the magick package is that allows adding the images over your charts. There are several alternatives to add them, but the best way is to use the grid.raster function from the grid package, as shown in the following example.
# install.packages("magick")
# install.packages("ggplot2")
# install.packages("grid")
library(magick)
library(ggplot2)
library(grid)

r <- image_read('https://raw.githubusercontent.com/R-CoderDotCom/samples/main/bird.png') %>%
  image_trim()

# ggplot2 plot
qplot(Sepal.Length, Sepal.Width, data = iris, geom = c("point", "smooth"))

# Image over plot at the center
grid.raster(r,
            x = 0.5, y = 0.5,
            width = unit(150, "points"))
Image over base R chart
Images can also be added to base R charts using the same function as the one used in the previous example.
# install.packages("magick")
# install.packages("grid")
library(magick)
library(grid)

r <- image_read('https://raw.githubusercontent.com/R-CoderDotCom/samples/main/bird.png') %>%
  image_trim()

# Plot
plot(1:10, pch = 16, cex = 5, col = rainbow(10))

# Image over plot at the center
grid.raster(r,
            x = 0.5, y = 0.5,
            width = unit(100, "points"))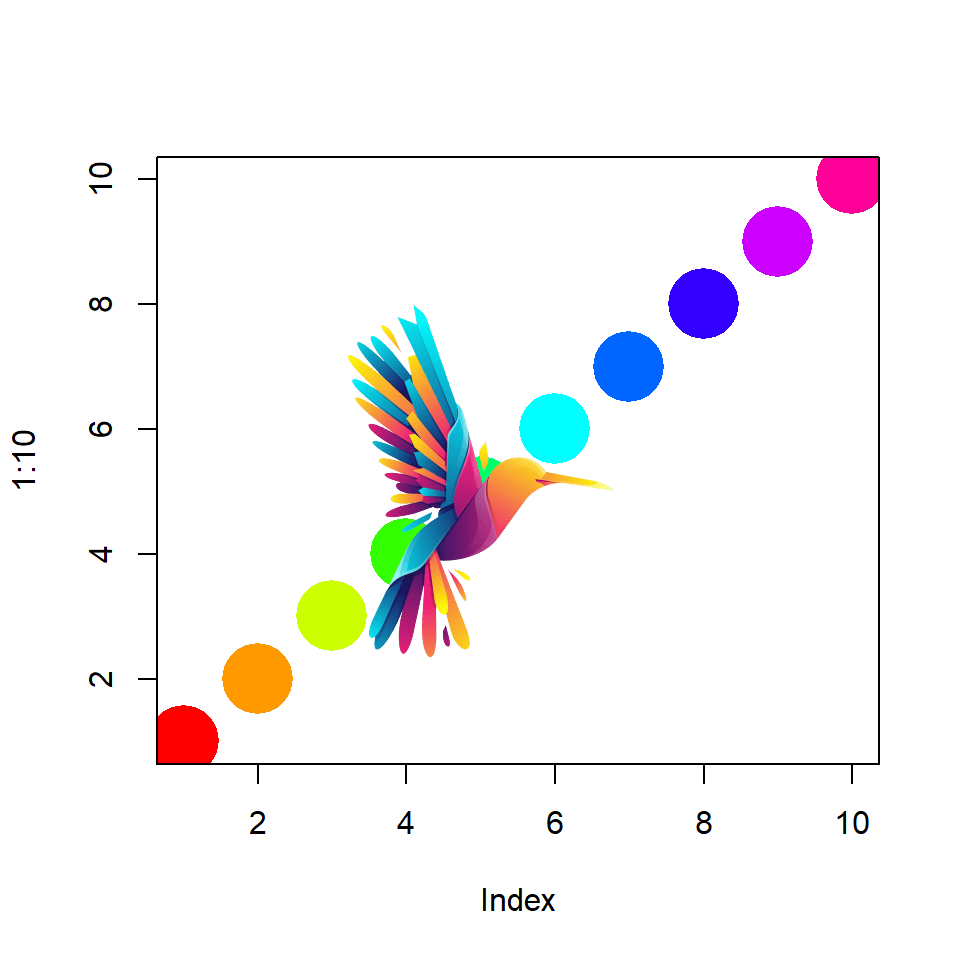
Animations
The image_animate function allows animating several images. By default the animation is at 10 frames per second but you can customize them with fps. You can also customize the disposal method with dispose, which possible values are "background", "previous" and "none".
# install.packages("magick")
library(magick)

# Read some images
r1 <- image_read('https://raw.githubusercontent.com/R-CoderDotCom/samples/main/bird.png')
r2 <- image_read_svg('https://raw.githubusercontent.com/R-CoderDotCom/samples/main/tiger.svg', width = 500, height = 500)

# Join the images
r <- c(r1, r2)

# Create a 1fps gif
image_animate(r, fps = 1, dispose = "previous")
With image_morph you can create a smooth transition between images. In the following example we are creating a transition between the normal image and the negative of the image.
# install.packages("magick")
library(magick)

# Read some images
r1 <- image_read('https://raw.githubusercontent.com/R-CoderDotCom/samples/main/bird.png')
r2 <- image_read('https://raw.githubusercontent.com/R-CoderDotCom/samples/main/bird.png') %>%
  image_negate()

# Join the images
r <- c(r1, r2)

# Animate with transition
r %>%
  image_morph() %>%
  image_animate(optimize = TRUE)
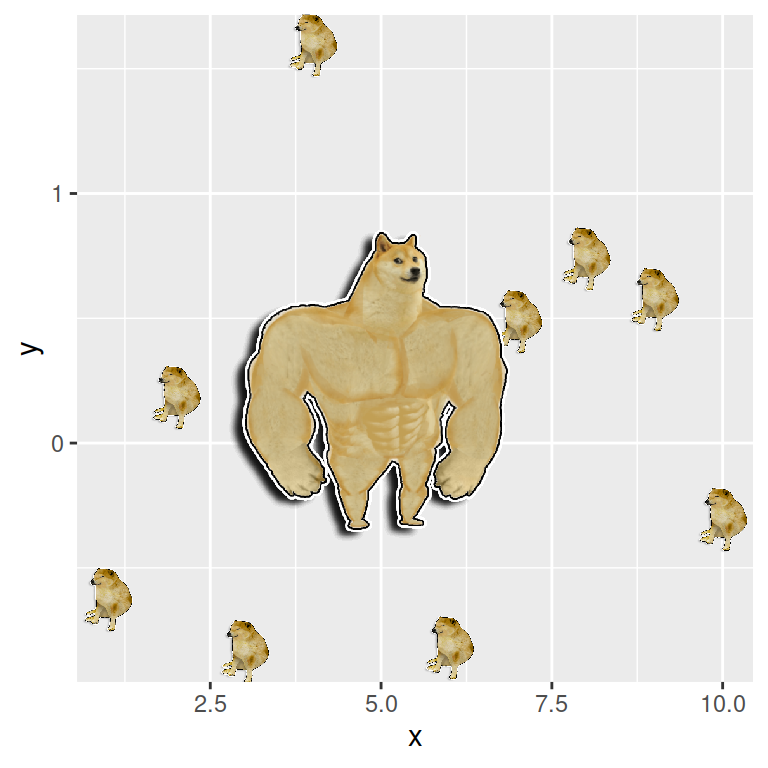
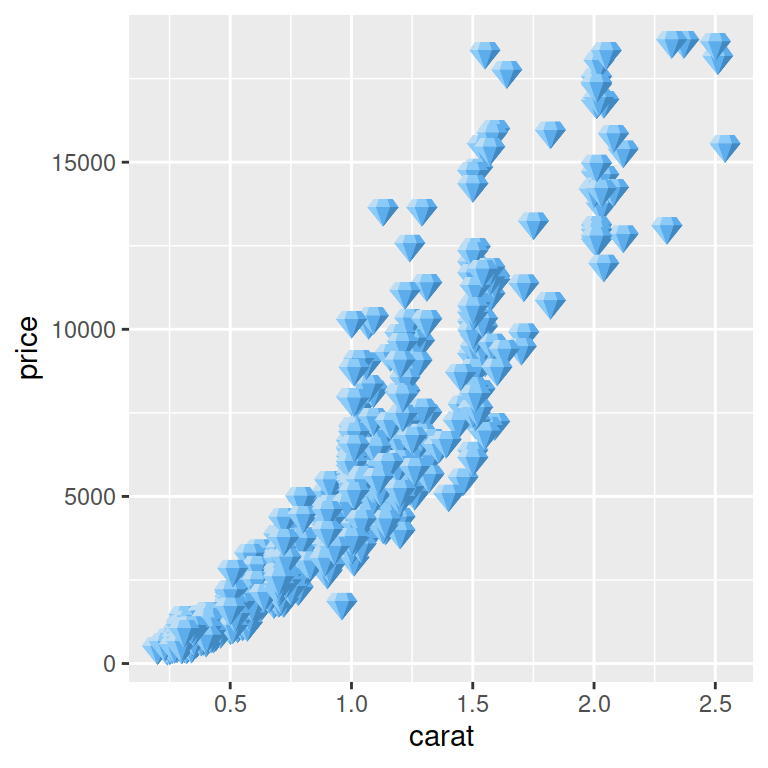
You can also add gifs to your plots making use of several functions. You will need to use the image_graph function, create your plot, combine the gif and the plot with image_composite and then you can use the image_animate function to create the animation.
# install.packages("magick")
library(magick)
# install.packages("ggplot2")
library(ggplot2)

gif_image <- image_read("https://raw.githubusercontent.com/R-CoderDotCom/samples/main/homer.gif") %>%
  image_scale("250")

fig <- image_graph(width = 500, height = 500)

# Data
data <- data.frame(x = 1:12,
                   y = c(0, 100, 200, 457, 479, 550,
                         668, 800, 851, 880, 900, 1000))

ggplot(data, aes(x = x, y = y)) +
  geom_text(aes(x = 4, y = 750, label = "magick package"), size = 10) +
  geom_line(color = "blue", alpha = 0.9, linetype = 2)

dev.off()

# Composing the full image
out <- image_composite(fig, gif_image, offset = "+70+20", gravity = "southeast")

# Animation of the image
animation <- image_animate(out, fps = 10, optimize = TRUE)

# Show the image
print(animation, info = FALSE)