Basic soccer pitch
Creating a soccer pitch with ggsoccer is straightforward. Load the library and add the annotate_pitch layer to ggplot function. In addition, you can use theme_pitch if you want a void theme.
# install.packages("ggplot2)")
# install.packages("ggsoccer")
library(ggplot2)
library(ggsoccer)

ggplot() +
  annotate_pitch() +
  theme_pitch()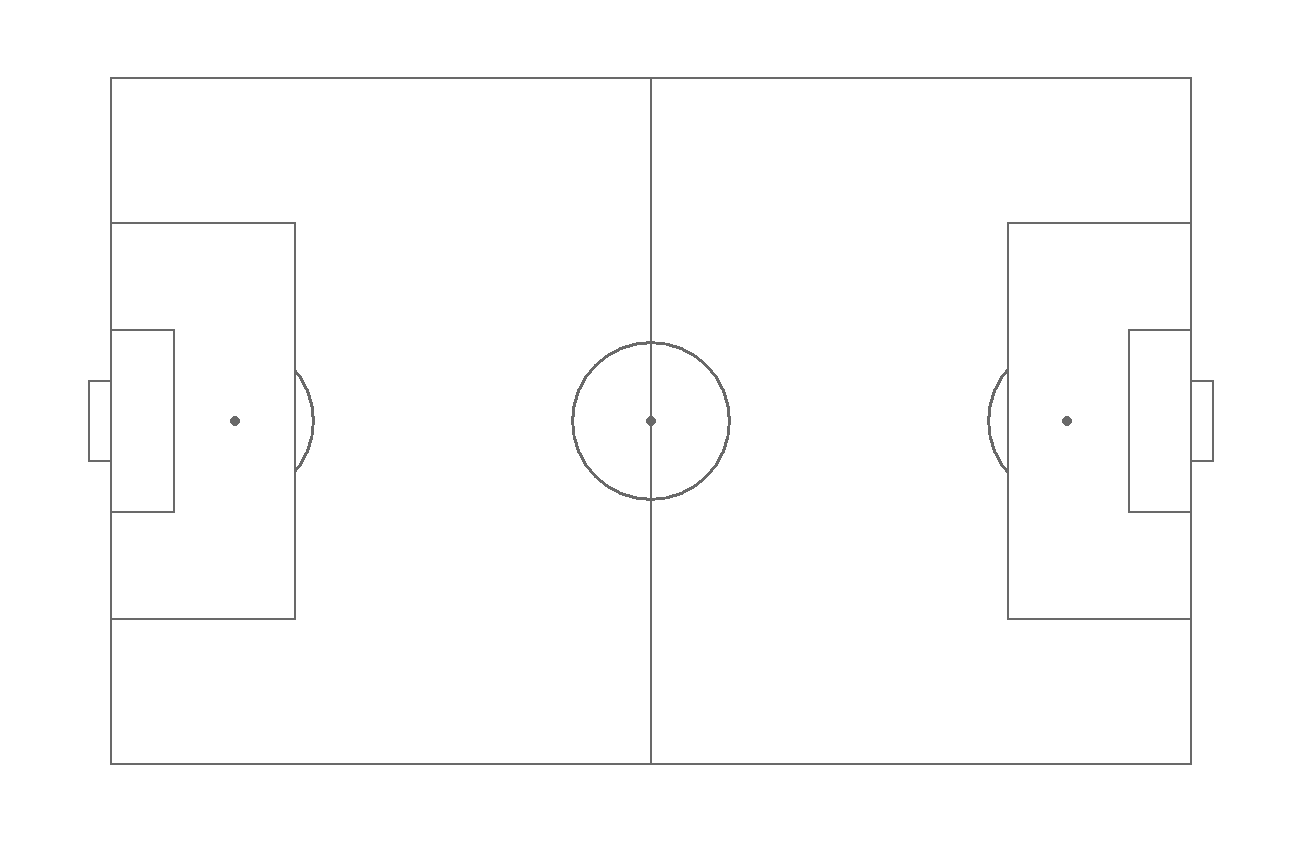
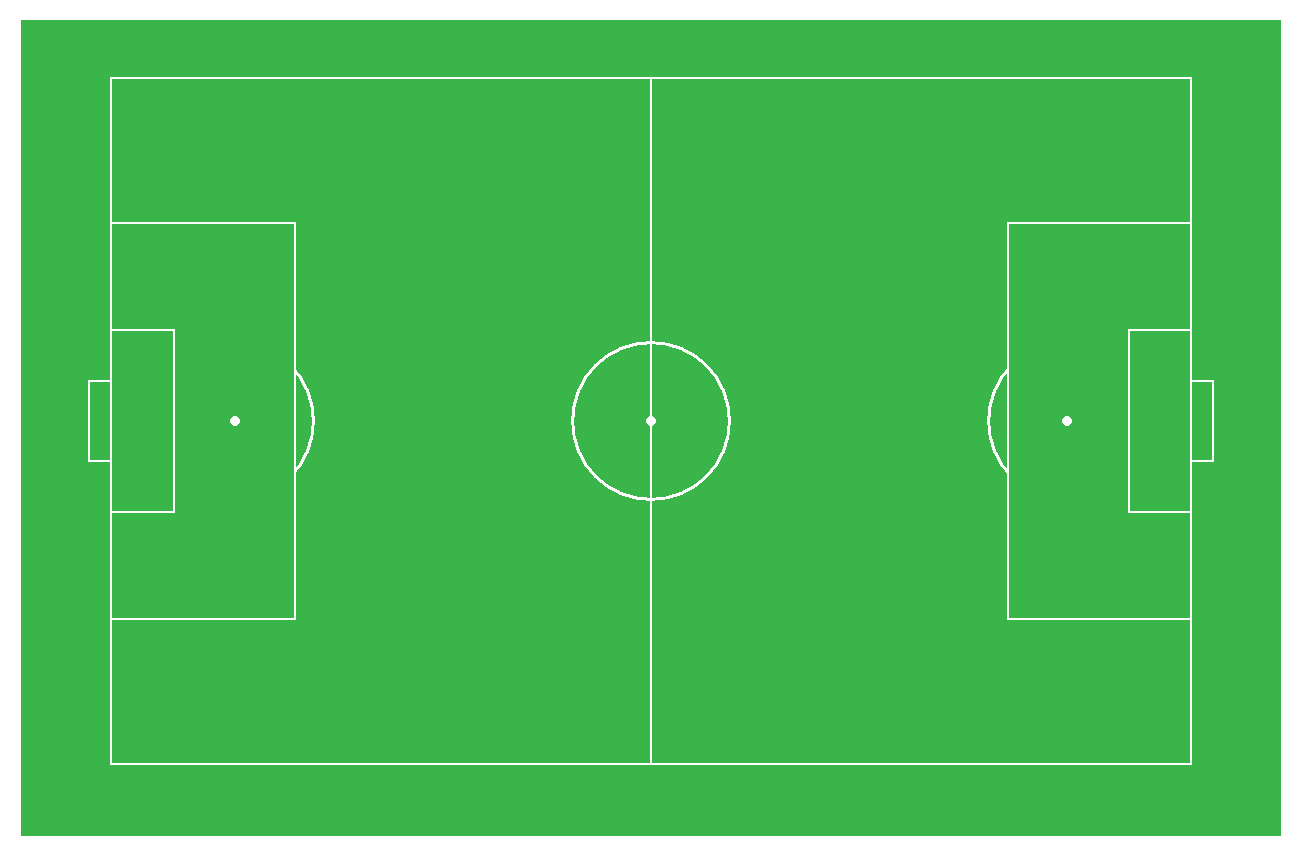
Pitch color
By default the pitch is white with gray lines, but you can customize all the colors. The colour argument allows modifying the color of the lines while the fill argument modifies the color of the pitch. If you want to change the color of the rest of the plot modify the panel.background component of the theme function with an element_rect as follows.
library(ggplot2)
library(ggsoccer)

ggplot() +
 annotate_pitch(colour = "white",
                fill = "#3ab54a") +
 theme_pitch() +
 theme(panel.background = element_rect(fill = "#3ab54a"))
Shot map
You can pass a data frame to create a shot map. Note that the pitch goes from 0 to 100 on both axes. You can also crop the pitch setting axes limits as in any other plot made with ggplot2.
library(ggplot2)
library(ggsoccer)

# Data
set.seed(1)
df <- data.frame(x = rnorm(20, 80, 10),
                 y = rnorm(20, 50, 20),
                 Shot = sample(c("In", "Out"),
                               40, replace = TRUE))

ggplot(df) +
 annotate_pitch(colour = "white",
                fill = "#3ab54a") +
 geom_point(aes(x = x, y = y, fill = Shot),
            shape = 21,
            size = 4) +
 coord_cartesian(xlim = c(45, 105))+
 theme_pitch() +
 theme(panel.background = element_rect(fill = "#3ab54a"))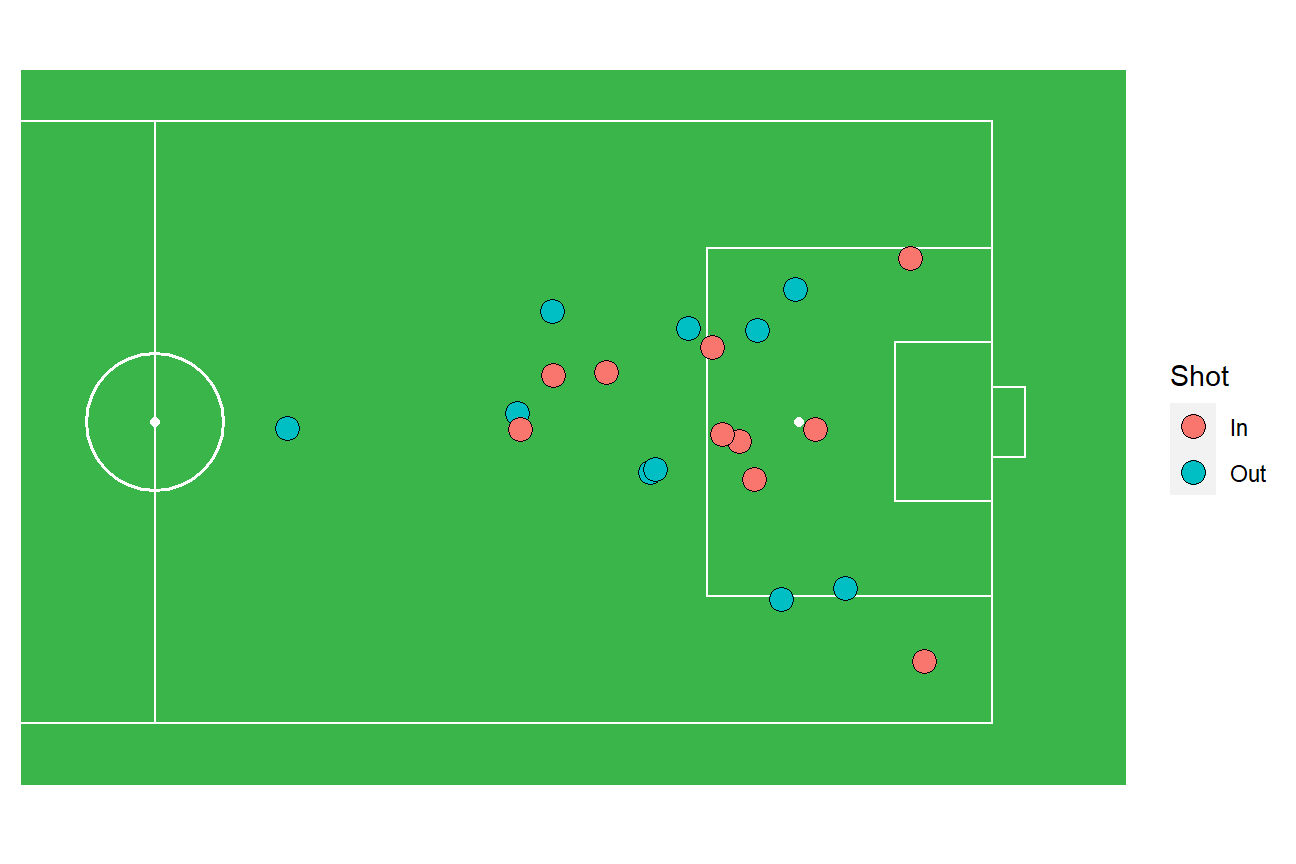
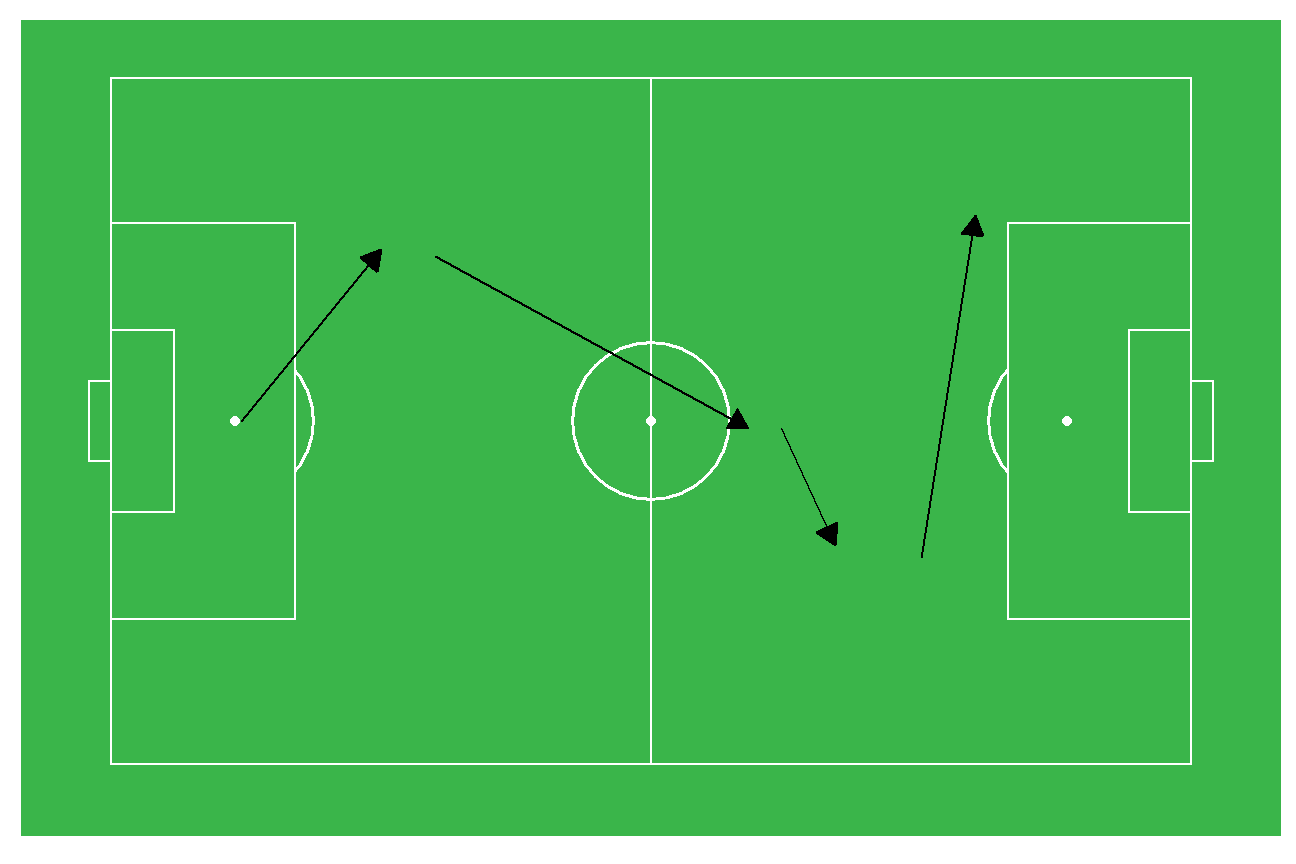
Pass map
Similarly to creating a shot map you can also create a pass map but specifying all the coordinates of the arrows on your data frame and using geom_segment to create the arrows.
library(ggplot2)
library(ggsoccer)

# Data
pass <- data.frame(x1 = c(12, 30, 62, 75),
                   x2 = c(25, 59, 67, 80),
                   y1 = c(50, 74, 49, 30),
                   y2 = c(75, 49, 32, 80))

ggplot(pass) +
 annotate_pitch(colour = "white",
                fill = "#3ab54a") +
  geom_segment(aes(x = x1, y = y1, xend = x2, yend = y2),
               arrow = arrow(length = unit(0.3, "cm"),
                             type = "closed")) +
 theme_pitch() +
 theme(panel.background = element_rect(fill = "#3ab54a"))
Pitch dimensions
The dimensions of the pitch can be modified to fit your needs. Create a list with the corresponding dimensions of each element and pass it to the annotate_pitch function.
library(ggplot2)
library(ggsoccer)

dimensions <- list(
  length = 50,
  width = 40,
  penalty_box_length = 10,
  penalty_box_width = 20,
  six_yard_box_length = 2,
  six_yard_box_width = 8,
  penalty_spot_distance = 7,
  goal_width = 6,
  origin_x = 0,
  origin_y = 0)

ggplot() +
  annotate_pitch(dimensions = dimensions) +
  theme_pitch()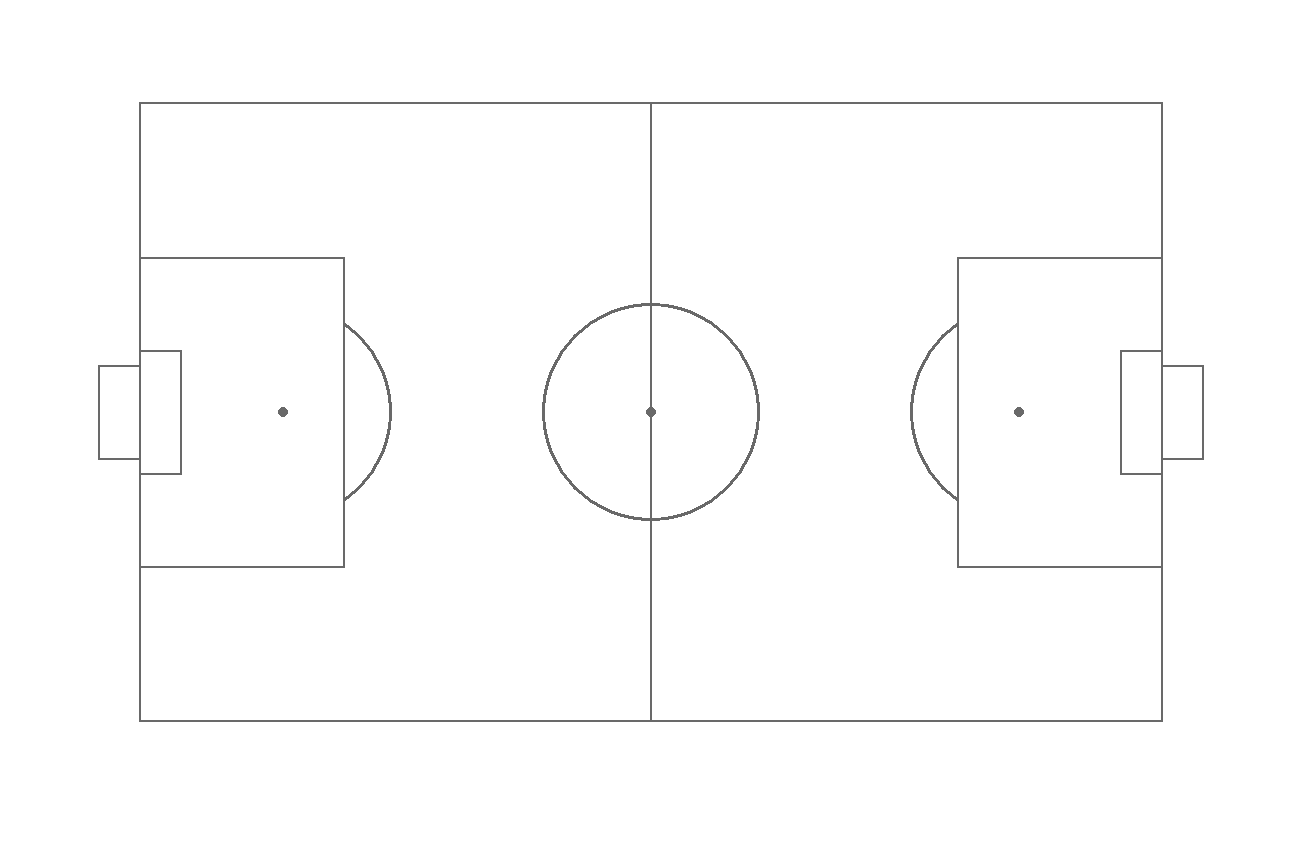

Master Statistics
Learn statistics from the basics to advanced techniques, clearly explained
Go to site