Available dogs
The ggdogs package allows adding dog images instead of points in ggplot2 charts when using the geom_dog function instead of geom_point.
There are 15 different dogs available at this moment, named "doge" (default), "doge_strong", "chihuahua", "eyes", "gabe", "glasses", "tail", "surprised", "thisisfine", "hearing", "pug", "ears", "husky", "husky_2" and "chilaquil". You can pass any of the previous strings to the function to use the corresponding dog.
The following figure shows all the available images:
# install.packages("remotes")
# remotes::install_github("R-CoderDotCom/ggdogs@main")
library(ggdogs)
# install.packages("ggplot2")
library(ggplot2)

grid <- expand.grid(1:5, 3:1)

df <- data.frame(x = grid[, 1],
                 y = grid[, 2],
                 image = c("doge", "doge_strong", "chihuahua",
                           "eyes", "gabe", "glasses",
                           "tail", "surprised", "thisisfine",
                           "hearing", "pug", "ears",
                           "husky", "husky_2", "chilaquil"))

ggplot(df) +
 geom_dog(aes(x, y, dog = image), size = 5) +
 geom_text(aes(x, y - 0.5, label = image), size = 2.5) +
 xlim(c(0.25, 5.5)) +
 ylim(c(0.25, 3.5))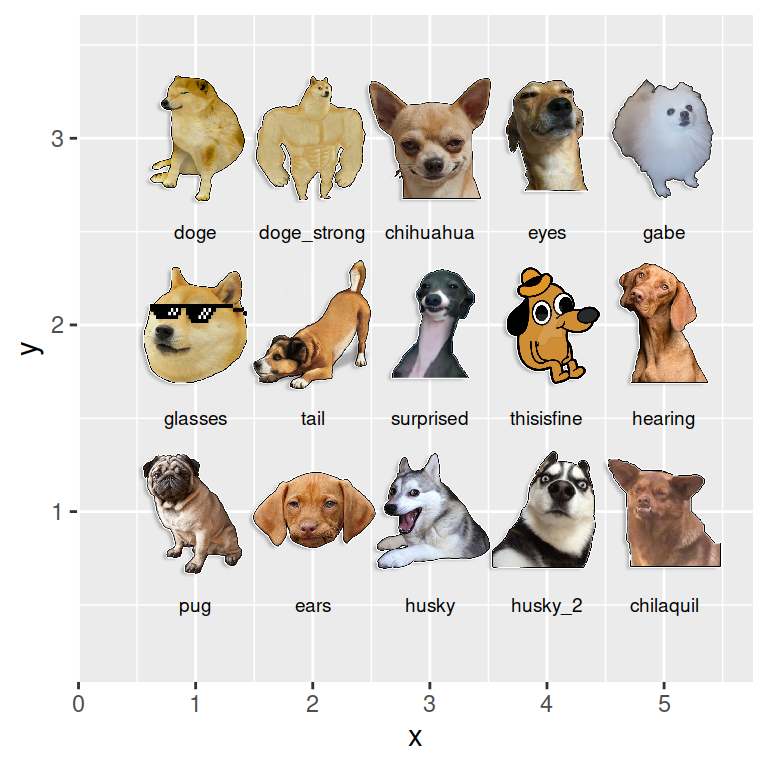
Creating a dog plot with geom_dog
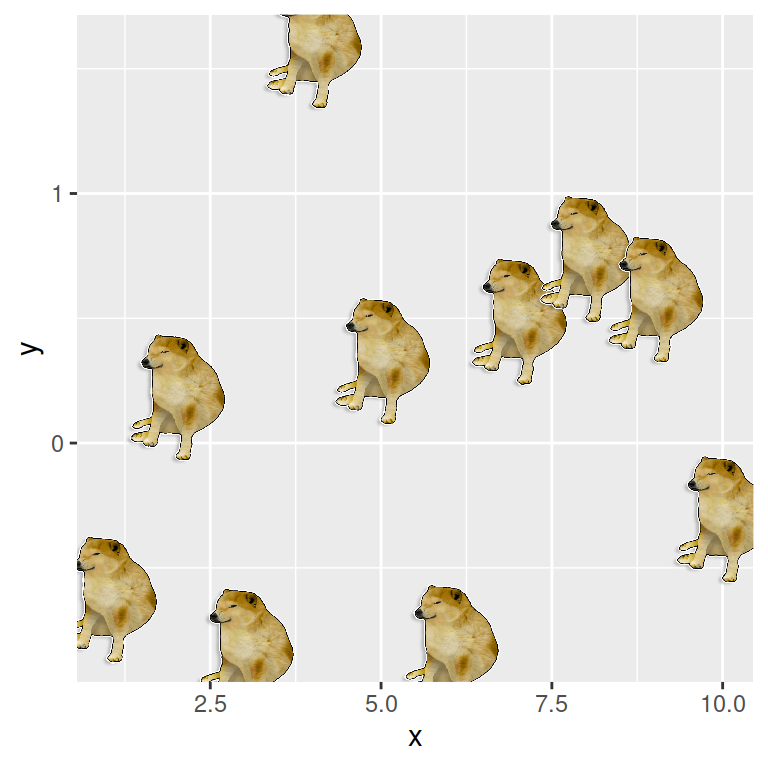
Given a data frame you can use the geom_dog function the same way as geom_point. The main difference is that you will see Doge dogs instead of points by default. Note that you can set the size of the dogs with the size argument of the function.
# install.packages("remotes")
# remotes::install_github("R-CoderDotCom/ggdogs@main")
library(ggdogs)
# install.packages("ggplot2")
library(ggplot2)
# Sample data
set.seed(1)
df <- data.frame(x = 1:10, y = rnorm(10))
# Plot
ggplot(df, aes(x = x, y = y)) +
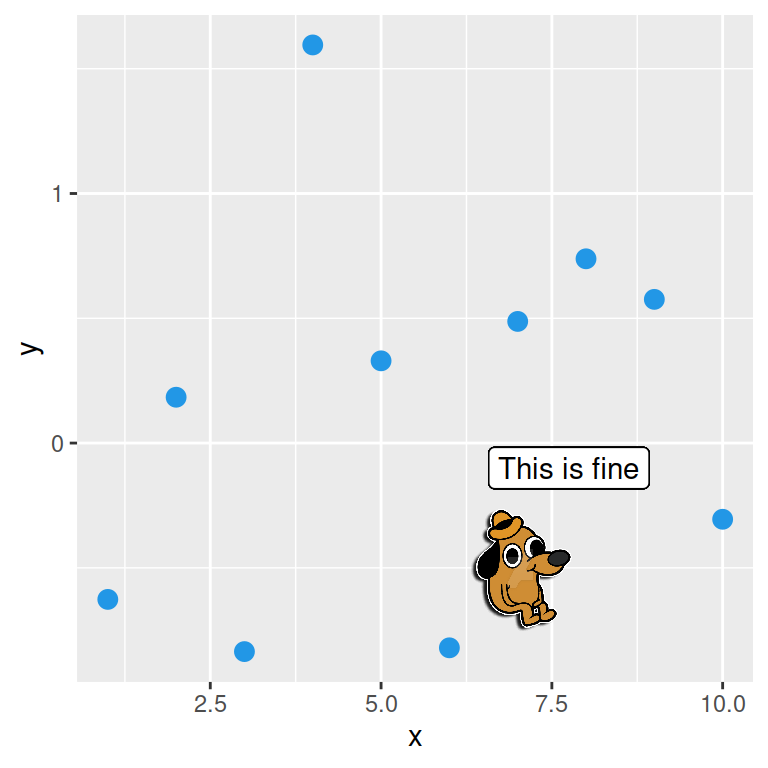
geom_dog(size = 5)You can also combine a regular plot with geom_dogs. In the following example we are creating a scatter plot with the image of a dog plus a text.
# install.packages("remotes")
# remotes::install_github("R-CoderDotCom/ggdogs@main")
library(ggdogs)
# install.packages("ggplot2")
library(ggplot2)
# Sample data
set.seed(1)
df <- data.frame(x = 1:10, y = rnorm(10))
# Plot
ggplot(df, aes(x = x, y = y)) +
geom_point(size = 3, color = 4) +
geom_dog(aes(x = 7, y = -0.5), dog = "thisisfine", size = 5) +
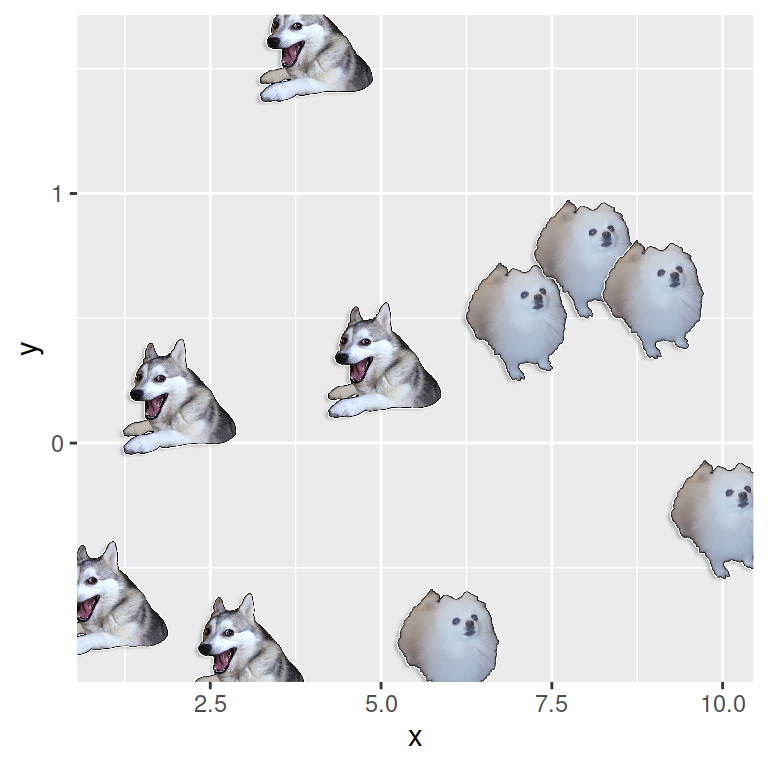
geom_label(aes(x = 7.75, y = -0.1, label = "This is fine"))Note that if your data frame contains a column with the name of a dog corresponding to each point you can pass that column to the dog argument to aes, so each point will have the corresponding dog.
# install.packages("remotes")
# remotes::install_github("R-CoderDotCom/ggdogs@main")
library(ggdogs)
# install.packages("ggplot2")
library(ggplot2)
# Sample data
set.seed(1)
df <- data.frame(x = 1:10, y = rnorm(10),
dog = c(rep("husky", 5),
rep("gabe", 5)))
# Plot
ggplot(df, aes(x = x, y = y, dog = dog)) +
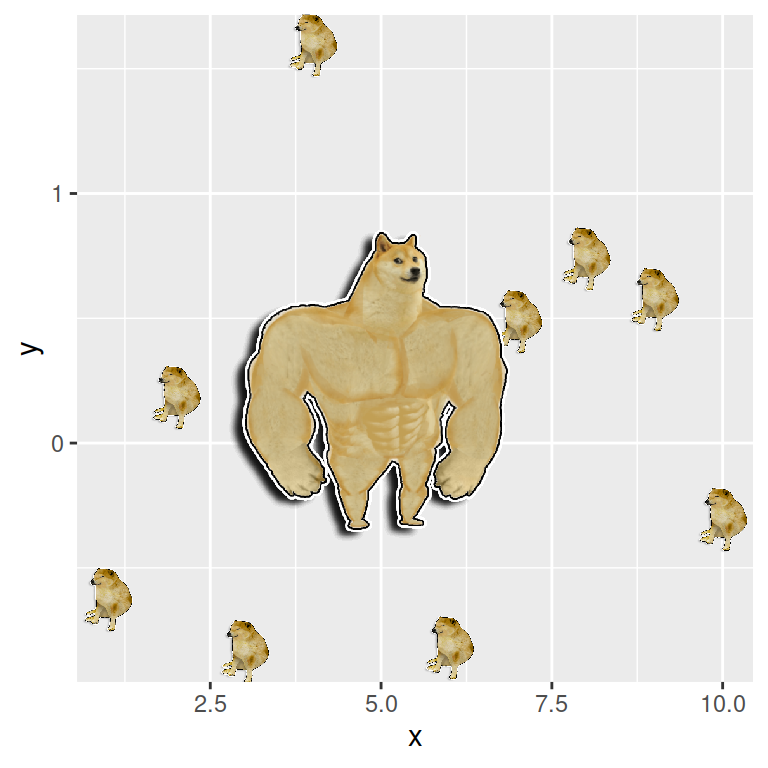
geom_dog(size = 5) Finally, here is another cool example made with ggdogs and some Doge dogs:
# install.packages("remotes")
# remotes::install_github("R-CoderDotCom/ggdogs@main")
library(ggdogs)
# install.packages("ggplot2")
library(ggplot2)

# Sample data
set.seed(1)
df <- data.frame(x = 1:10, y = rnorm(10),
                 dog = c(rep("husky", 5),
                         rep("gabe", 5)))

# Plot
ggplot(df, aes(x = x, y = y)) +
  geom_dog(size = 2.5) +
geom_dog(aes(x = 5, y = 0.25, dog = "doge_strong"), size = 12) 
Master Statistics
Learn statistics from the basics to advanced techniques, clearly explained
Go to site