Dartboard in R
The circlize package can be used to create art in R. In this tutorial we are going to create a dartboard step by step.
Outer circle
Load the library, create a list of 20 factors (as many as dartboard slices), specify the graphical parameters inside circos.par, initialize the plot and plot the circle.
library(circlize)

fcts <- 1:20

# Graphical parameters
circos.par("gap.degree" = 0, "cell.padding" = rep(0, 4),
           start.degree = 360/40, track.margin = c(0, 0),
           "clock.wise" = FALSE)

# Create the circle
circos.initialize(factors = fcts, xlim = c(0, 1))
circos.trackPlotRegion(ylim = c(0, 1),
                       factors = fcts, bg.col = 1,
                       track.height = 0.15)
Adding the numbers
You can add the numbers with circos.trackText function as follows.
# Adding the numbers
circos.trackText(rep(0.5, 20),
                 rep(0.5, 20),
                 rep(0.5, 20),
                 labels = c(13, 4, 18, 1, 20,
                            5, 12, 9, 14, 11,
                            8, 16, 7, 19, 3,
                            17, 2, 15, 10, 6),
                 factors = fcts,
                 col = "#EEEEEE",
                 font = 2,
                 facing = "downward")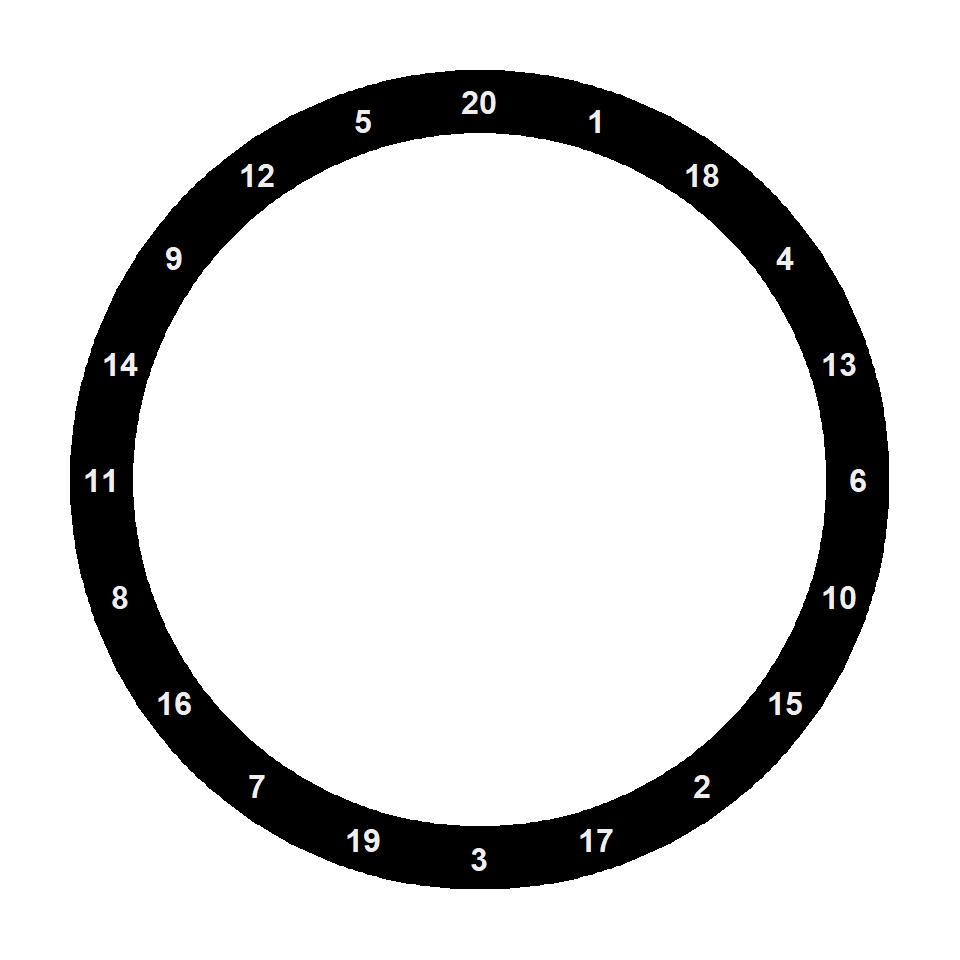
Adding the regions
Now you can plot the dartboard regions with circos.trackPlotRegion as shown in the code below.
# Double point
circos.trackPlotRegion(ylim = c(0, 1), factors = fcts,
          bg.col = rep(c("#df2623", "#11a551"), 10),
          bg.border = "#EEEEEE", track.height = 0.05)

# Region between double and triple point
circos.trackPlotRegion(ylim = c(0, 1), factors = fcts,
          bg.col = rep(c("black", "#e6cda5"), 10),
          bg.border = "#EEEEEE", track.height = 0.275)

# Triple point
circos.trackPlotRegion(ylim = c(0, 1), factors = fcts,
          bg.col = rep(c("#df2623", "#11a551"), 10),
          bg.border = "#EEEEEE", track.height = 0.05)

# Region between triple point and bullseye
circos.trackPlotRegion(ylim = c(0, 1), factors = fcts,
          bg.col = rep(c("black", "#e6cda5"), 10),
          bg.border = "#EEEEEE", track.height = 0.375)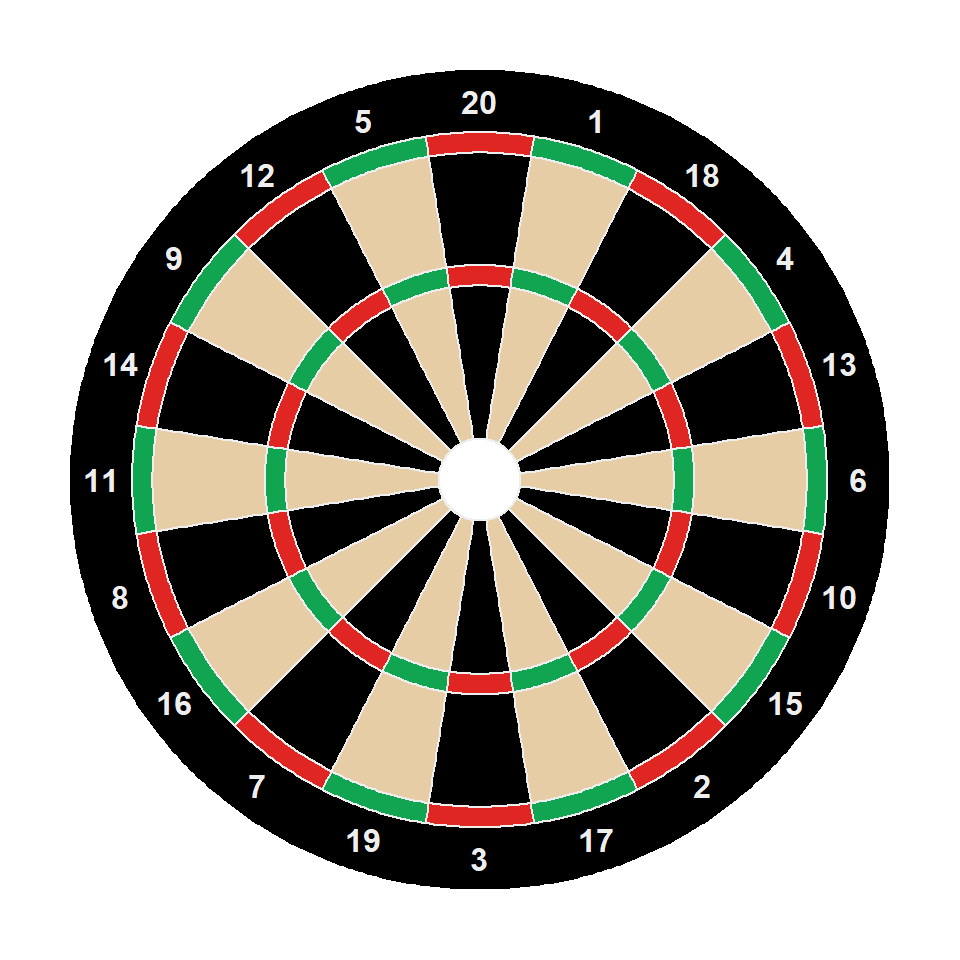
Bullseye
Finally, you can draw the bullseye with draw.sector function and clear the circlos data with circos.clear.
# 25 points
draw.sector(center = c(0, 0),
            start.degree = 0, end.degree = 360,
            rou1 = 0.1, col = "#11a551",
            border = "#EEEEEE")

# 50 points
draw.sector(center = c(0, 0),
            start.degree = 0, end.degree = 360,
            rou1 = 0.05, col = "#df2623",
            border = "#EEEEEE")

# Clear data
circos.clear()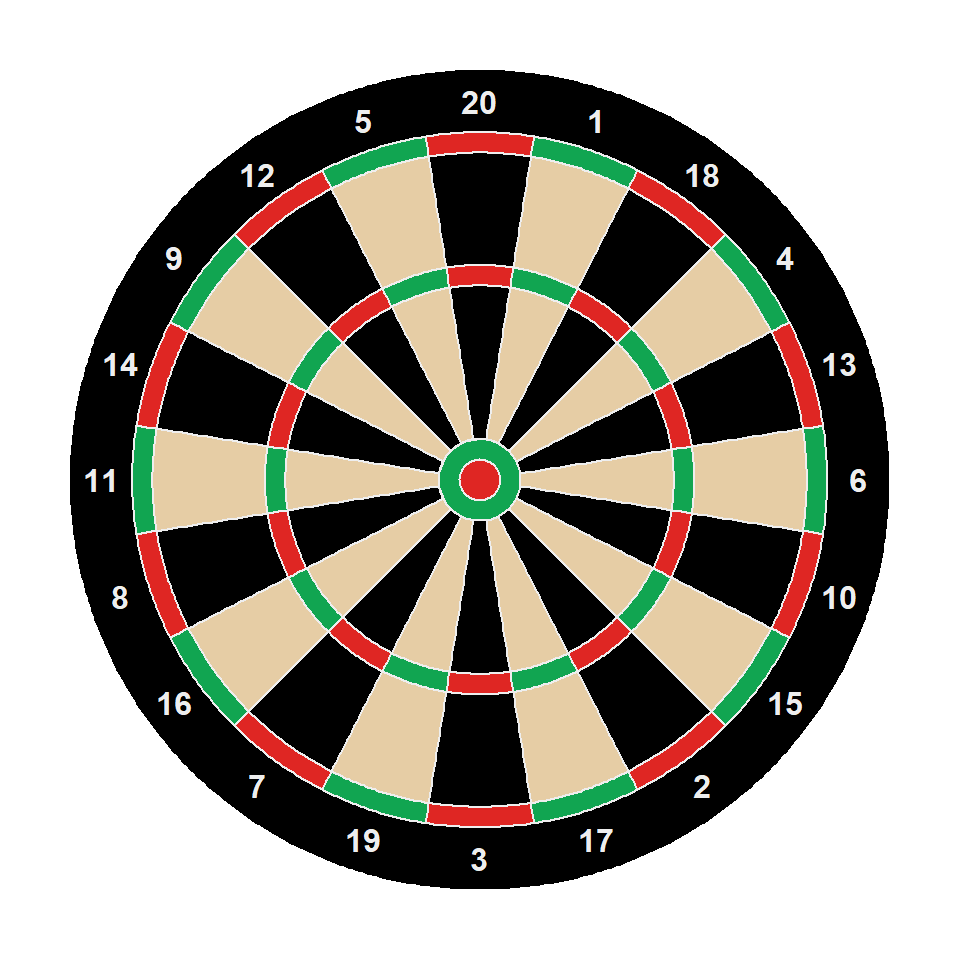
Full code
The full code of the blackboard and the final result is the following:
library(circlize)

fcts <- 1:20

# Graphical parameters
circos.par("gap.degree" = 0, "cell.padding" = c(0, 0, 0, 0),
           start.degree = 360/40, track.margin = c(0, 0), "clock.wise" = FALSE)

# Create the circle
circos.initialize(factors = fcts, xlim = c(0, 1))
circos.trackPlotRegion(ylim = c(0, 1), factors = fcts, bg.col = "black",
    track.height = 0.15)

# Adding the numbers
circos.trackText(rep(0.5, 20), rep(0.5, 20),  rep(0.5, 20),
    labels = c(13, 4, 18, 1, 20, 5, 12, 9, 14, 11, 8, 16, 7, 19, 3, 17, 2, 15, 10, 6),
    factors = fcts, col = "#EEEEEE", font = 2,
    facing = "downward")

# Double point
circos.trackPlotRegion(ylim = c(0, 1), factors = fcts,
    bg.col = rep(c("#df2623", "#11a551"), 10), bg.border = "#EEEEEE",
    track.height = 0.05)

# Region between double and triple point
circos.trackPlotRegion(ylim = c(0, 1), factors = fcts,
    bg.col = rep(c("black", "#e6cda5"), 10), bg.border = "#EEEEEE",
    track.height = 0.275)

# Triple point
circos.trackPlotRegion(ylim = c(0, 1), factors = fcts,
    bg.col = rep(c("#df2623", "#11a551"), 10), bg.border = "#EEEEEE",
    track.height = 0.05)

# Region between triple point and bullseye
circos.trackPlotRegion(ylim = c(0, 1), factors = fcts,
    bg.col = rep(c("black", "#e6cda5"), 10), bg.border = "#EEEEEE",
    track.height = 0.375)

# 25 points
draw.sector(center = c(0, 0), start.degree = 0, end.degree = 360,
    rou1 = 0.1, col = "#11a551", border = "#EEEEEE")

# 50 points
draw.sector(center = c(0, 0), start.degree = 0, end.degree = 360,
    rou1 = 0.05, col = "#df2623", border = "#EEEEEE")

# Clear data
circos.clear()

Master Statistics
Learn statistics from the basics to advanced techniques, clearly explained
Go to site