Sample plots
The following four plots will be used throughout this tutorial. Save them as objects so patchwork can combine them.
# install.packages("ggplot2")
library(ggplot2)

set.seed(5)
x <- runif(100)
df <- data.frame(x = seq_along(x), y = x)

p1 <- ggplot(df, aes(x = "", y = y)) +
  geom_boxplot()

p2 <- ggplot(df, aes(y = y)) +
  geom_histogram(bins = 15)

p3 <- ggplot(df, aes(x = x, y = y)) +
  geom_line()

p4 <- ggplot(df, aes(x = x, y = y)) +
  geom_point()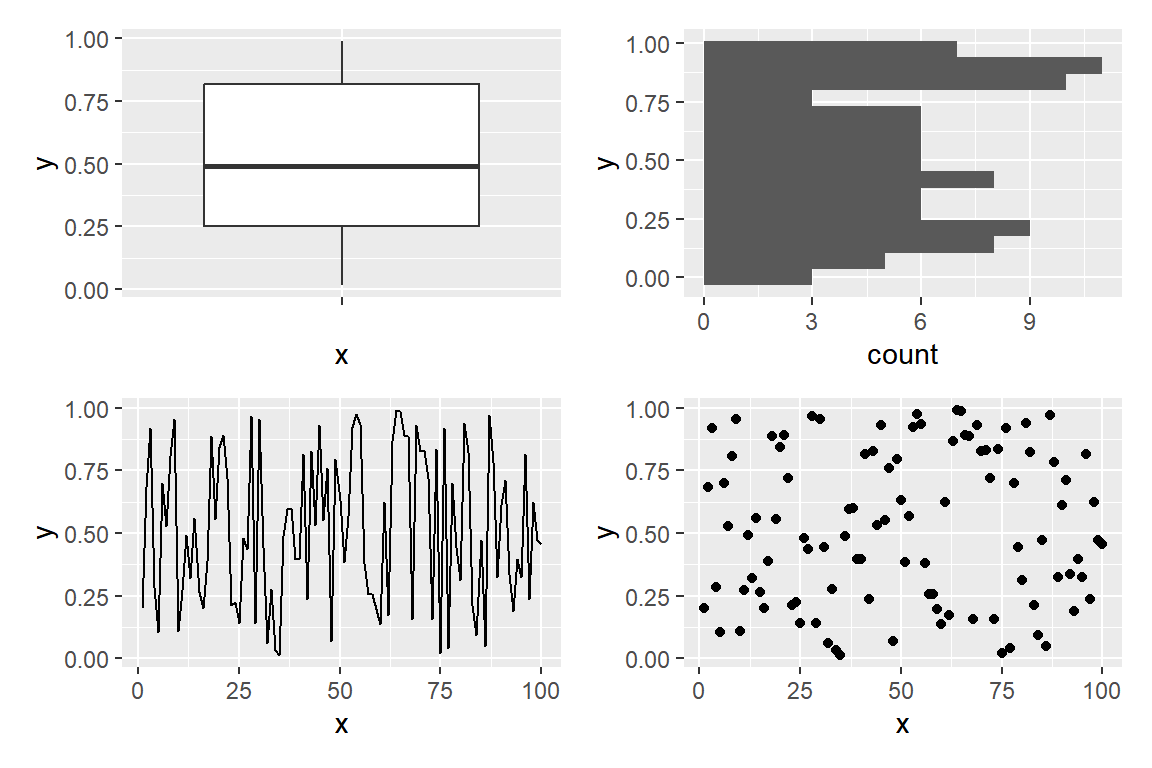
Operators
Load patchwork and use the + operator to place plots side by side. With two plots the result is identical to |, but with more plots + tries to create a square layout.
# install.packages("patchwork")
library(patchwork)

p1 + p2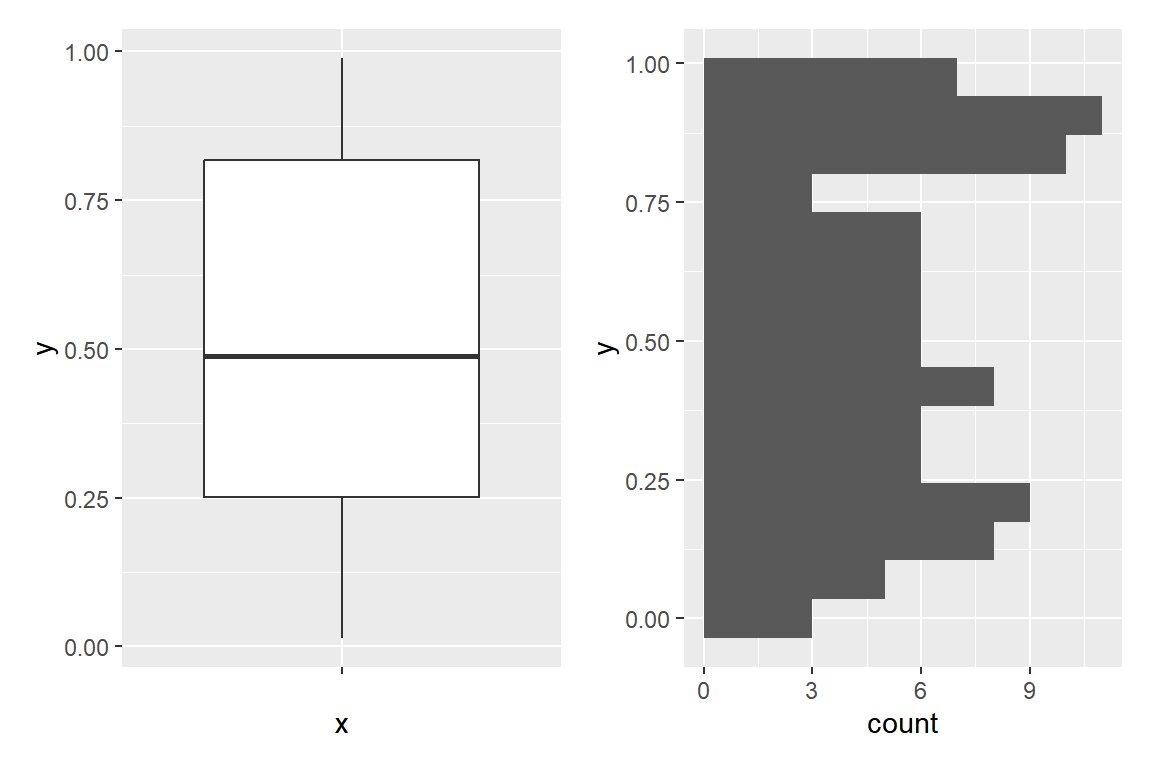
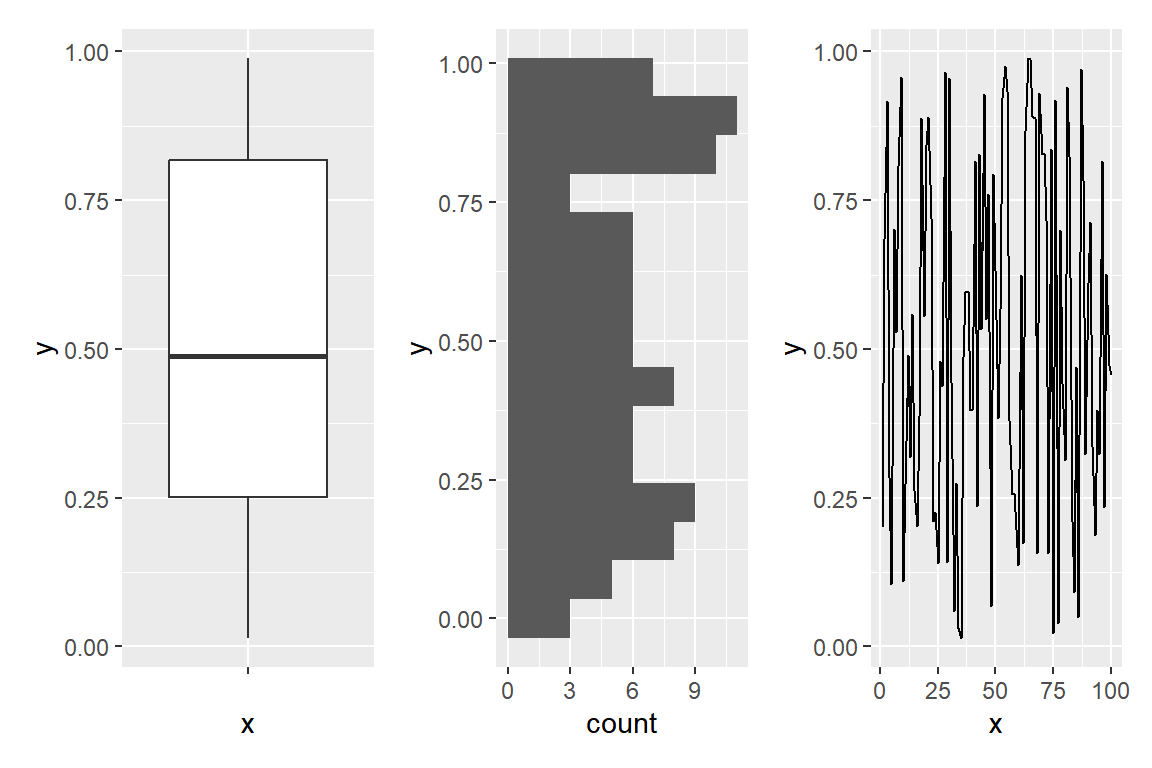
| forces a single row, regardless of the number of plots.
# install.packages("patchwork")
library(patchwork)

p1 | p2 | p3
/ stacks plots in a single column.
# install.packages("patchwork")
library(patchwork)

p1 / p2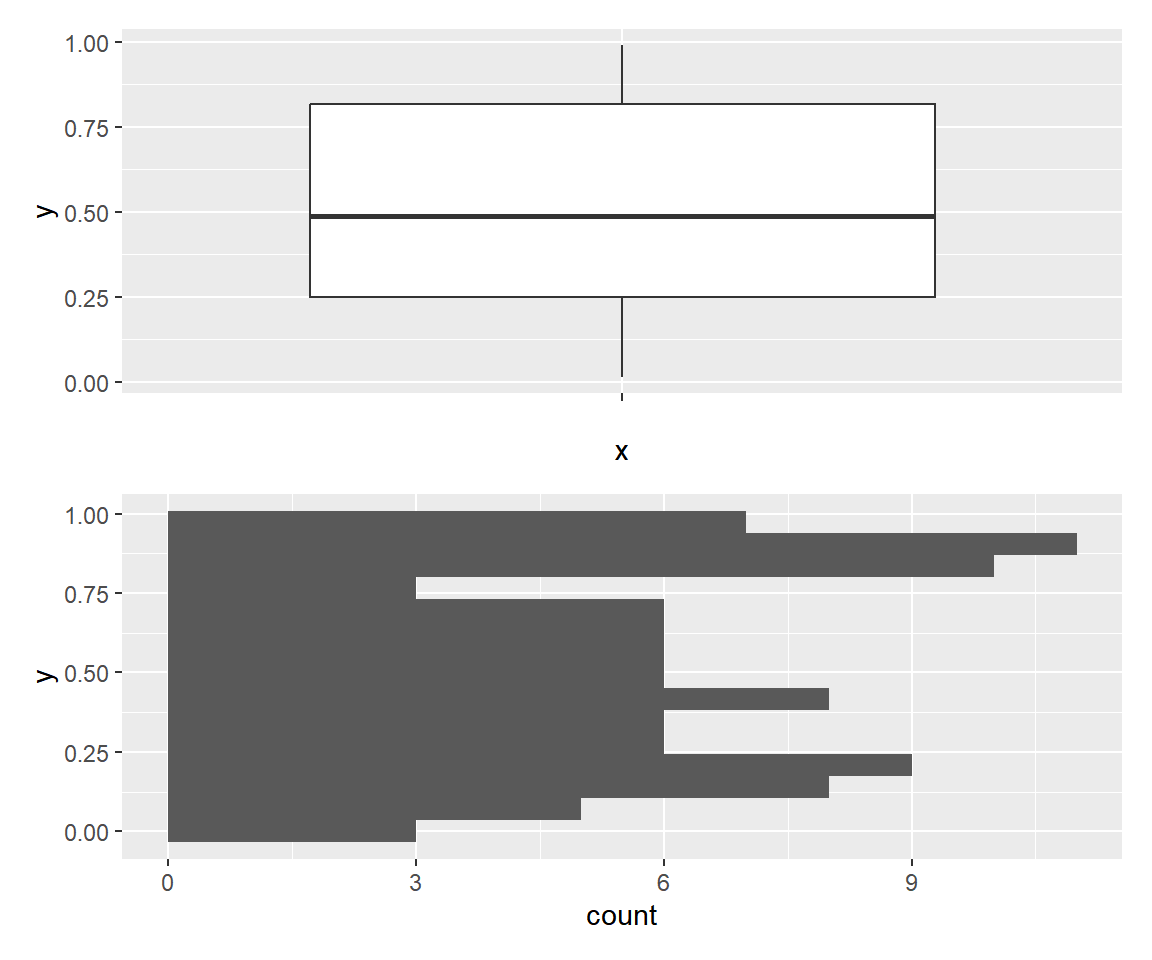
Nesting operators
Operators can be nested with parentheses to create complex layouts without any extra function calls.
# install.packages("patchwork")
library(patchwork)

(p1 | p2) / p3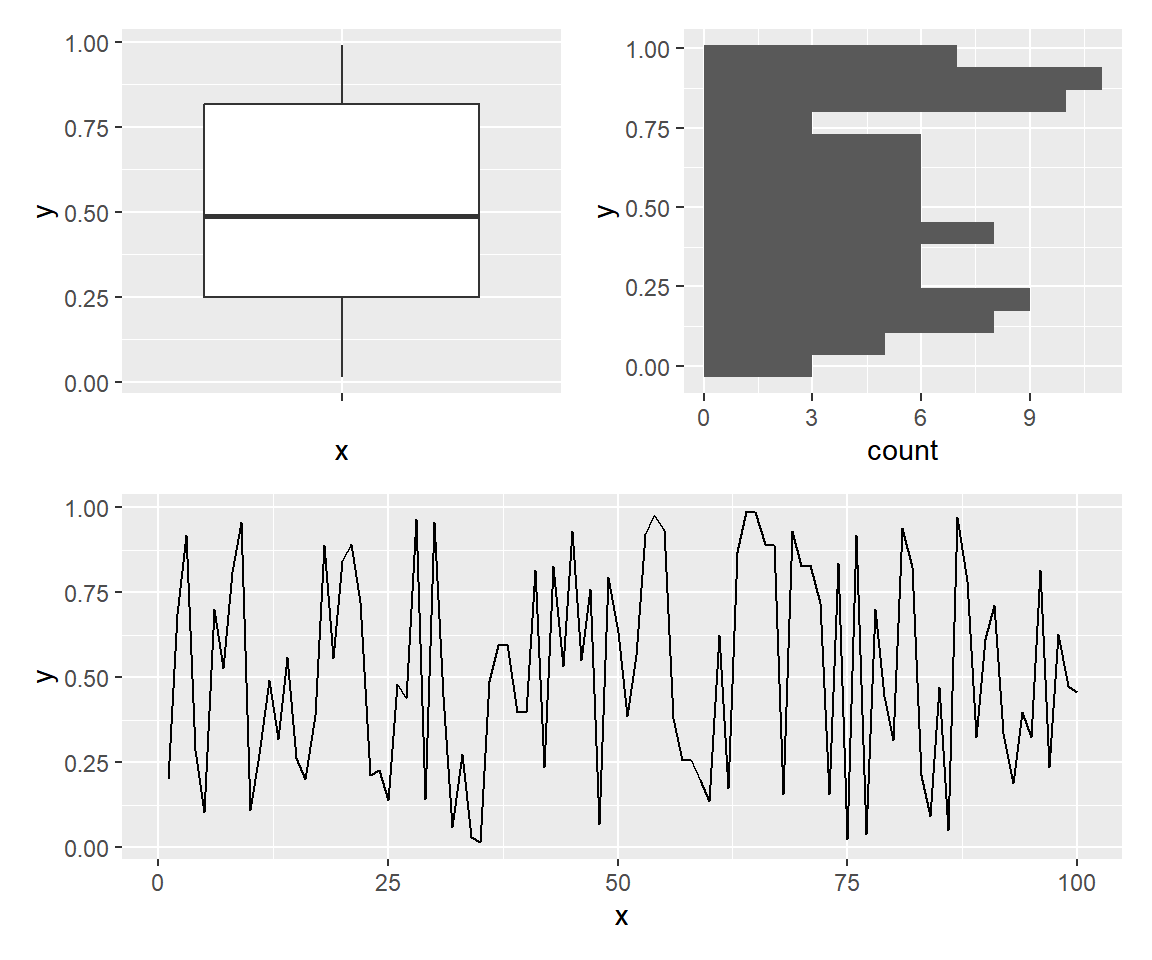
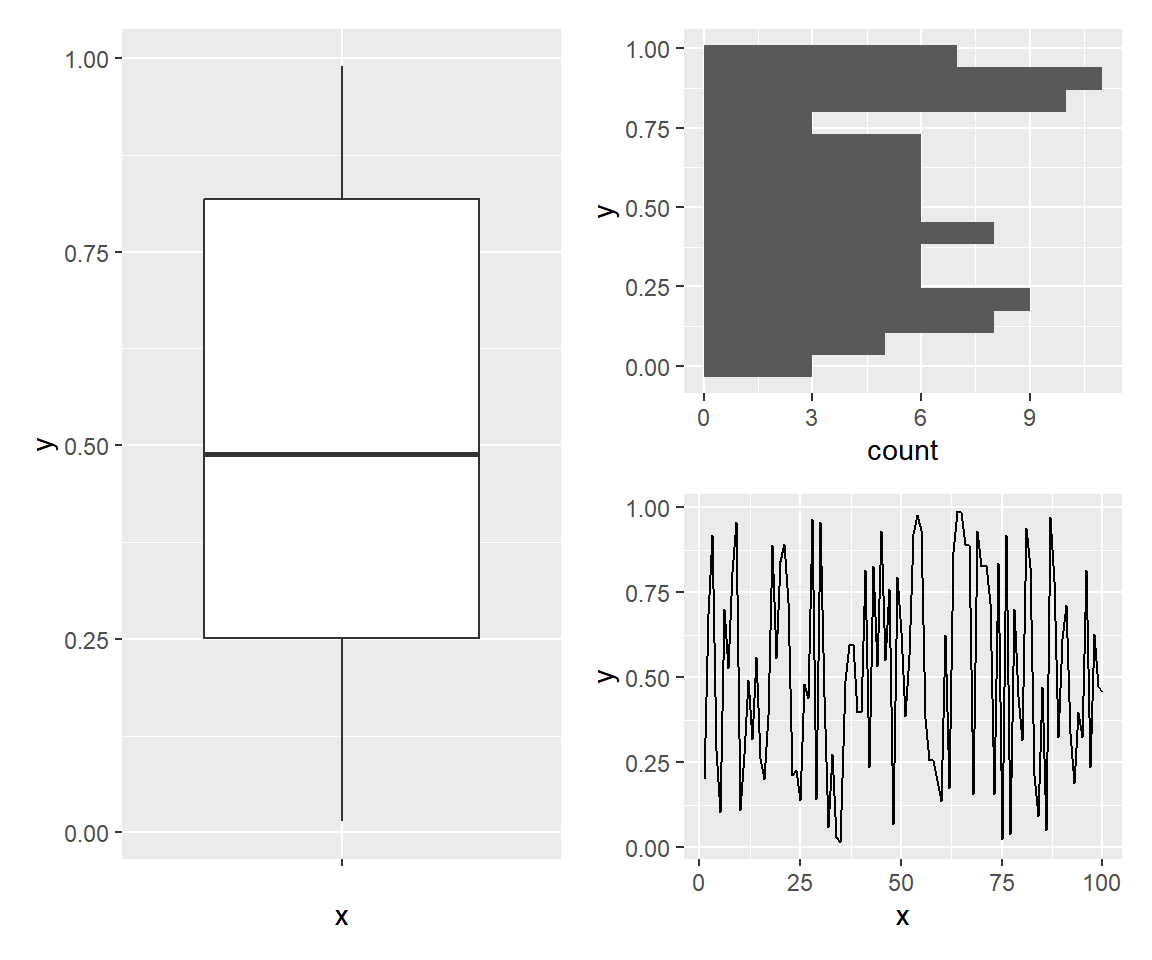
One plot at the left, two stacked at the right.
# install.packages("patchwork")
library(patchwork)

p1 | (p2 / p3)
plot_layout()
plot_layout() controls the number of rows and columns, and the relative sizes of each plot with widths and heights.
# install.packages("patchwork")
library(patchwork)

p1 + p2 + p3 + p4 +
  plot_layout(ncol = 3, widths = c(1, 1, 2))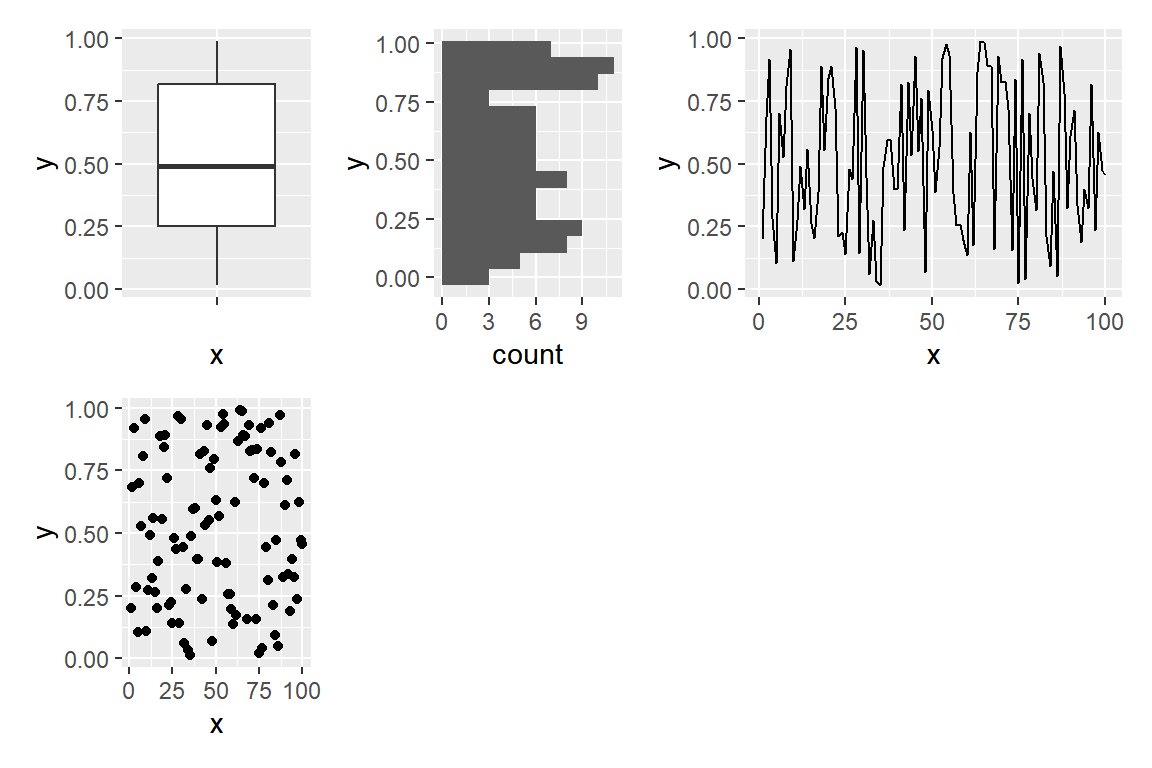
Custom design
Pass a string to design where each character is a plot number and # is an empty area. This gives you full control over the layout.
# install.packages("patchwork")
library(patchwork)

design <- "
  111
  2#3
  443
"

p1 + p2 + p3 + p4 +
  plot_layout(design = design)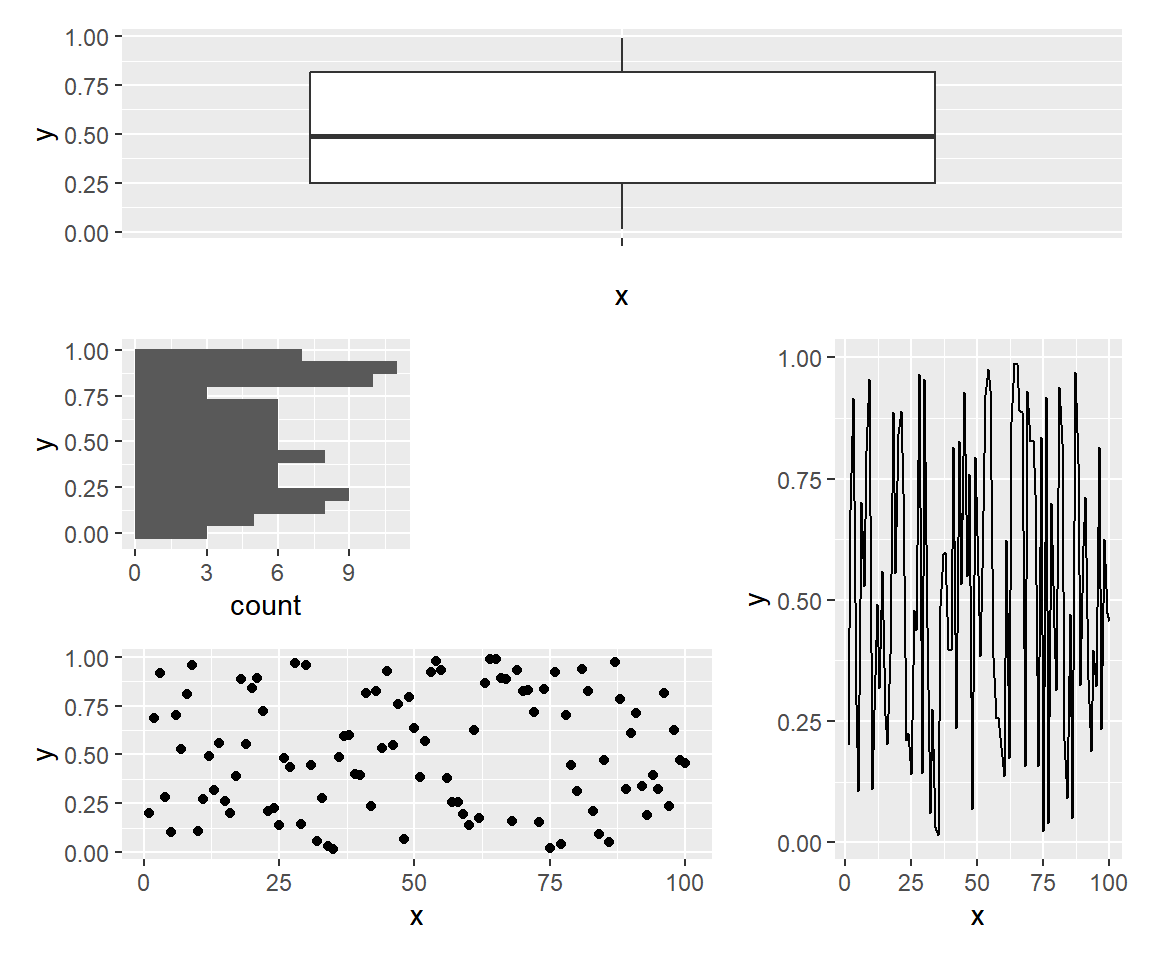
Shared legend
When plots share the same legend, pass guides = "collect" to plot_layout() to merge them into a single legend for the whole figure.
# install.packages("patchwork")
library(patchwork)

set.seed(1)
df2 <- data.frame(x = 1:50, y = rnorm(50),
                  g = rep(c("A", "B"), 25))

pa <- ggplot(df2, aes(x, y, color = g)) + geom_point()
pb <- ggplot(df2, aes(x, y, color = g)) + geom_line()

pa + pb +
  plot_layout(guides = "collect")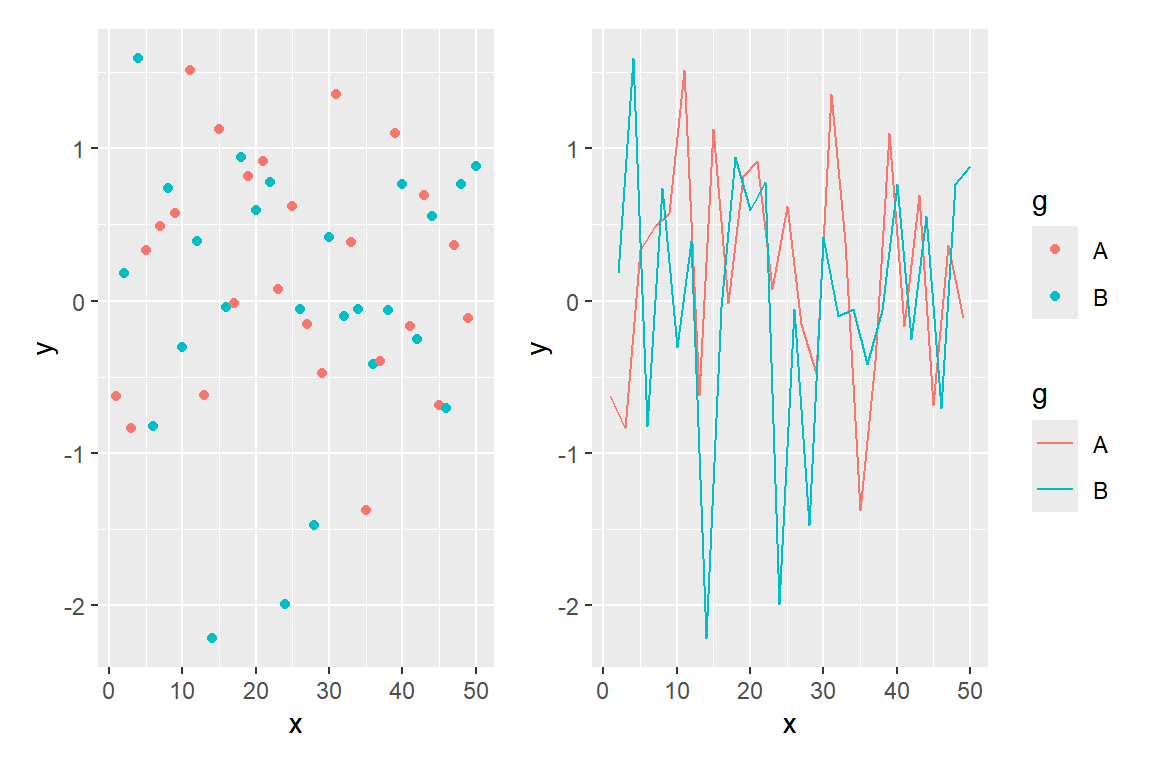
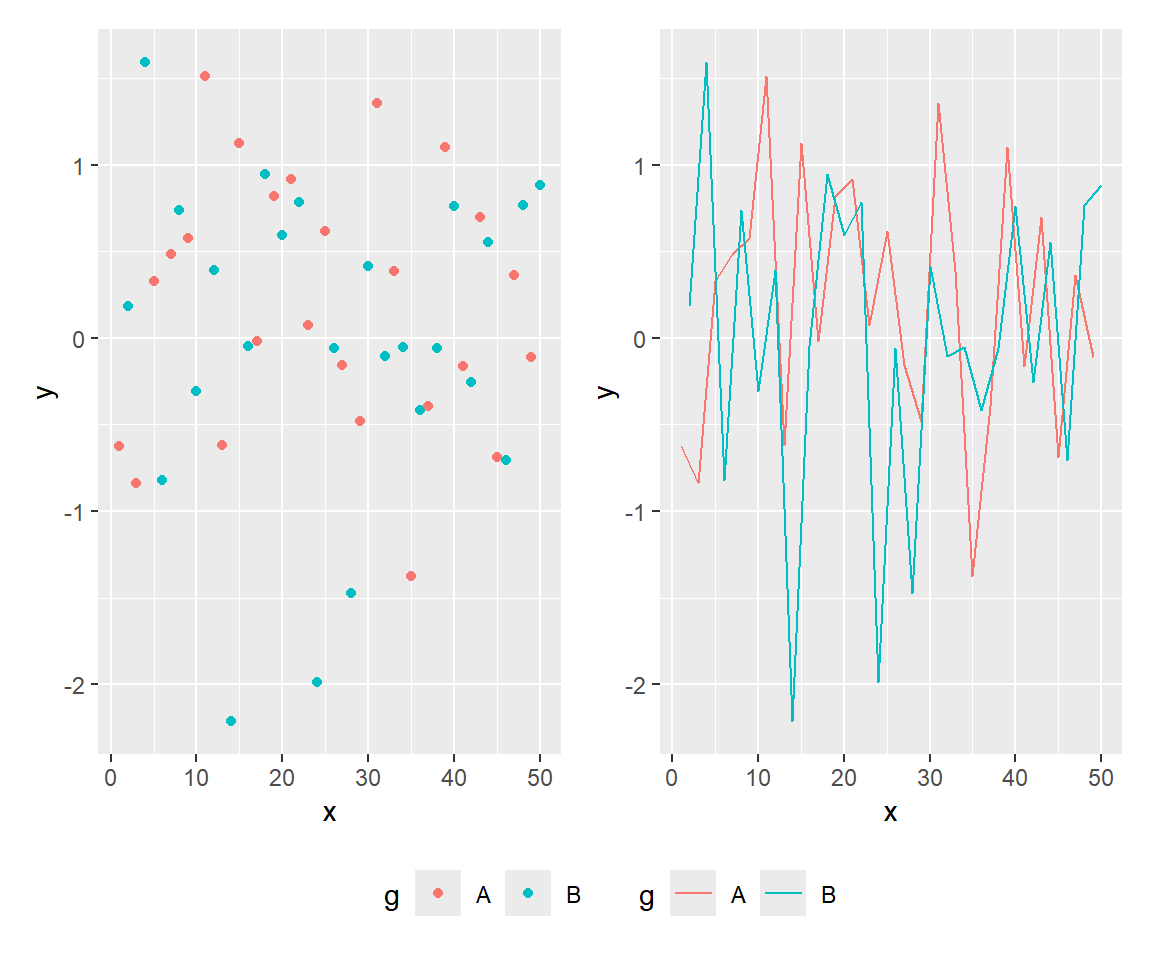
Changing the legend position
Use the & operator to apply theme() to all plots at the same time. This lets you move the collected legend to any side.
# install.packages("patchwork")
library(patchwork)

set.seed(1)
df2 <- data.frame(x = 1:50, y = rnorm(50),
                  g = rep(c("A", "B"), 25))

pa <- ggplot(df2, aes(x, y, color = g)) + geom_point()
pb <- ggplot(df2, aes(x, y, color = g)) + geom_line()

pa + pb +
  plot_layout(guides = "collect") &
  theme(legend.position = "bottom")
plot_annotation()
Add a title, subtitle and caption for the whole figure with plot_annotation().
# install.packages("patchwork")
library(patchwork)

p1 + p2 +
  plot_annotation(
    title = "Figure title",
    subtitle = "Subtitle",
    caption = "Caption")
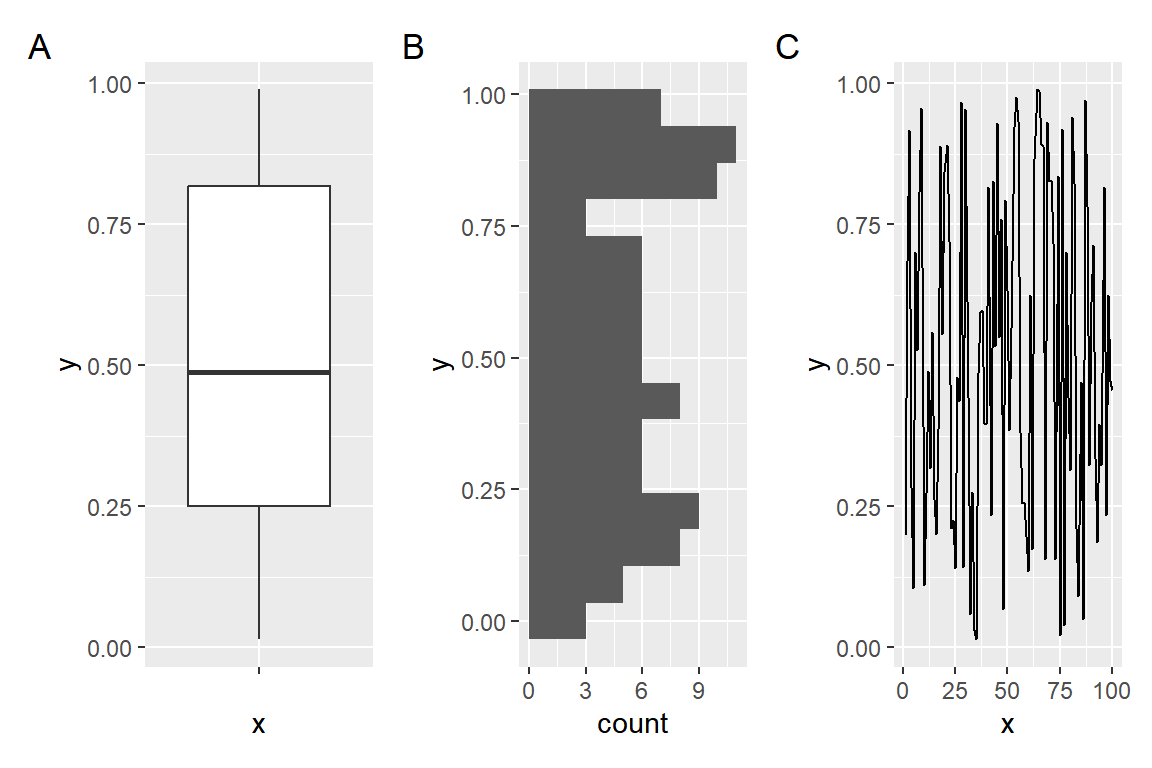
Automatic plot labels
tag_levels adds a label to each panel automatically. Options are "1", "a", "A", "i" or "I" for Roman numerals.
# install.packages("patchwork")
library(patchwork)

p1 + p2 + p3 +
  plot_annotation(tag_levels = "A")
& operator
The & operator applies a layer to all plots at once. Use it to set the same theme, color scale or any other layer across the whole figure.
# install.packages("patchwork")
library(patchwork)

p1 + p2 + p3 + p4 & theme_minimal()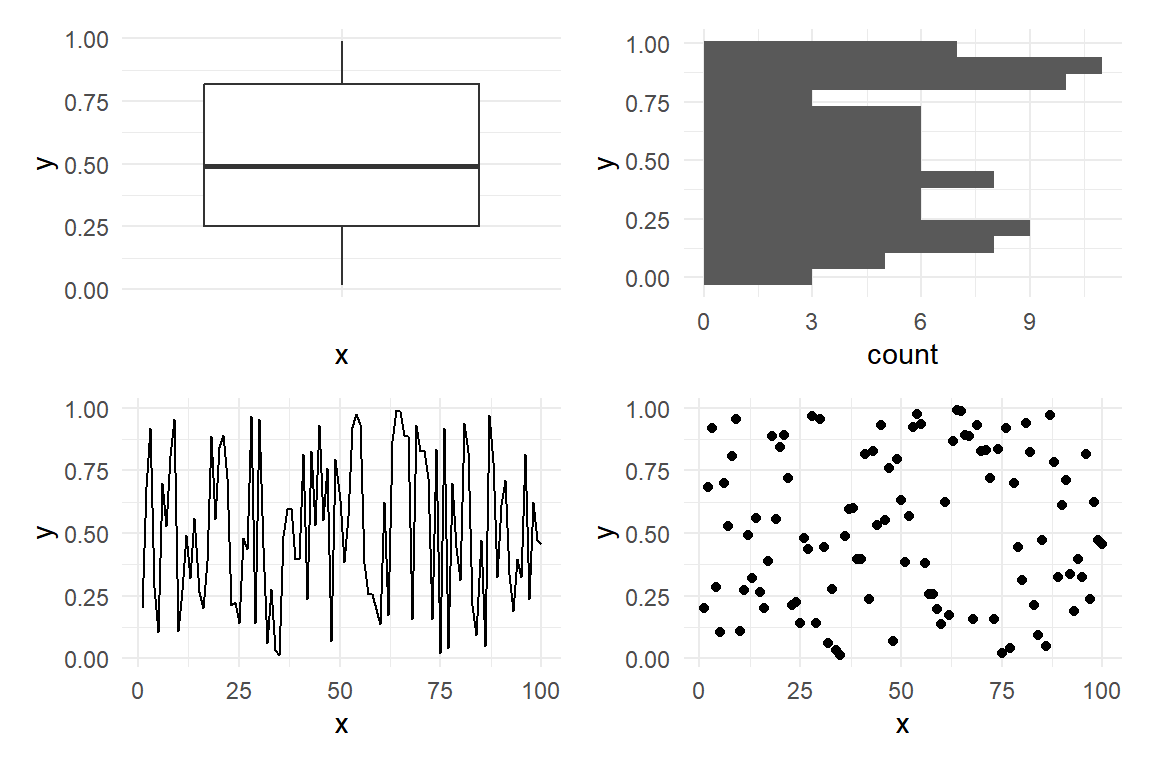
inset_element()
inset_element() places a plot on top of another at any position. The left, bottom, right and top arguments set the location as fractions of the parent plot area (0 to 1).
# install.packages("patchwork")
library(patchwork)

p3 + inset_element(p1,
                   left = 0.6,
                   bottom = 0.6,
                   right = 1,
                   top = 1)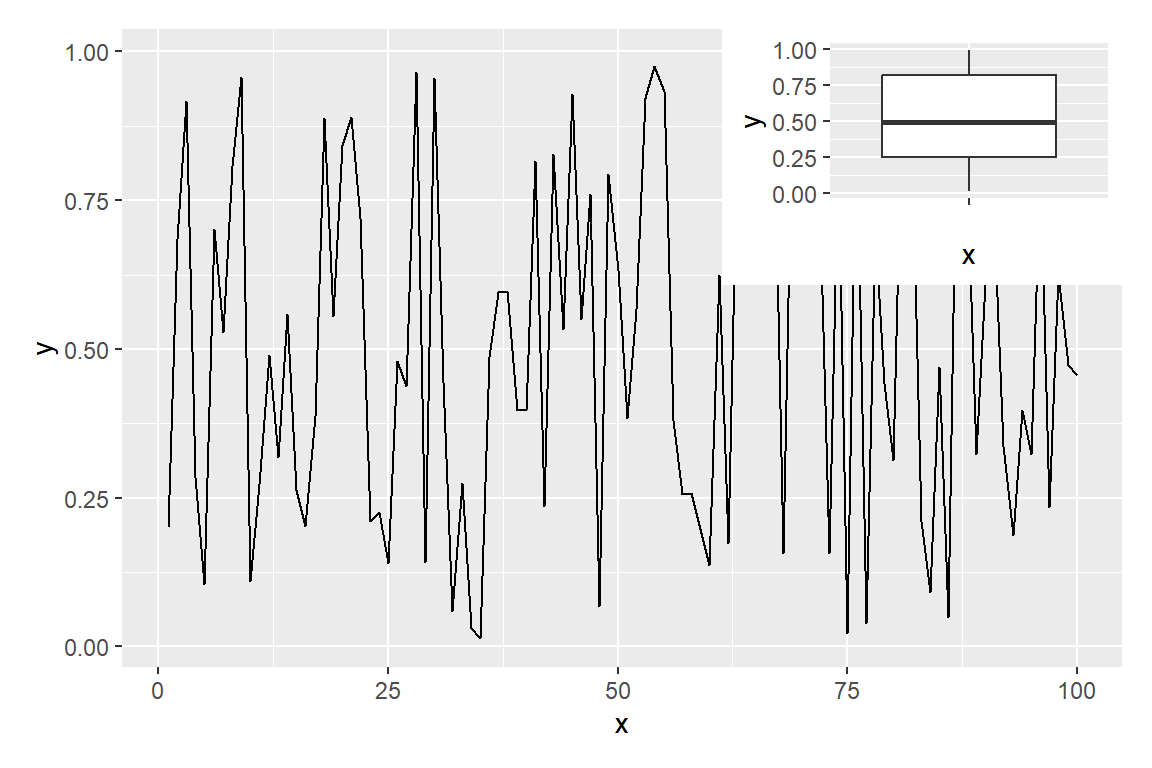
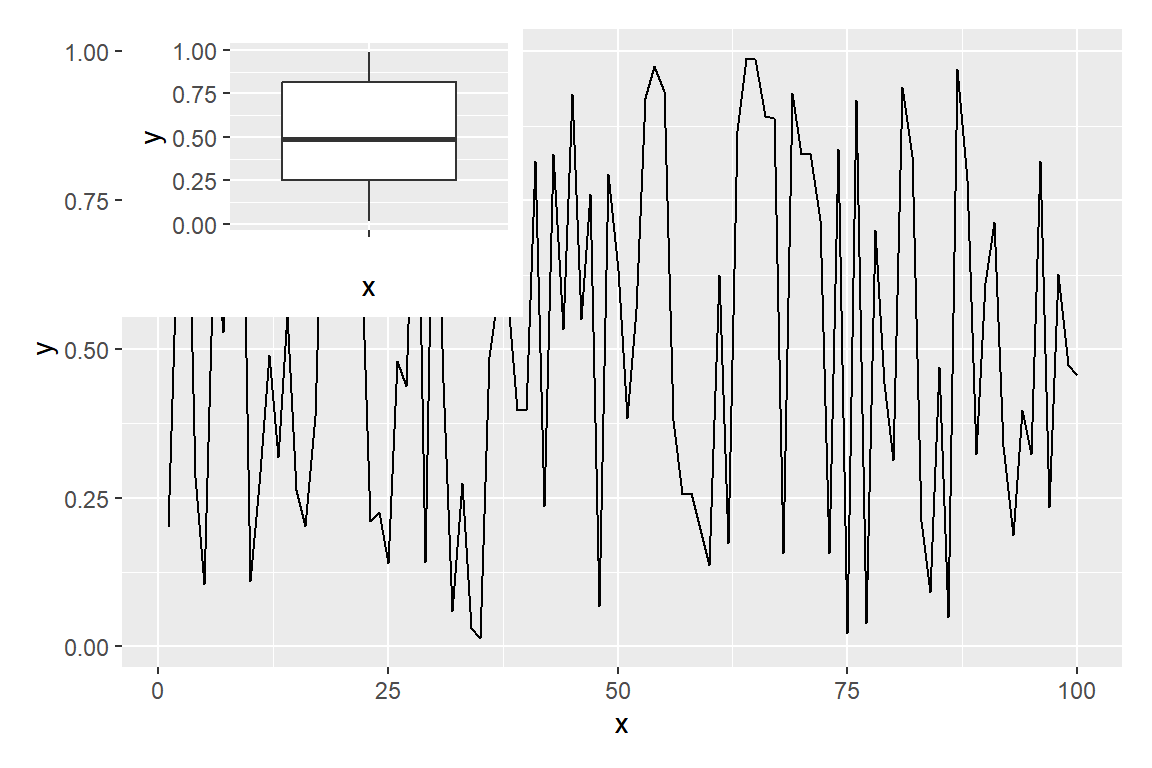
align_to
By default coordinates are relative to the full plot area including margins. Set align_to = "panel" to position the inset relative to the inner panel area instead.
# install.packages("patchwork")
library(patchwork)

p3 + inset_element(p1,
                   left = 0,
                   bottom = 0.55,
                   right = 0.4,
                   top = 1,
                   align_to = "panel")
Master Statistics
Learn statistics from the basics to advanced techniques, clearly explained
Go to site