Sample data
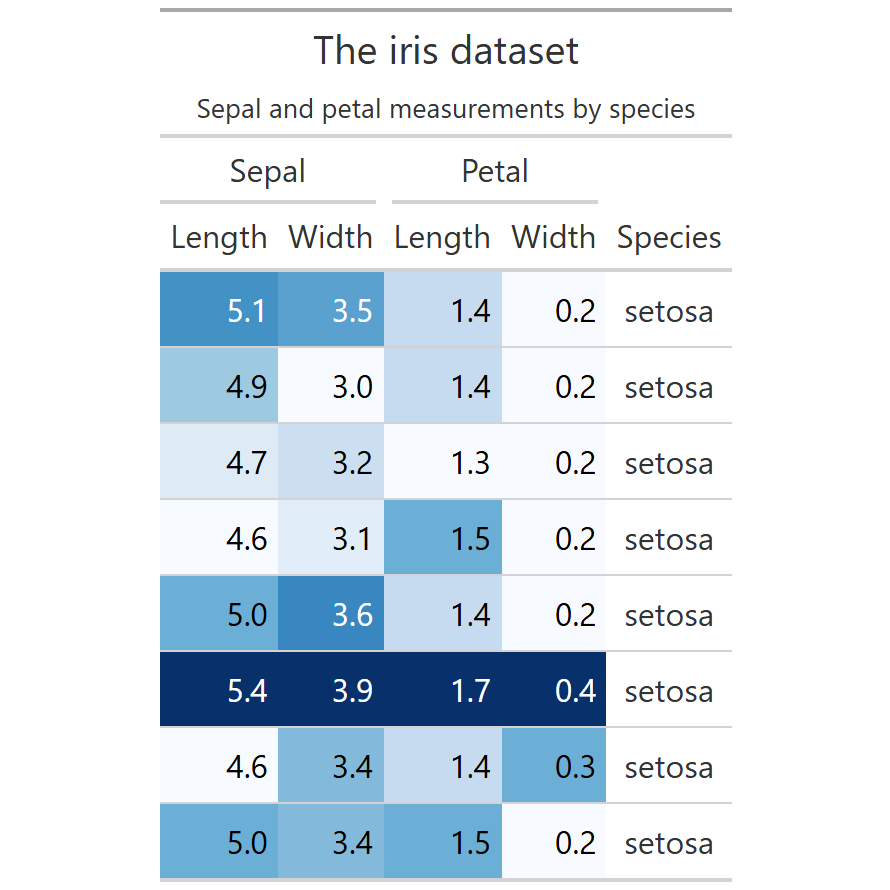
reactable turns a data frame into a fully interactive HTML table with sorting, searching and pagination. Columns are sortable on click by default. We will use the iris dataset throughout.
# install.packages("reactable")
library(reactable)

head(iris, 6)
Searching and filtering
searchable = TRUE adds a global search box above the table. filterable = TRUE adds a per-column filter input under each header. defaultPageSize controls how many rows appear per page.
# install.packages("reactable")
library(reactable)

reactable(iris,
          searchable      = TRUE,
          filterable      = TRUE,
          defaultPageSize = 5)
colDef()
Pass a named list to columns with colDef() to configure each column: rename with name, set alignment with align, and format numbers or dates with colFormat().
# install.packages("reactable")
library(reactable)

reactable(
  head(iris, 10),
  columns = list(
    Sepal.Length = colDef(name   = "Sepal Length",
                          format = colFormat(digits = 1)),
    Sepal.Width  = colDef(name   = "Sepal Width",
                          align  = "left")
  )
)
Cell colors
The style argument in colDef() accepts a function that receives the cell value and returns a named list of CSS properties. Use it for conditional background colors, font weights, or any inline style.
# install.packages("reactable")
library(reactable)

reactable(
  head(iris, 8),
  columns = list(
    Sepal.Length = colDef(
      style = function(value) {
        bg <- if (value >= 5.5) "#cfe2ff" else "#f8d7da"
        list(background = bg)
      }
    )
  )
)
groupBy and aggregation
groupBy collapses rows into expandable groups. Combine it with aggregate in colDef() to show a summary value (mean, sum, count…) for each group. Use defaultColDef to apply the same aggregation to all columns at once.
# install.packages("reactable")
library(reactable)

reactable(
  iris,
  groupBy       = "Species",
  defaultColDef = colDef(
    aggregate = "mean",
    format    = colFormat(digits = 2)
  )
)
Inline bar charts
The cell argument in colDef() accepts a function that receives the value and returns any HTML via htmltools. Use it to embed inline bar charts, icons, badges or any custom component inside a cell.
# install.packages("reactable")
library(reactable)
library(htmltools)

reactable(
  head(iris, 10),
  columns = list(
    Sepal.Length = colDef(
      cell = function(value) {
        pct <- round(value / max(iris$Sepal.Length) * 100)
        bar <- tags$div(style = paste0(
          "background:#4472C4; width:", pct,
          "%; height:14px; border-radius:3px;"
        ))
        tags$div(
          style = "display:flex; align-items:center; gap:6px;",
          bar, tags$span(value)
        )
      }
    )
  )
)
Expandable rows
Pass a function to details that receives the row index and returns any HTML. A toggle arrow appears automatically on each row to reveal the expanded content.
# install.packages("reactable")
library(reactable)

reactable(
  head(iris, 8),
  details = function(index) {
    row <- head(iris, 8)[index, ]
    tags$div(
      style = "padding: 6px 16px;",
      paste0("Sepal ratio: ", round(row$Sepal.Length / row$Sepal.Width, 2),
             "  |  Petal ratio: ", round(row$Petal.Length / row$Petal.Width, 2))
    )
  }
)
Master Statistics
Learn statistics from the basics to advanced techniques, clearly explained
Go to site