R CHARTS
Titles
Texts
Lines
Axes
Legend
Other
Quick guides
See all base R charts
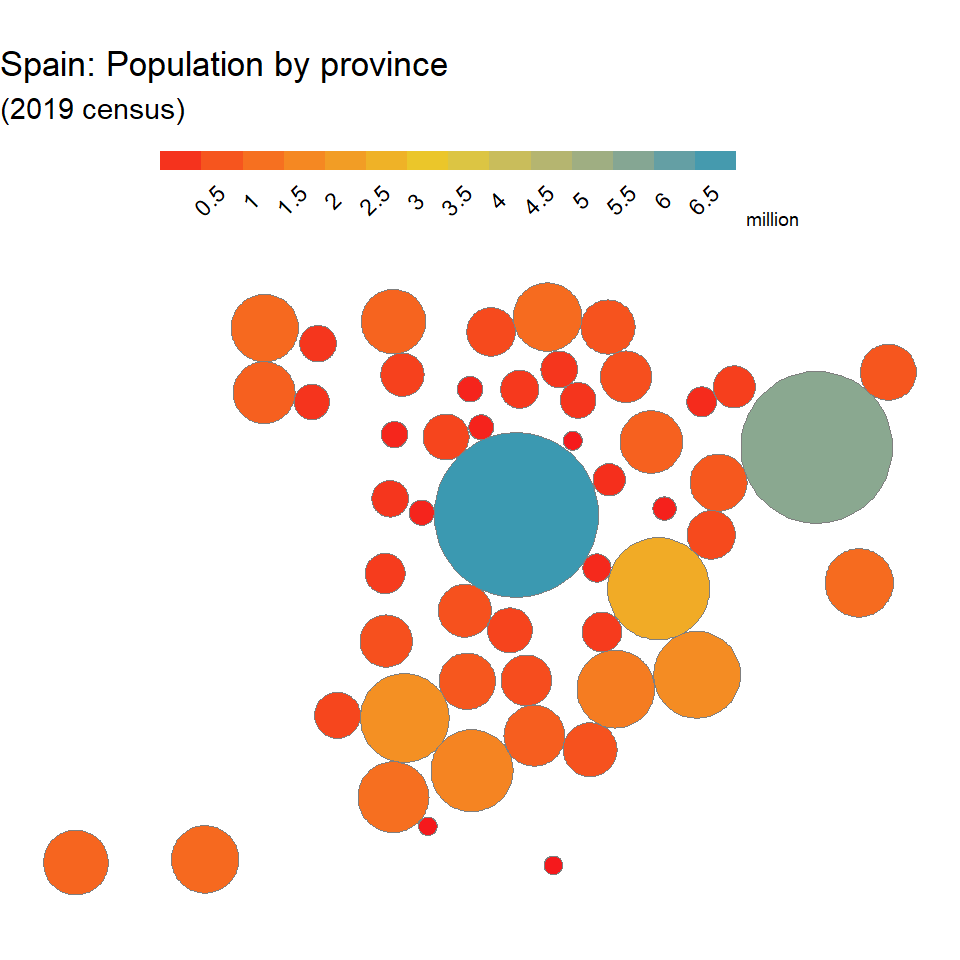
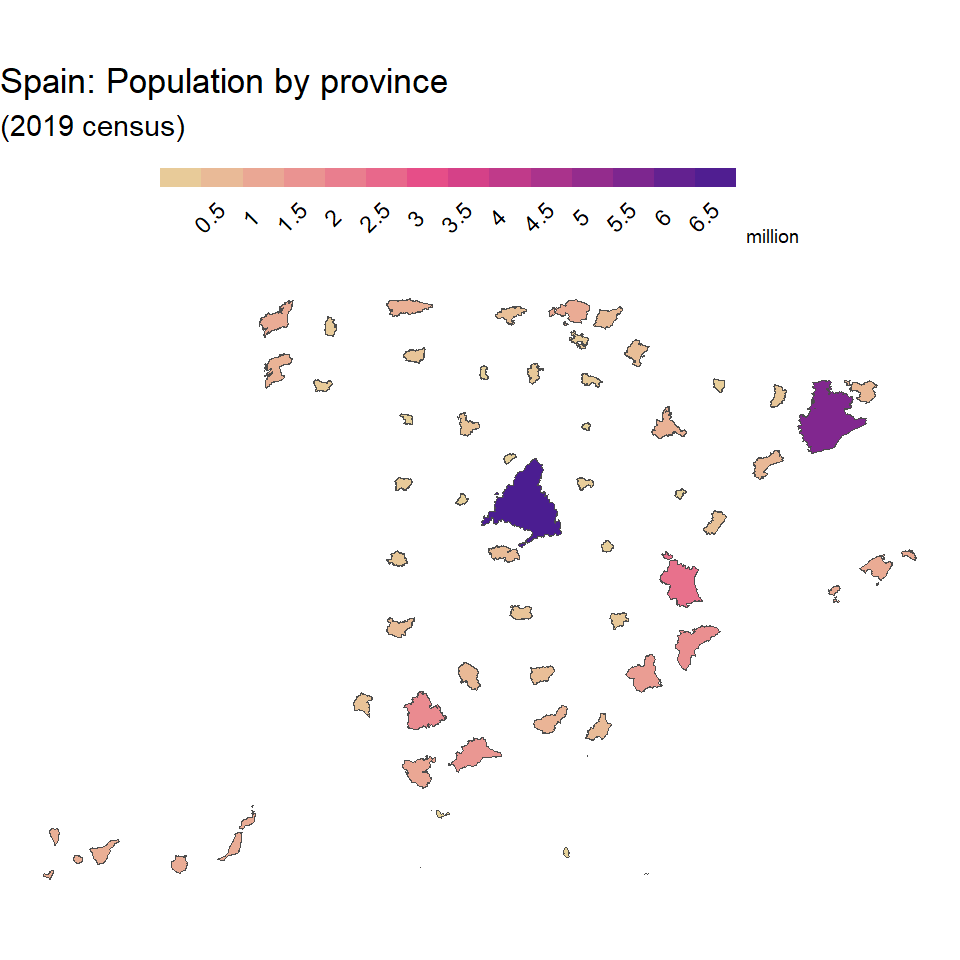
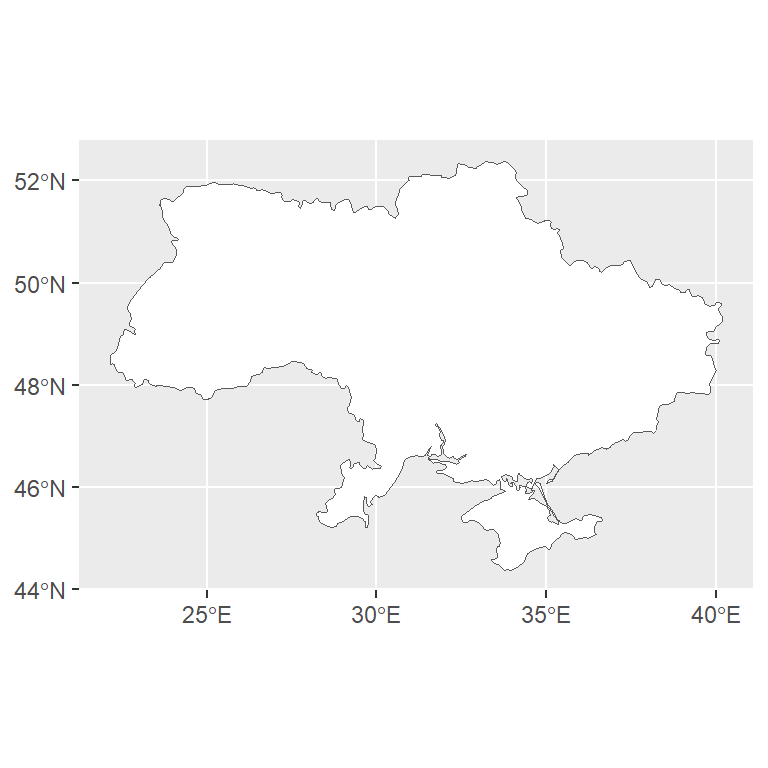
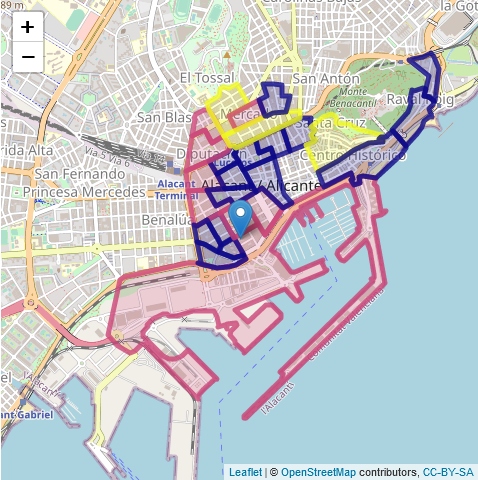
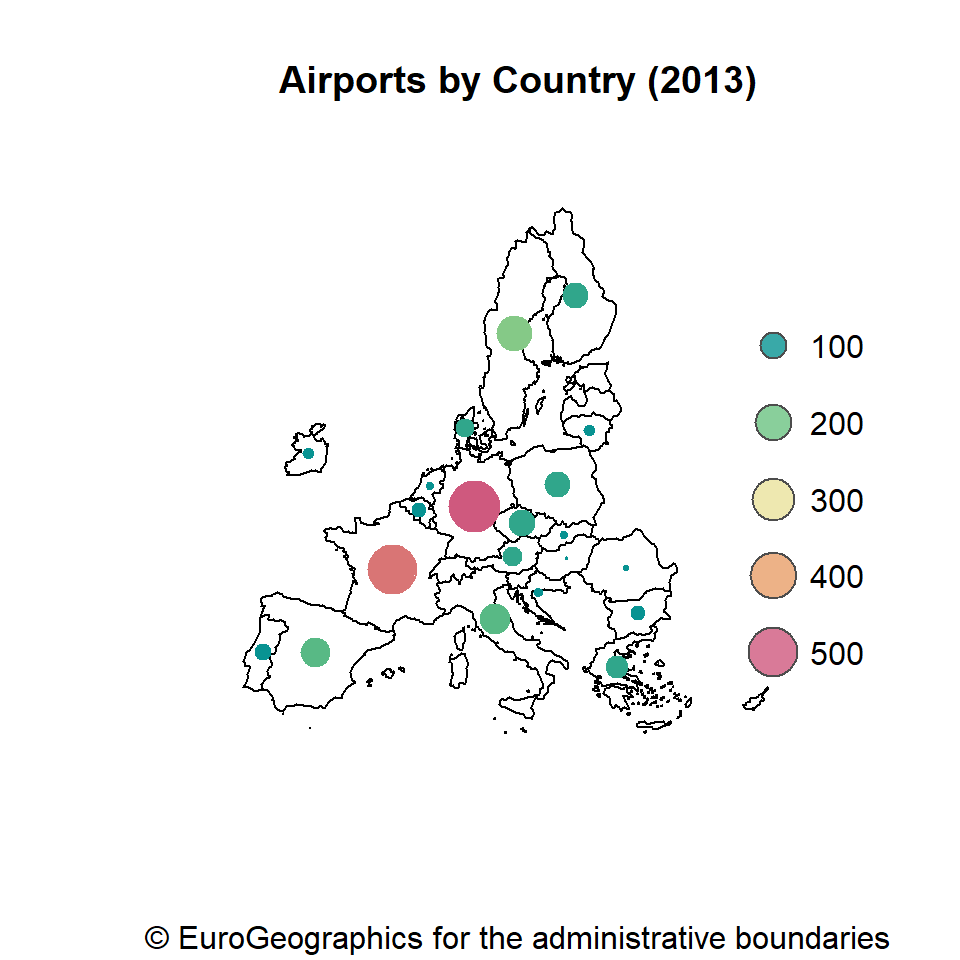
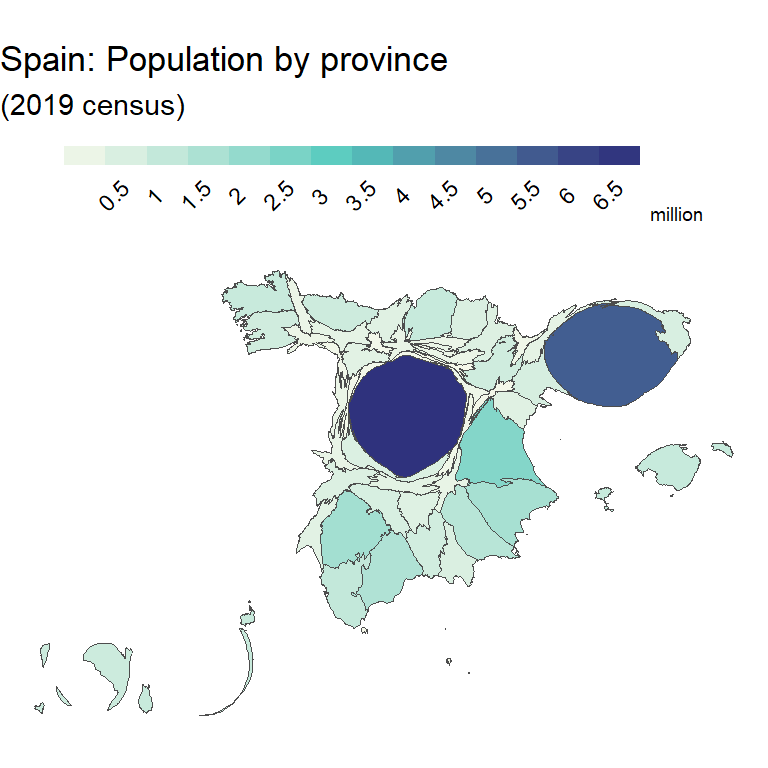
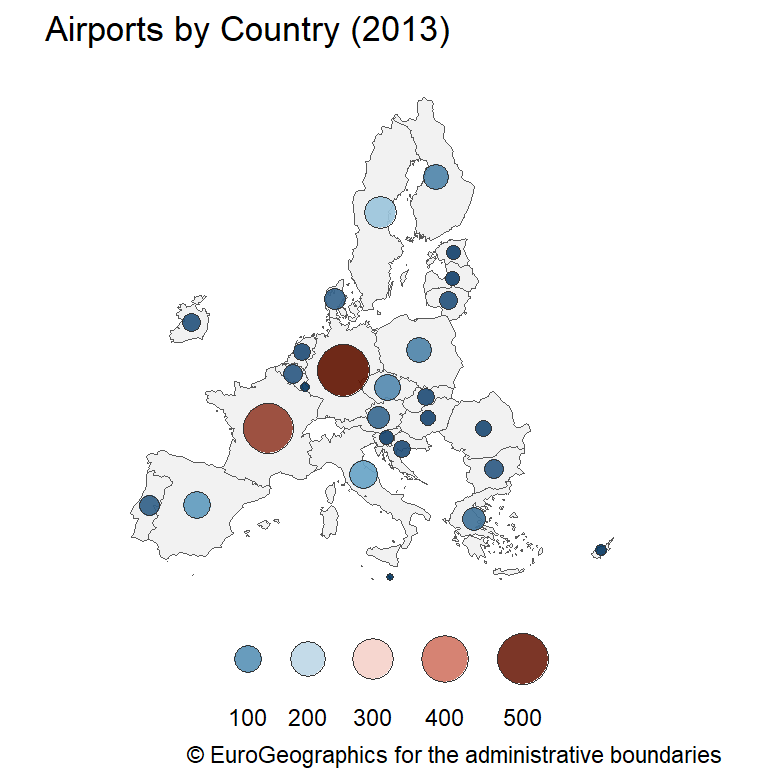
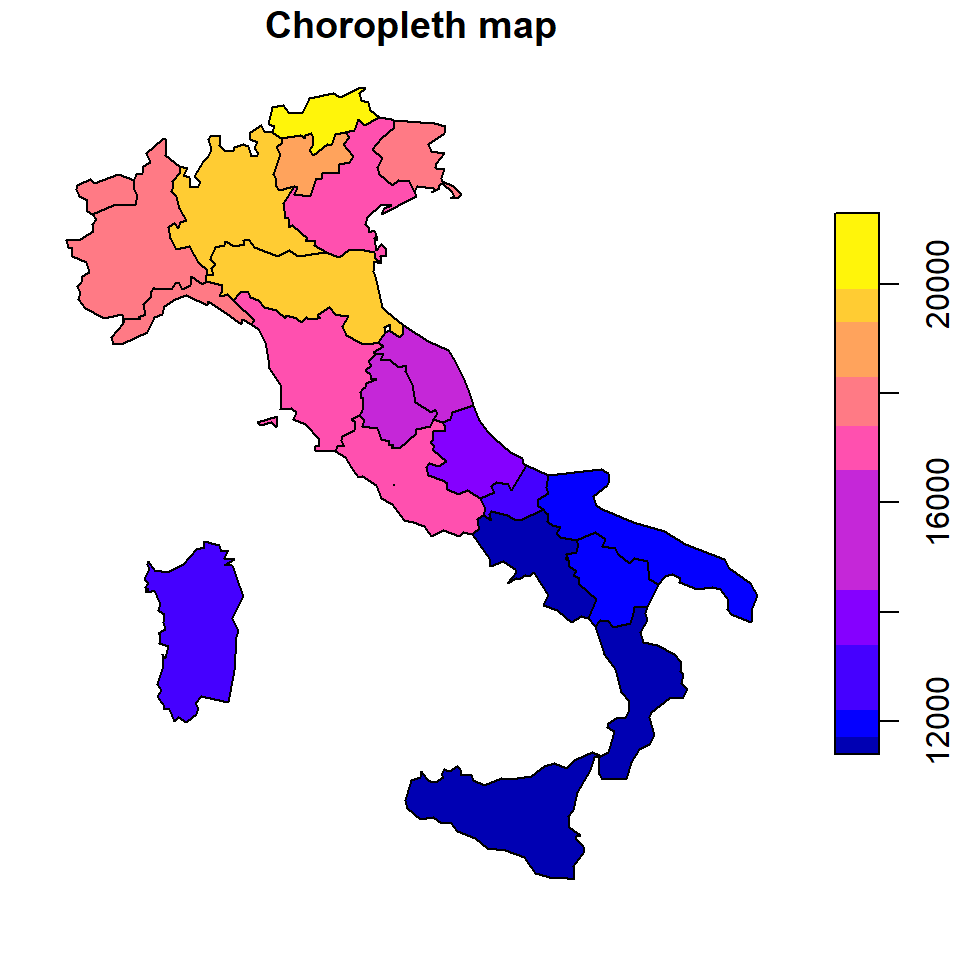
Spatial charts allows visualizing different geographic areas and how those areas differ based on one or multiple variables associated to each of those areas