A proportional symbol map is a type of map that uses symbols to represent data linked to a specific geographic location. Usually, the symbol used is a point that varies on size depending of the underlying data to be represented. This kind of map is also known as “Bubble map”.
We would use the data included on the giscoR package, that provides map data on sf format to represent the number of airports on each country belonging to the European Union.
Data extraction
In first place, we would need to get the spatial data that contains the geographical information to be used on the plot. On giscoR, we can select the countries and the airports. We would also compute the location of the symbol by using st_centroid().
Note that when working with spatial data all the shapes should present the same Coordinate Reference System (CRS). On this example we select ETRS89-extended / LAEA Europe (EPSG code: 3035) as the CRS to be used on our map.
# install.packages("sf")
# install.packages("dplyr")
# install.packages("ggplot2")
# install.packages("giscoR")

library(giscoR)
library(dplyr)
library(sf)
library(ggplot2)

epsg_code <- 3035

# European countries
EU_countries <- gisco_get_countries(region = "EU") %>%
  st_transform(epsg_code)

# Countries centroids
symbol_pos <- st_centroid(EU_countries, of_largest_polygon = TRUE)

# Countries airports
airports <- gisco_get_airports(country = EU_countries$ISO3_CODE) %>%
  st_transform(epsg_code)
We can create a quick plot to get a first sight of our data:
# Plot
ggplot(EU_countries) +
  geom_sf() +
  xlim(c(2200000, 7150000)) +
  ylim(c(1380000, 5500000)) +
  # Airports
  geom_sf(data = airports,
          pch = 3,
          cex = 1,
          color = "red") +
  # Labels position (centroids)
  geom_sf(data = symbol_pos, color = "blue")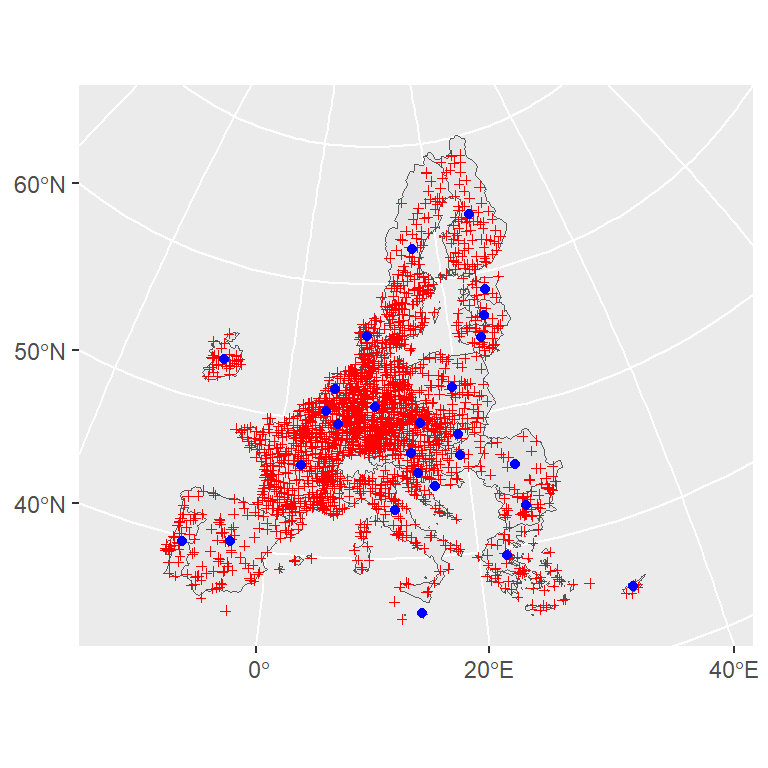
Airports are marked in red while the desired location of the proportional symbols are presented in blue.
Wrangling our data
Next step is to summarize the number of airports by country and attach it to the symbol_pos object. For doing that, we would extract the data frame from airports using st_drop_geometry():
number_airport <- airports %>%
  st_drop_geometry() %>%
  group_by(CNTR_CODE) %>%
  summarise(n = n())
Now we can join the aggregated dataset to symbol_pos:
labels_n <-
  symbol_pos %>%
  left_join(number_airport,
            by = c("CNTR_ID" = "CNTR_CODE")) %>%
  arrange(desc(n))
Given that the points would be plotted in order, it is a good practice to sort the rows of the spatial object in descending order, i.e. from greater to lower value. By doing this, small points would be plotted in front of big points, so no points would be hidden under the biggest symbols.
Basic proportional symbol map
Now we are ready to create the plot. We would overlay the proportional symbols over a country map to provide an spatial reference:
ggplot() +
  geom_sf(data = EU_countries, fill = "grey40") +
  geom_sf(data = labels_n,
          pch = 21,
          aes(size = n),
          fill = alpha("red", 0.7),
          col = "grey20") +
  xlim(c(2200000, 7150000)) +
  ylim(c(1380000, 5500000)) +
  labs(size = "No. airports") +
  scale_size(range = c(1, 9))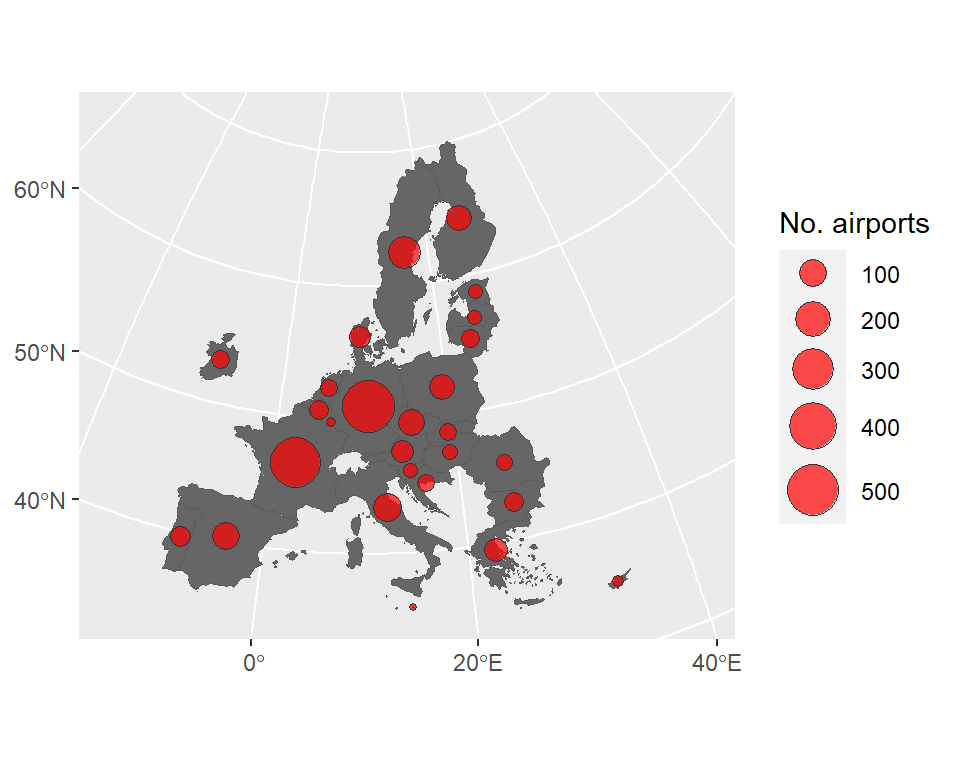
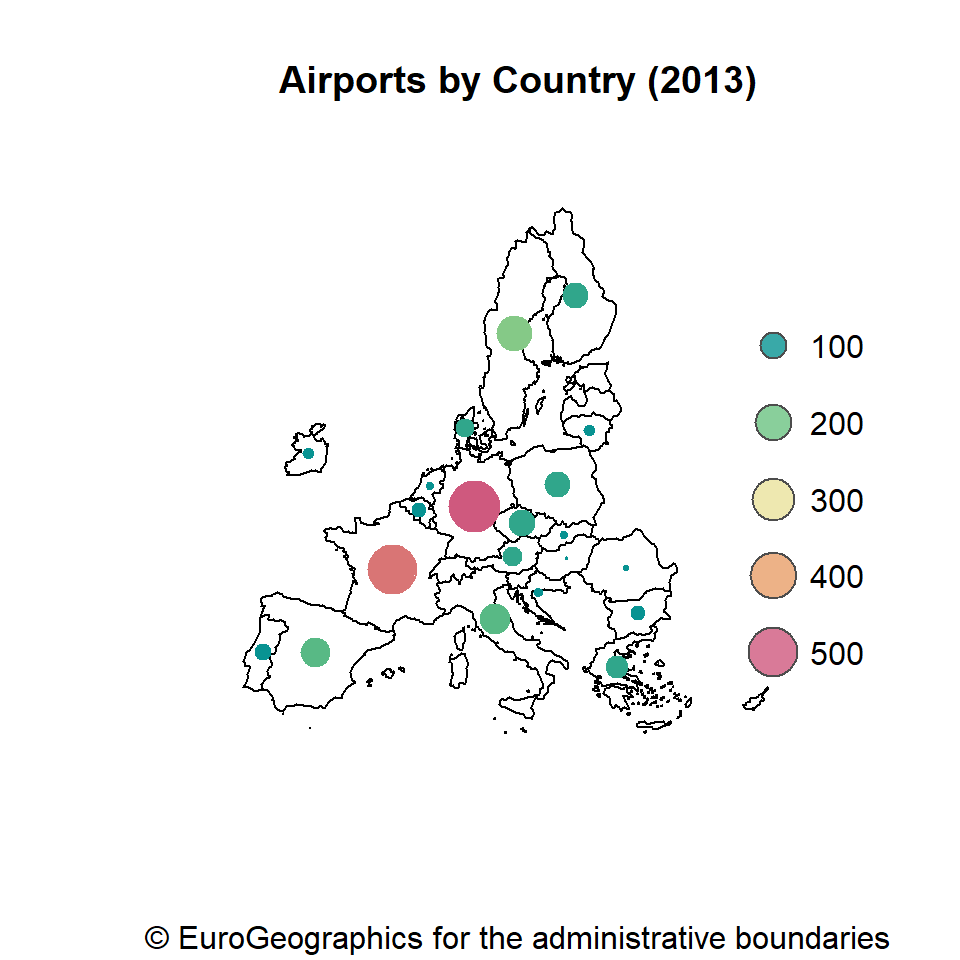
Advanced proportional symbol map
We can also combine a choropleth map and a proportional symbol map to create a more advanced plot:
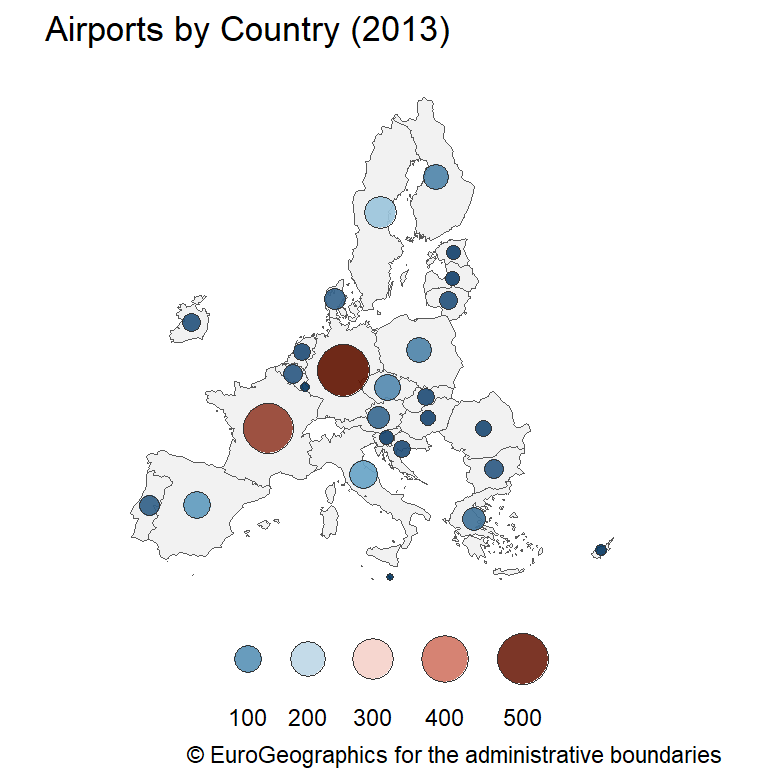
# Bubble choropleth map
ggplot() +
  geom_sf(data = EU_countries, fill = "grey95") +
  geom_sf(
    data = labels_n,
    pch = 21,
    aes(size = n, fill = n),
    col = "grey20") +
  xlim(c(2200000, 7150000)) +
  ylim(c(1380000, 5500000)) +
  scale_size(
    range = c(1, 9),
    guide = guide_legend(
      direction = "horizontal",
      nrow = 1,
      label.position = "bottom")) +
  scale_fill_gradientn(colours = hcl.colors(5, "RdBu",
                                            rev = TRUE,
                                            alpha = 0.9)) +
  guides(fill = guide_legend(title = "")) +
  labs(title = "Airports by Country (2013)",
       sub = "European Union",
       caption = gisco_attributions(),
       size = "") +
  theme_void() +
  theme(legend.position = "bottom")
Master Statistics
Learn statistics from the basics to advanced techniques, clearly explained
Go to site