catplot function
The CatterPlots package contains several functions to create plots with cats. The most basic function is catplot, which can be used to create a plot with a single cat image. Note that the cats can be chosen selecting a number between 1 and 11 (see the following section for clarification).
# install.packages("remotes")
# remotes::install_github("Gibbsdavidl/CatterPlots")
library(CatterPlots)

# Sample data
x <- seq(0, 15, 0.5)
y <- sin(x)

catplot(x, y,
        cat = 2,       # Cat type
        catcolor = 2,  # Color of the cat
        type = "line", # "line" or "justcats"
        linecolor = 1) # Color of the line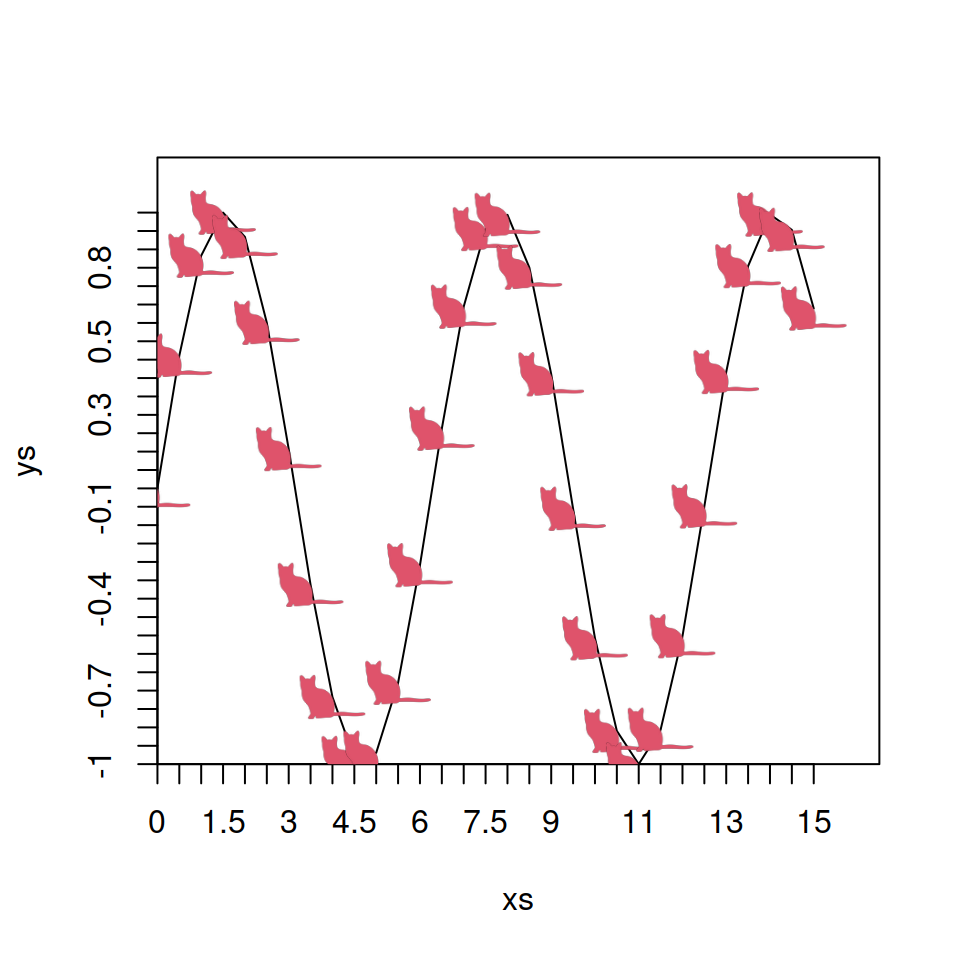
In case you want to add more cats over your previous chart you can use the cats function, which behaves similar to the points function, but will need to pass the catplot object to the function and the new coordinates and arguments.
# install.packages("remotes")
# remotes::install_github("Gibbsdavidl/CatterPlots")
library(CatterPlots)

# Sample data
x <- seq(0, 15, 0.5)
y <- sin(x)

obj <- catplot(x, y,
        cat = 2,
        catcolor = 2,
        type = "line")

# Adding more cats!
cats(obj,      # catplot object
     4.5, 0.8, # Coordinates
     cat = 3,
     catcolor = 3)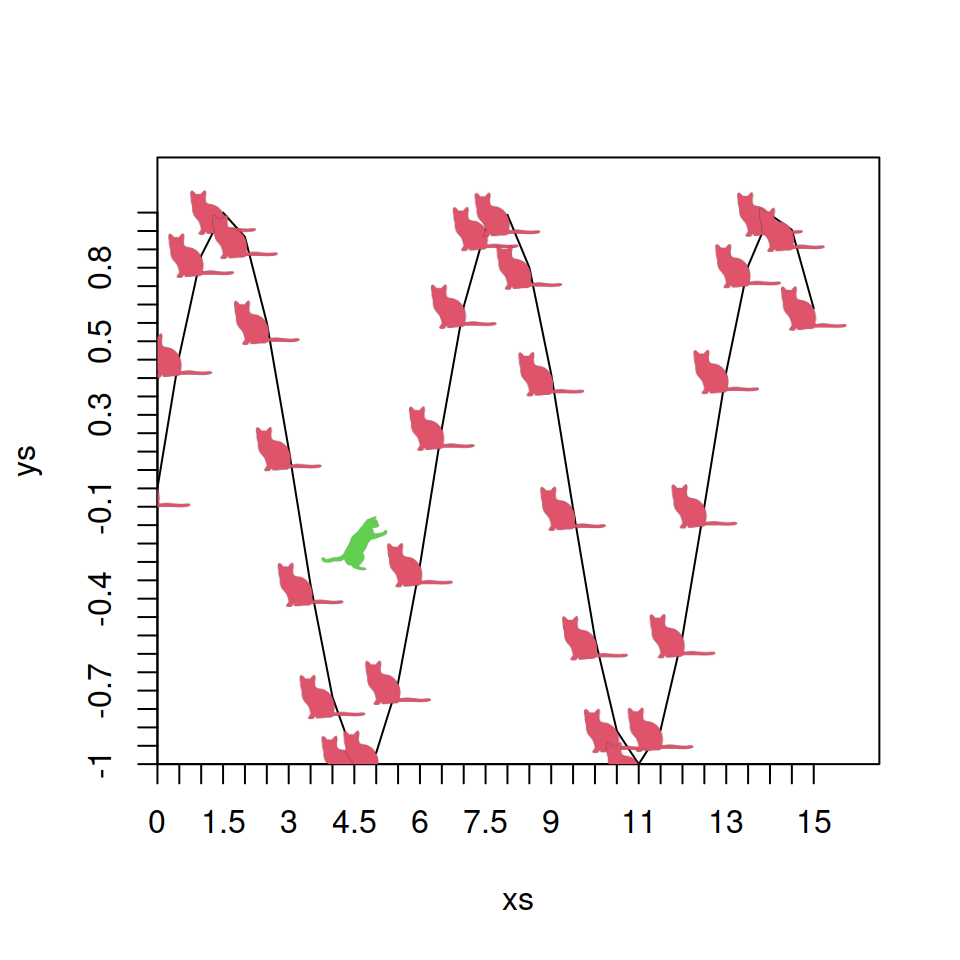
Additionally, the morecats function allows adding even more cats with different colors and shapes.
# install.packages("remotes")
# remotes::install_github("Gibbsdavidl/CatterPlots")
library(CatterPlots)

# Sample data
x <- seq(0, 15, 0.5)
y <- sin(x)

obj <- catplot(x, y,
       cat = 2,
       catcolor = 2,
       type = "line")

# Adding more cats!
morecats(obj,       # catplot object
         x, cos(x), # Coordinates
         cat = 1:11,
         catcolor = 1:11,
         type = "line")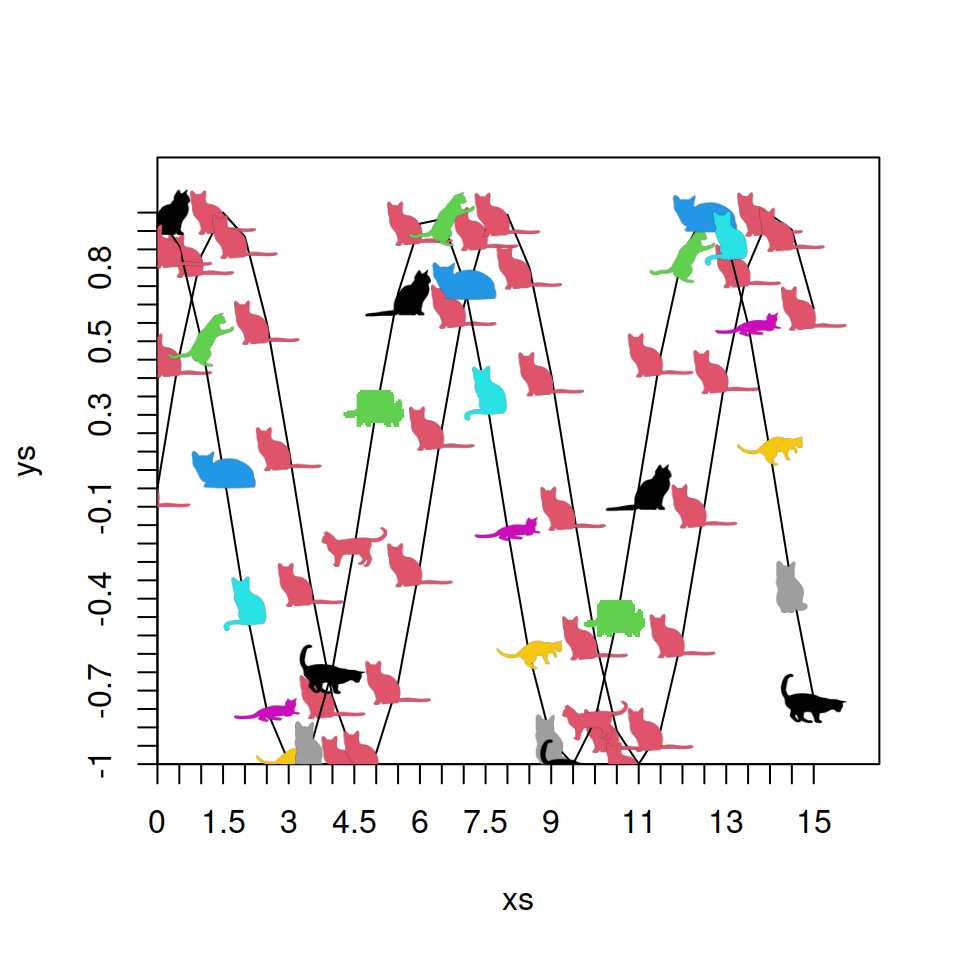
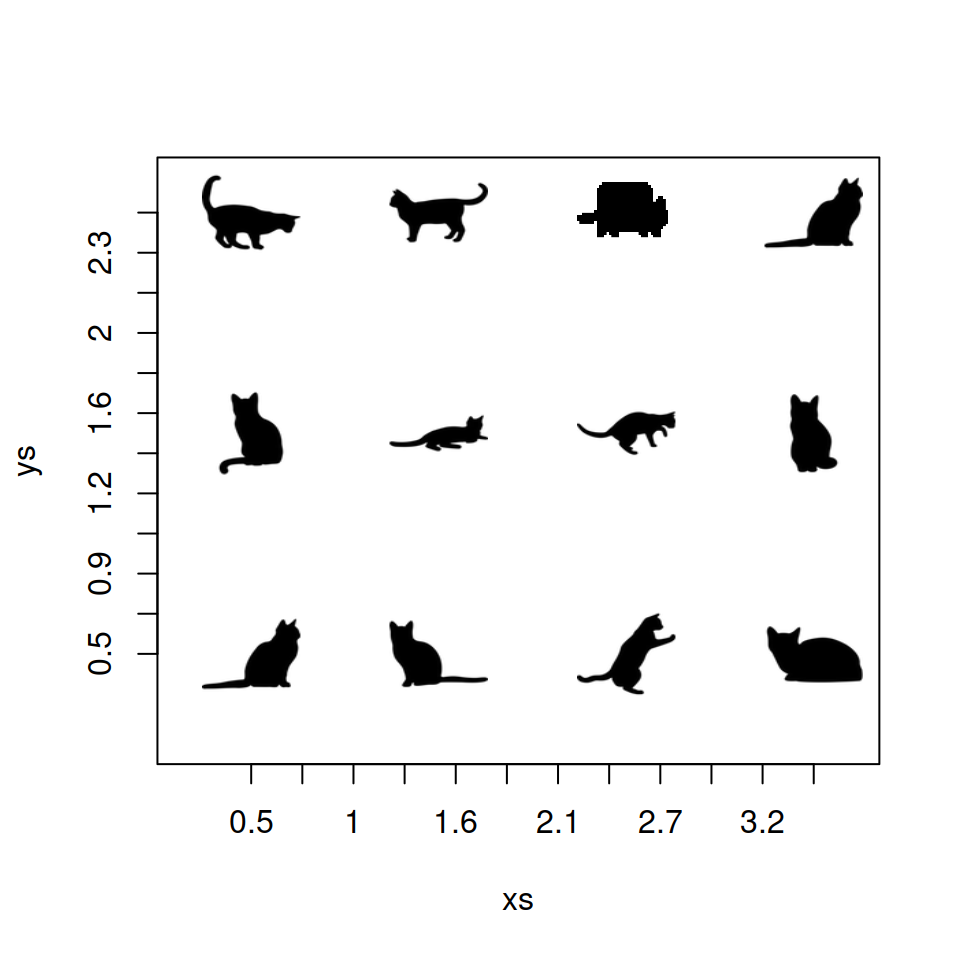
multicat function
An alternative to catplot is multicat. This function allows specifying more than one cat type at once. As it is possible to create the same output as with catplot, we would recommend using this function, as it provides more flexibility.
# install.packages("remotes")
# remotes::install_github("Gibbsdavidl/CatterPlots")
library(CatterPlots)

grid <- expand.grid(0.5:3.5, 0.5:2.5)
x <- grid$Var1
y <-  grid$Var2

multicat(xs = x, ys = y, # Coordinates
         cat = 1:11,     # Cat type
         catcolor = 1,   # Cat color
         size = 0.15)    # Cat size
rainbowCats function
Finally, the package contains a function named rainbowCats to create a Nyan Cat plot in R, as shown below:
# install.packages("remotes")
# remotes::install_github("Gibbsdavidl/CatterPlots")
library(CatterPlots)

# Data
x <- -10:10
y <- -x ^ 2

# Plot
rainbowCats(x, y,
            yspread = 0.05,
            xspread = 0.05,
            ptsize = 2,
            catshiftx = 0.5,
            catshifty = -0.1,
            canvas = c(0, 1.5, -1, 1.5))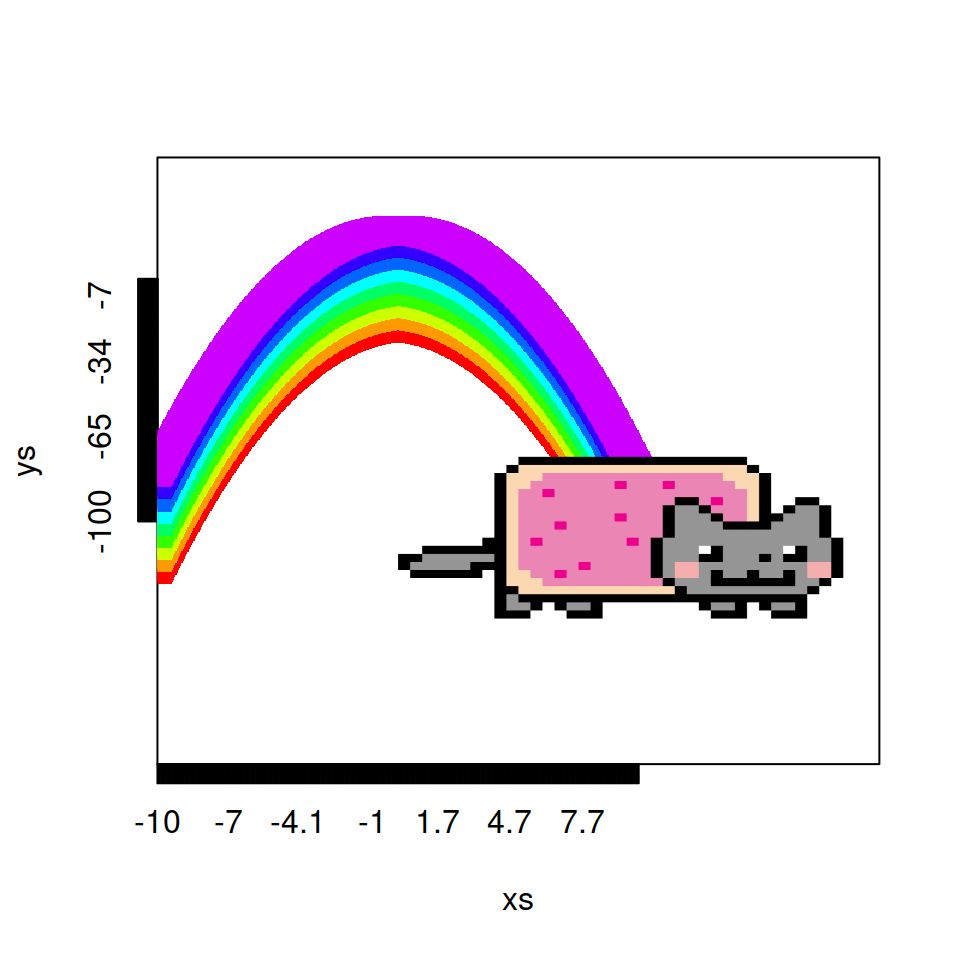

Master Statistics
Learn statistics from the basics to advanced techniques, clearly explained
Go to site