Sample data
ggraph works on graph objects created with igraph. Build one from an edge list data frame using graph_from_data_frame(). Each row is a connection between two nodes.
# install.packages("igraph")
library(igraph)

edges <- data.frame(
  from   = c("Alice", "Alice", "Bob",  "Carol", "Carol", "Dave", "Eve"),
  to     = c("Bob",   "Carol", "Dave", "Dave",  "Eve",   "Frank","Frank"),
  weight = c(3, 5, 2, 4, 1, 3, 2)
)

g <- graph_from_data_frame(edges, directed = FALSE)
Basic ggraph
ggraph() initializes the plot and sets the layout algorithm. Add geom_edge_link() for the edges and geom_node_point() for the nodes. theme_graph() removes the axes and grey background.
# install.packages("ggraph")
library(ggraph)

ggraph(g, layout = "fr") +
  geom_edge_link() +
  geom_node_point(size = 5) +
  theme_graph()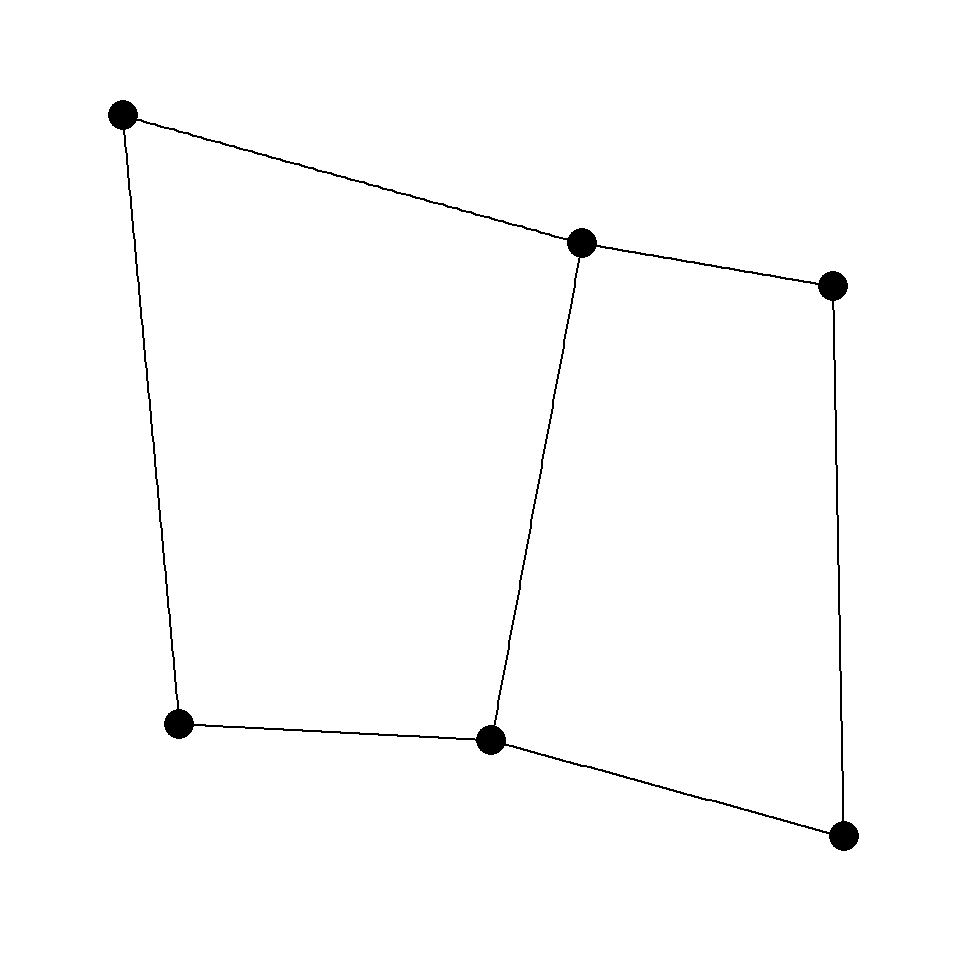
Node labels
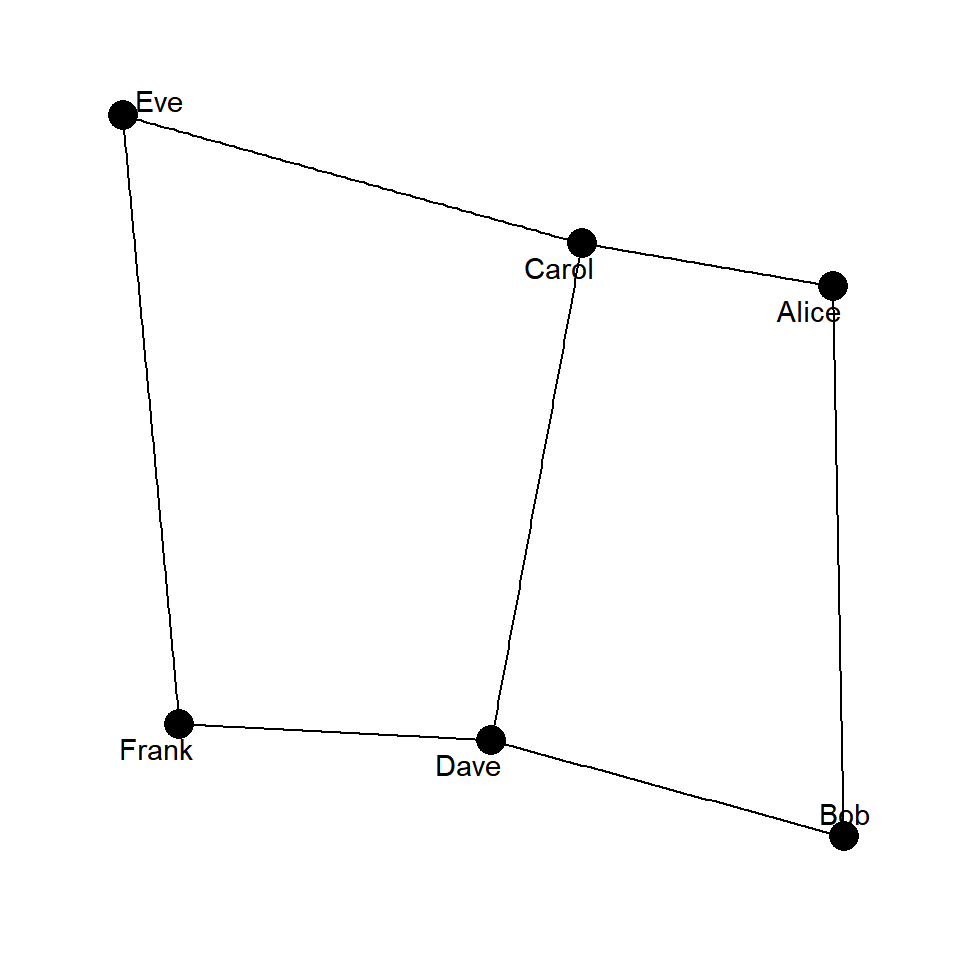
Add geom_node_text() and map name to label. Set repel = TRUE to push labels away from the node centers so they don’t overlap.
# install.packages("ggraph")
library(ggraph)

ggraph(g, layout = "fr") +
  geom_edge_link() +
  geom_node_point(size = 5) +
  geom_node_text(aes(label = name), repel = TRUE) +
  theme_graph()
Layouts
The layout argument controls how nodes are positioned. "fr" (Fruchterman-Reingold) is the default force-directed layout. Other common options are "kk" (Kamada-Kawai), "circle", "star" and "tree".
# install.packages("ggraph")
library(ggraph)

ggraph(g, layout = "circle") +
  geom_edge_link() +
  geom_node_point(size = 5) +
  geom_node_text(aes(label = name)) +
  theme_graph()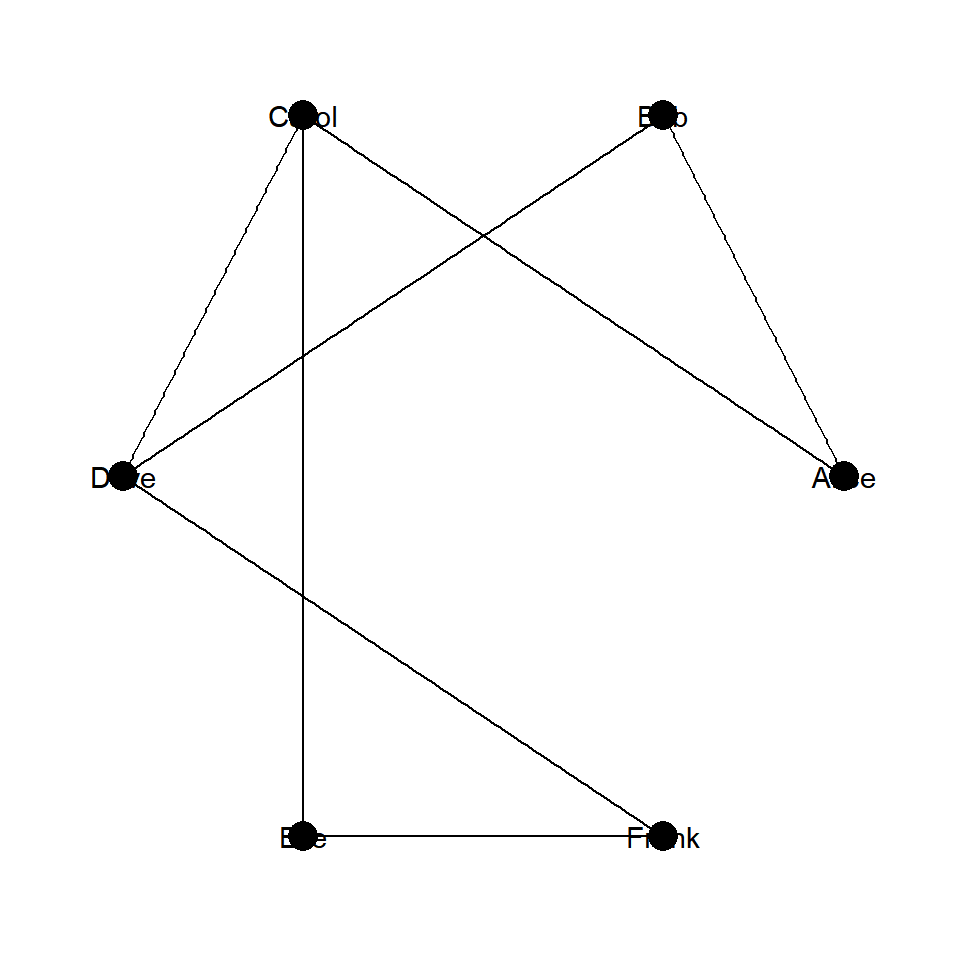
Node color and size
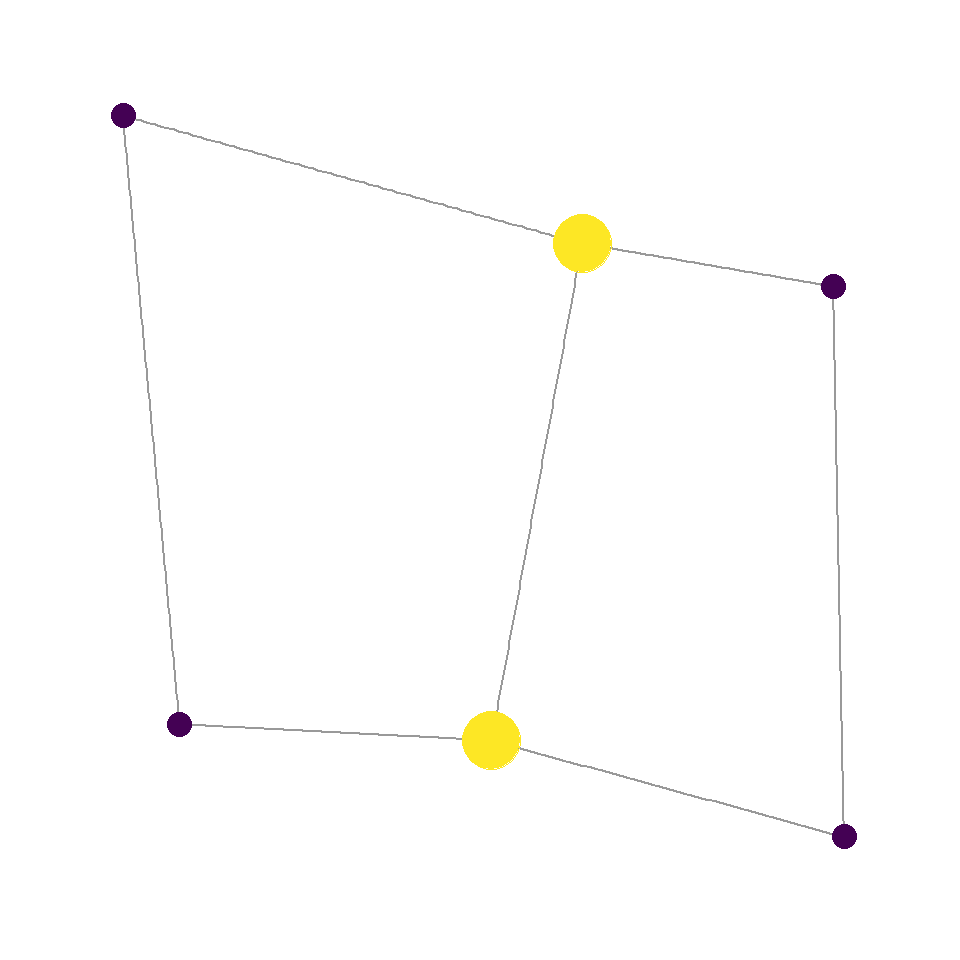
Map degree(g) to size and color inside aes() to encode how many connections each node has. degree() is an igraph function that counts edges per node.
# install.packages("ggraph")
library(ggraph)

ggraph(g, layout = "fr") +
  geom_edge_link(alpha = 0.4) +
  geom_node_point(aes(size  = degree(g),
                      color = degree(g))) +
  scale_color_viridis_c(guide = "none") +
  scale_size(range = c(4, 10), guide = "none") +
  theme_graph()
Edge width
Map a numeric edge attribute to width inside aes() and use scale_edge_width() to set the output range. Here the weight column encodes connection strength.
# install.packages("ggraph")
library(ggraph)

ggraph(g, layout = "fr") +
  geom_edge_link(aes(width = weight), alpha = 0.6) +
  geom_node_point(size = 5) +
  scale_edge_width(range = c(0.5, 3), guide = "none") +
  theme_graph()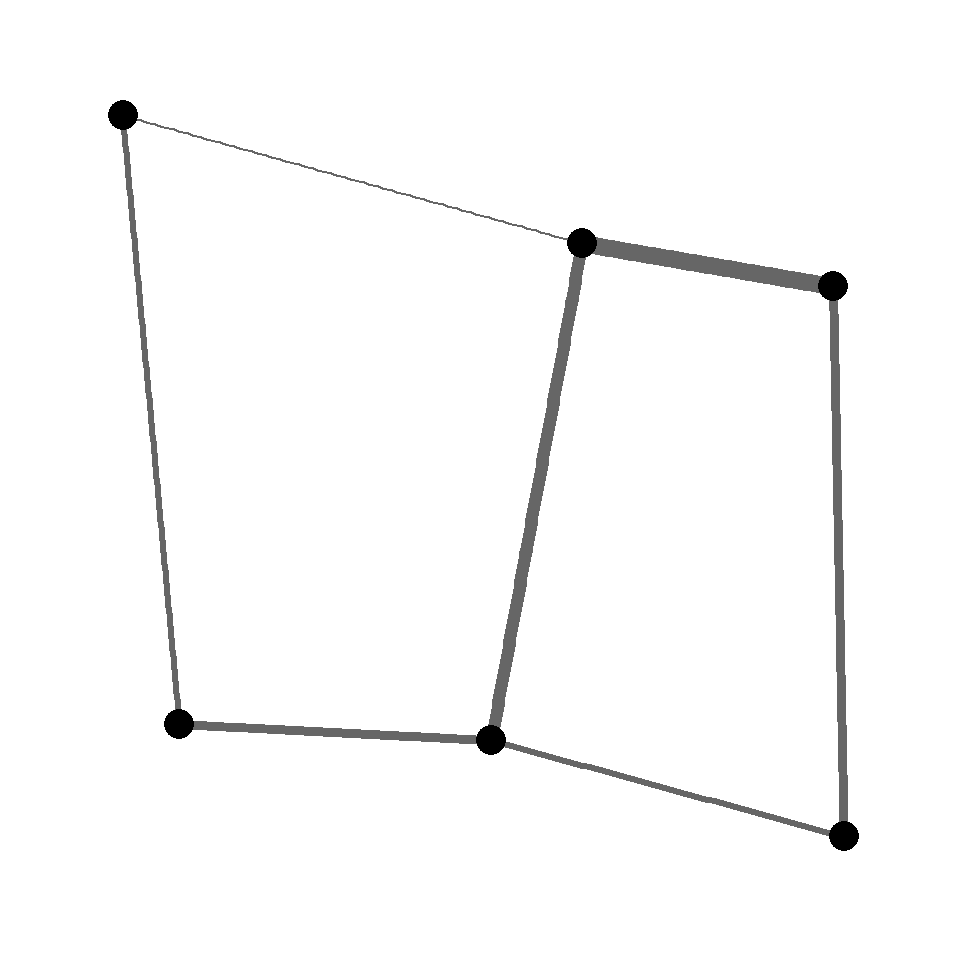
Directed graph
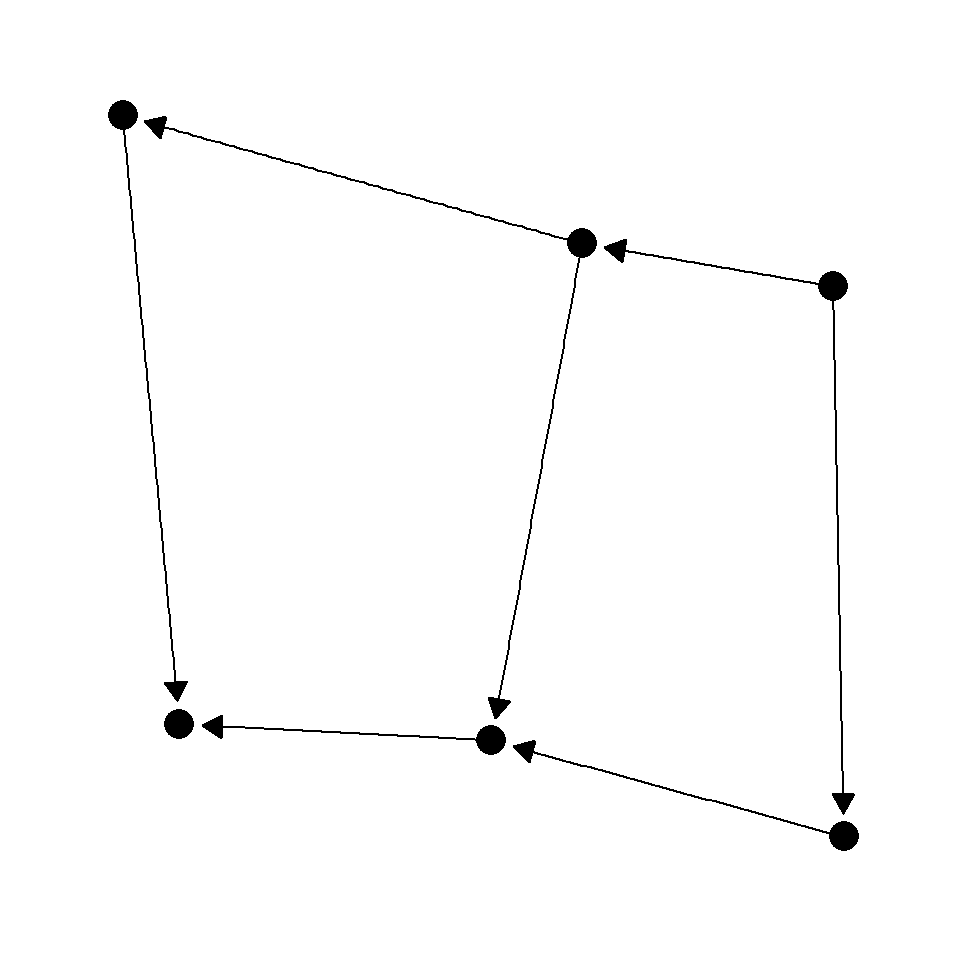
Set directed = TRUE in graph_from_data_frame() and pass an arrow() to geom_edge_link(). Use end_cap to keep the arrowhead from overlapping with the node.
# install.packages(c("igraph", "ggraph"))
library(igraph)
library(ggraph)

gd <- graph_from_data_frame(edges, directed = TRUE)

ggraph(gd, layout = "fr") +
  geom_edge_link(arrow   = arrow(length = unit(3, "mm"),
                                 type   = "closed"),
                 end_cap = circle(3, "mm")) +
  geom_node_point(size = 5) +
  theme_graph()
Curved edges
Replace geom_edge_link() with geom_edge_arc() to draw curved edges. The strength argument controls how much the arcs bend — 0 is straight, 1 is a semicircle.
# install.packages("ggraph")
library(ggraph)

ggraph(g, layout = "fr") +
  geom_edge_arc(strength = 0.3, alpha = 0.6) +
  geom_node_point(size = 5) +
  geom_node_text(aes(label = name), repel = TRUE) +
  theme_graph()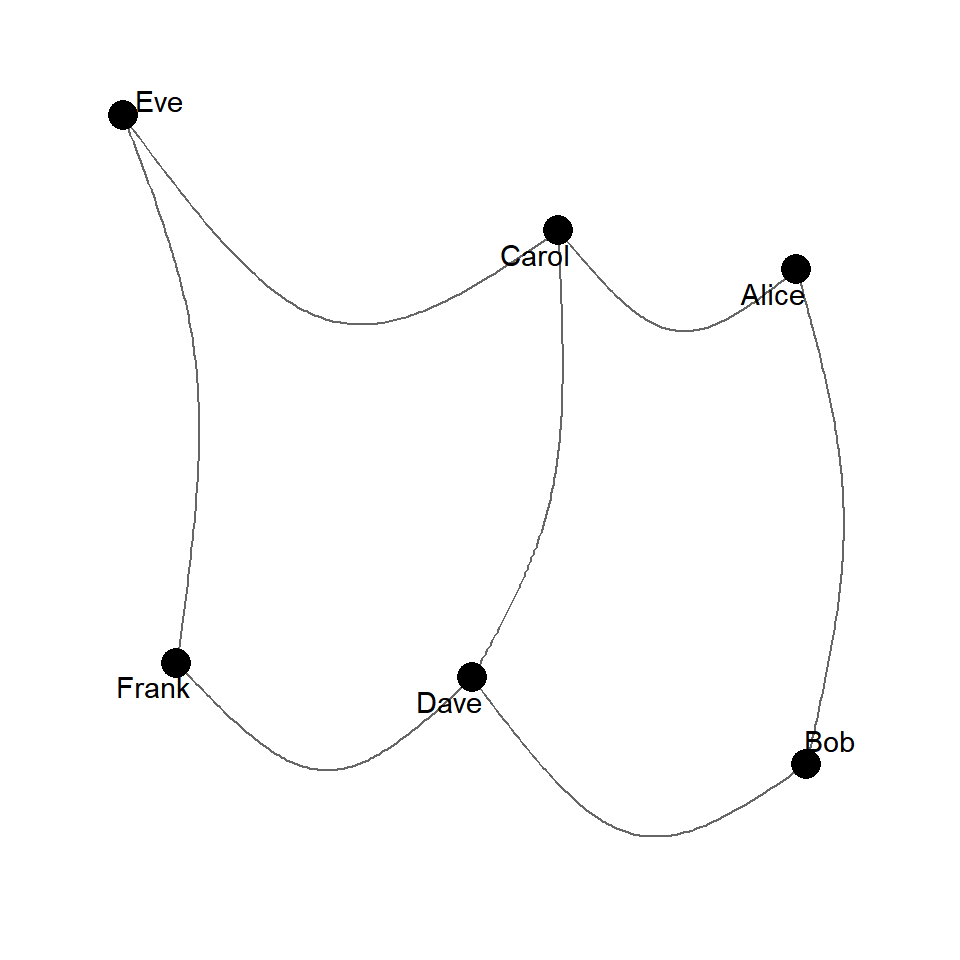

Master Statistics
Learn statistics from the basics to advanced techniques, clearly explained
Go to site