Sample data
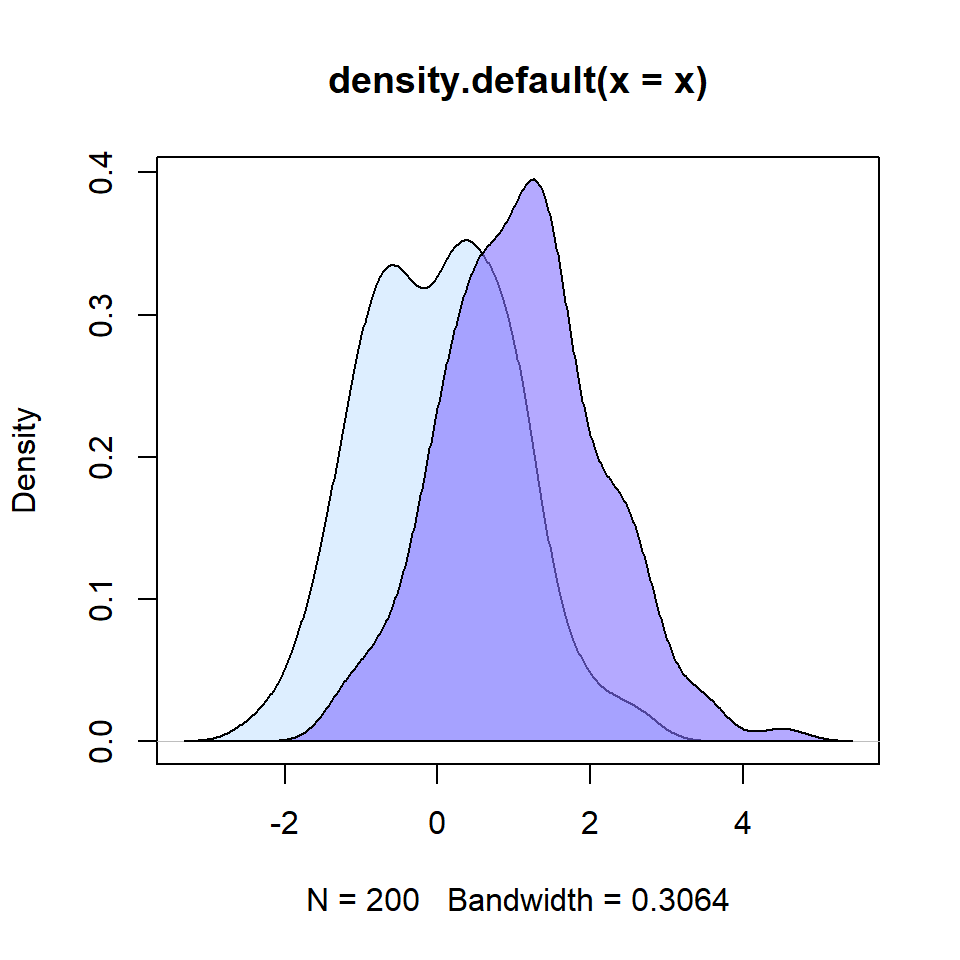
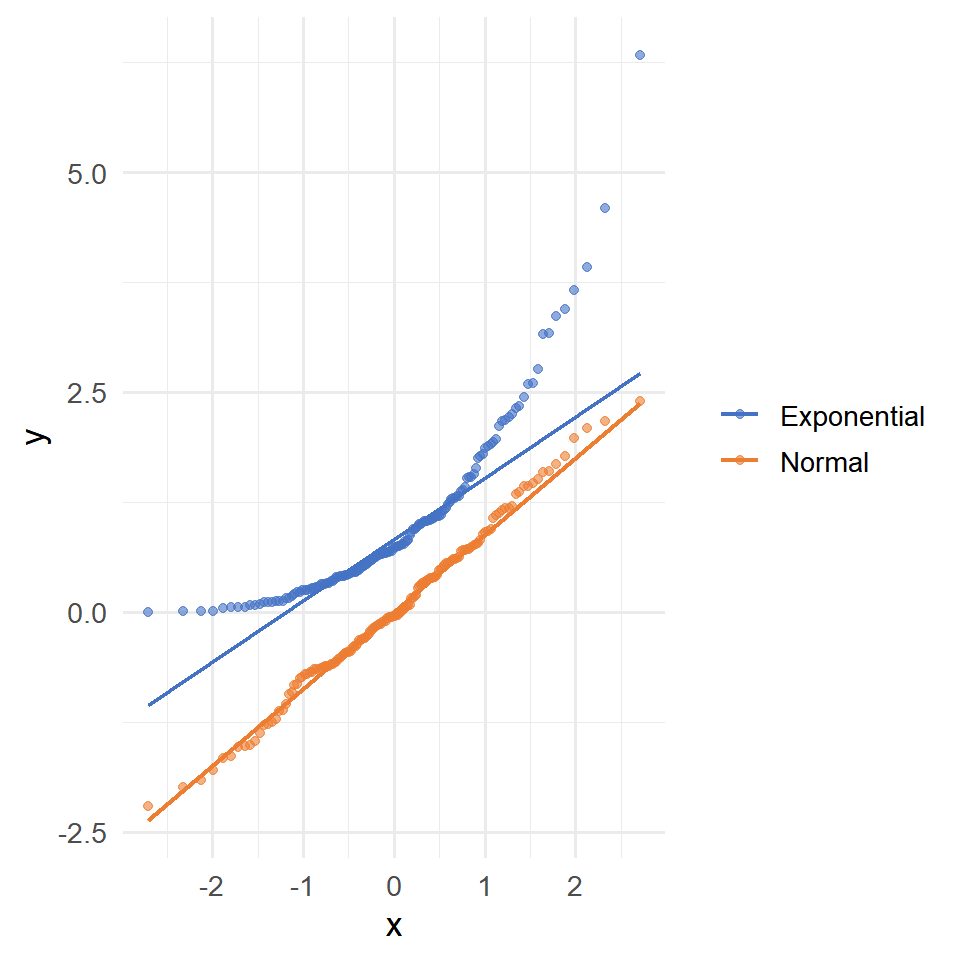
Consider the following data set for this tutorial, where the variable x is a numeric variable drawn from an exponential distribution and group is a categorical variable with groups.
# Sample dataset
set.seed(3)
df <- data.frame(x = rexp(100),
                 group = sample(paste("Group", 1:3),
                                size = 100,
                                replace = TRUE))
Single box plot with points
Adding points (strip charts) to a base R box plot can be achieved making use of the stripchart function. You need to pass the data you used to create your box plot, set the "jitter" method to add random noise over the data points, avoiding overplotting, set the desired aesthetics arguments such as pch or col and add = TRUE so the points are added over the previous plot. Recall that box plots are vertical by default, so you will need to set vertical = TRUE.
Vertical box plot with points
# Vertical box plot
boxplot(df$x, col = "white")

# Points
stripchart(df$x,              # Data
           method = "jitter", # Random noise
           pch = 19,          # Pch symbols
           col = 4,           # Color of the symbol
           vertical = TRUE,   # Vertical mode
           add = TRUE)        # Add it over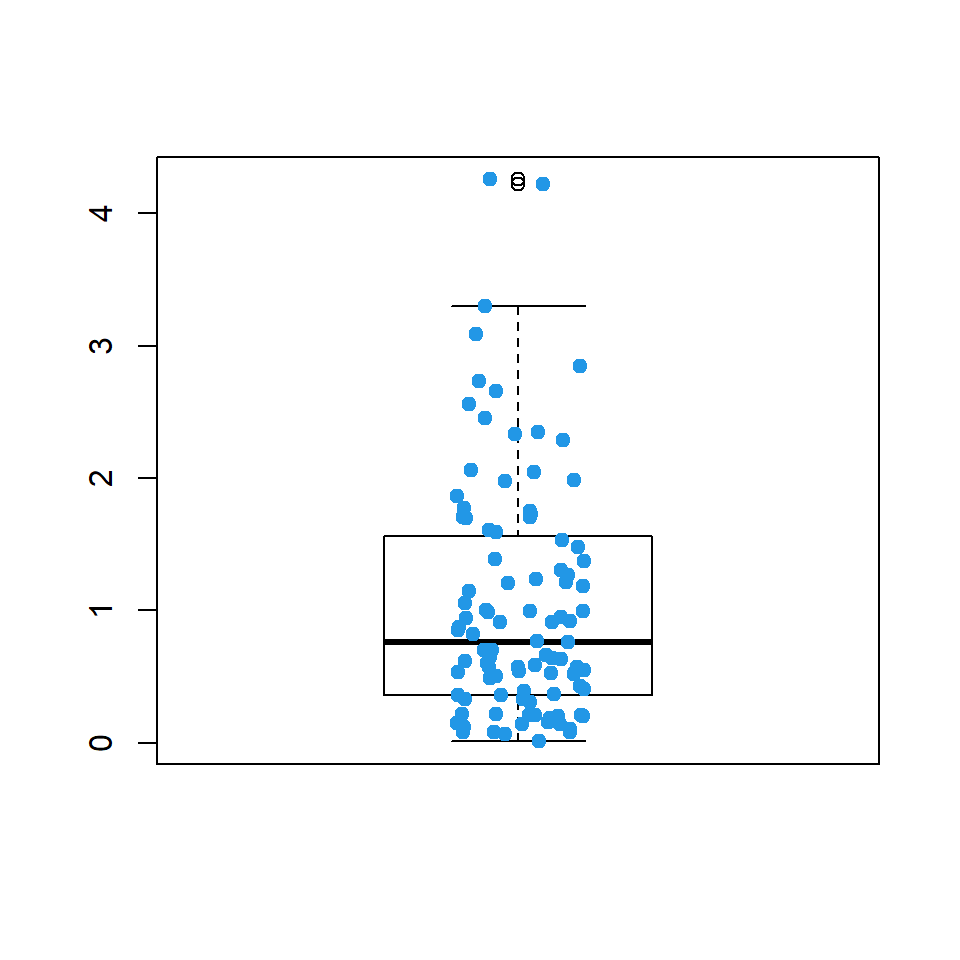
Horizontal box plot with points
# Horizontal box plot
boxplot(df$x, col = "white", horizontal = TRUE)

# Points
stripchart(df$x,              # Data
           method = "jitter", # Random noise
           pch = 19,          # Pch symbol
           col = 4,           # Color of the symbol
           add = TRUE)        # Add it over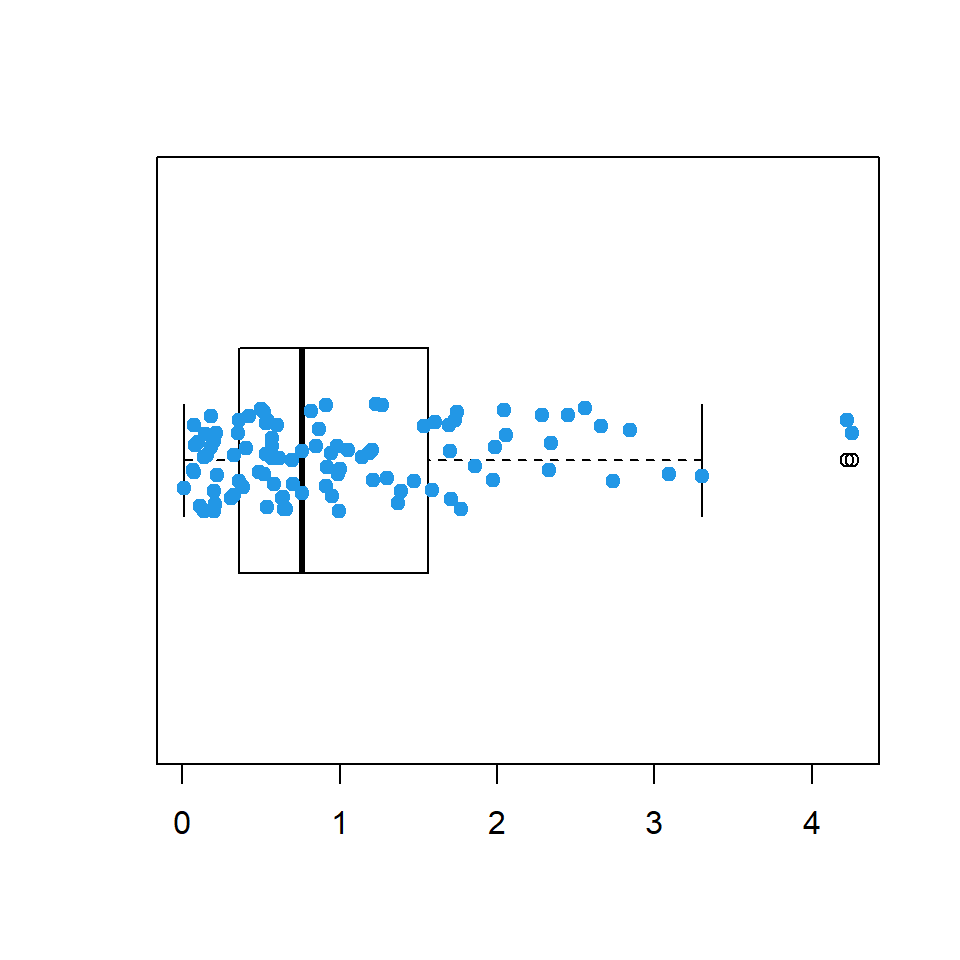
Box plot by group with points
In order to add the points when working with a box plot by group you need to pass the same formula you used to create the box plot to the stripchart function. Recall that box plots are vertical by default, but stripcharts are not.

Vertical box plot by group with points
# Vertical box plot by group
boxplot(x ~ group, data = df, col = "white")

# Points
stripchart(x ~ group,
           data = df,
           method = "jitter",
           pch = 19,
           col = 2:4,
           vertical = TRUE,
           add = TRUE)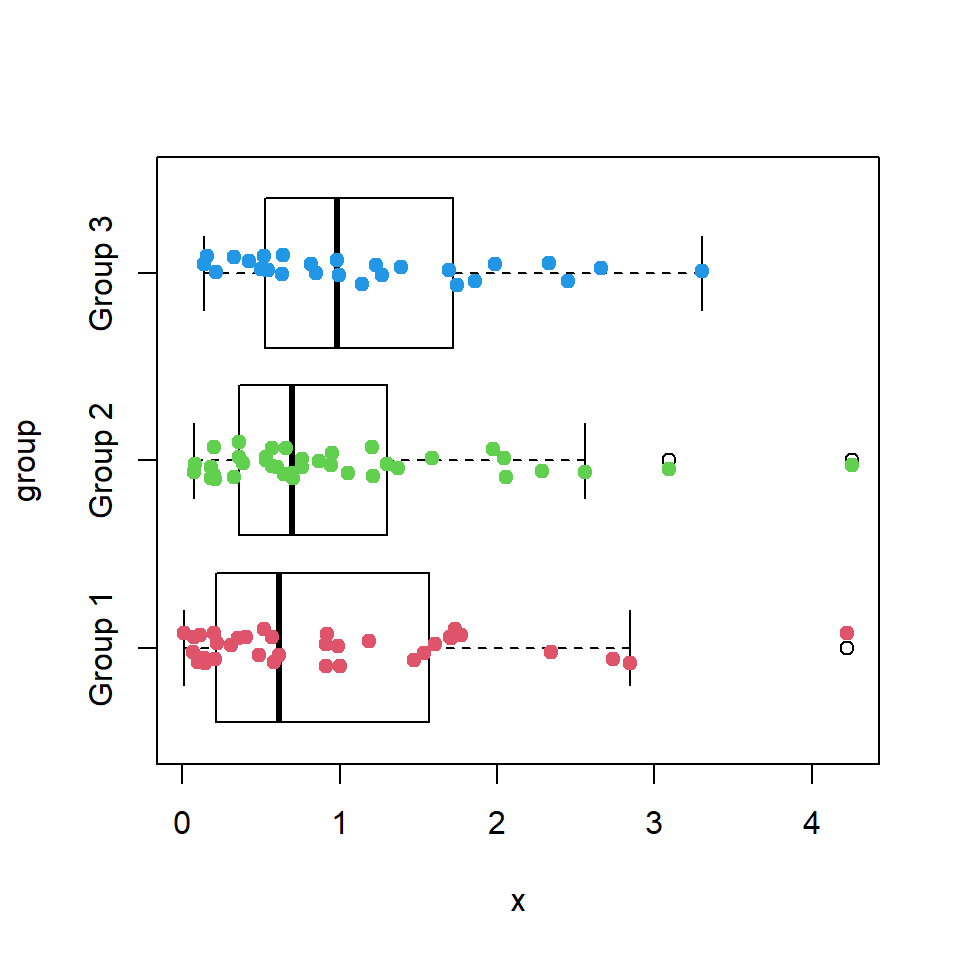
Horizontal box plot by group with points
# Horizontal box plot by group
boxplot(x ~ group, data = df, col = "white",
        horizontal = TRUE)

# Points
stripchart(x ~ group,
           data = df,
           method = "jitter",
           pch = 19,
           col = 2:4,
           add = TRUE)
Master Statistics
Learn statistics from the basics to advanced techniques, clearly explained
Go to site