Sample data
The following variables represent the quantity sold of a product every month of the year, the month and the quarter of the year for each month.
# Sample dataset
set.seed(1)
sold <- sample(400:450, 12)
month <- month.name
quarter <- c(rep(1, 3), rep(2, 3),
             rep(3, 3), rep(4, 3))
Basic dot plot with dotchart function
Basic dot chart
A dot plot can be created with the dotchart function from base R graphics. You can pass a vector of numeric values to the function to create the most basic chart.
dotchart(sold)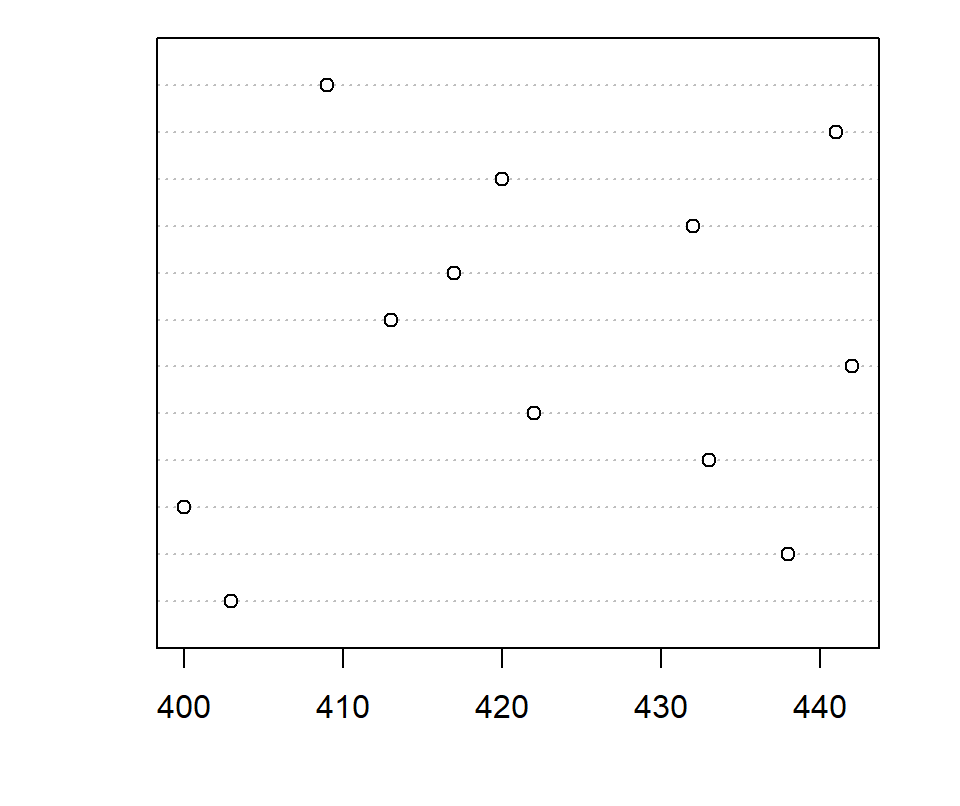
Customization
There are several arguments that can be customized, such as pch to change the plotting character symbol, col to change the color of the symbols, pt.cex for the size of the symbols and fram.plot, which is a logical determining whether to draw a box around the plot or not.
dotchart(sold,
         pch = 19,             # Symbol
         col = hcl.colors(12), # Colors
         pt.cex = 1.5,         # Symbol size
         frame.plot = TRUE)    # Plot frame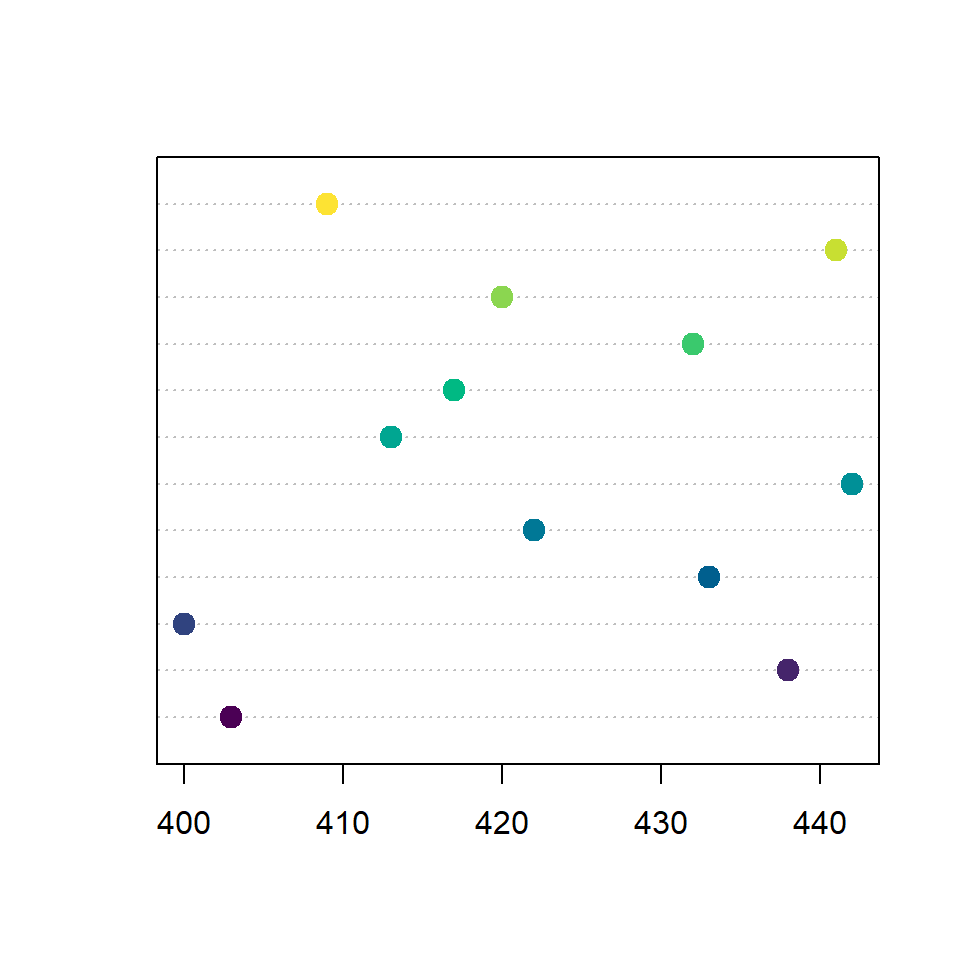
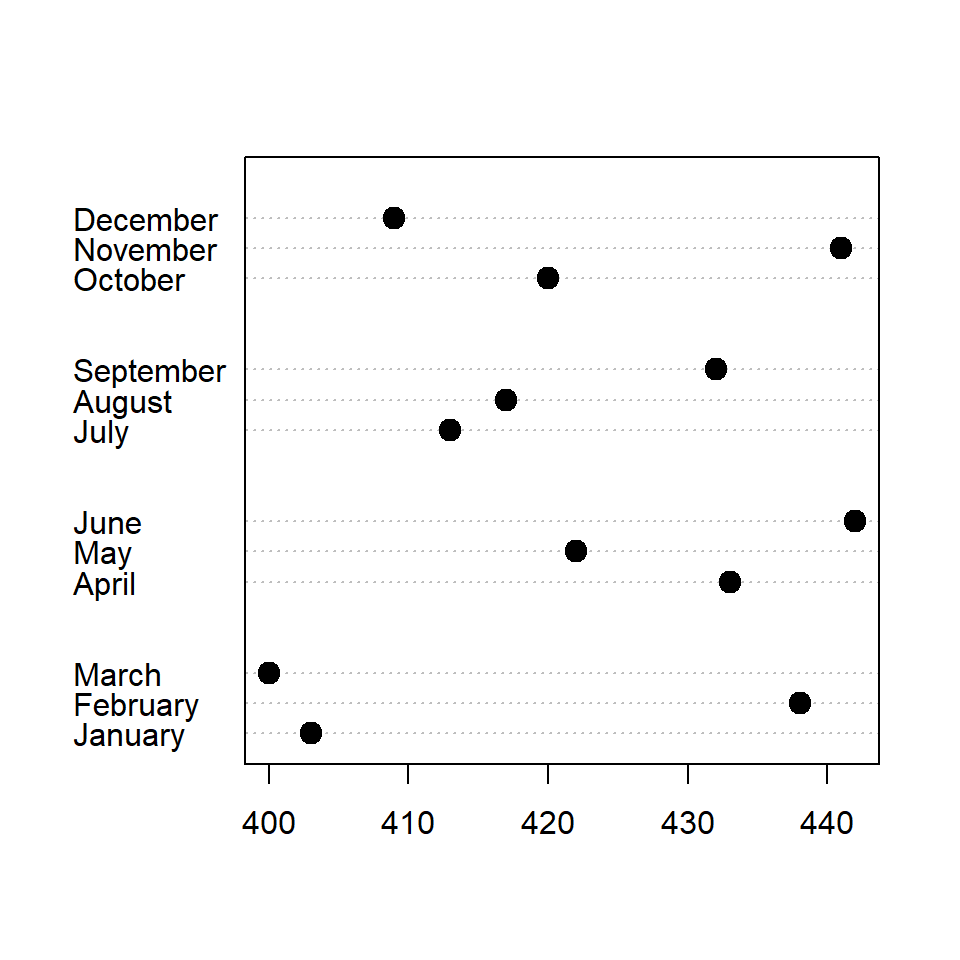
Labeling the observations
You can label each point with the labels argument. In this example we are passing the names of the months to represent each observation.
dotchart(sold,
         pch = 19,
         col = 4,
         pt.cex = 1.5,
         labels = month)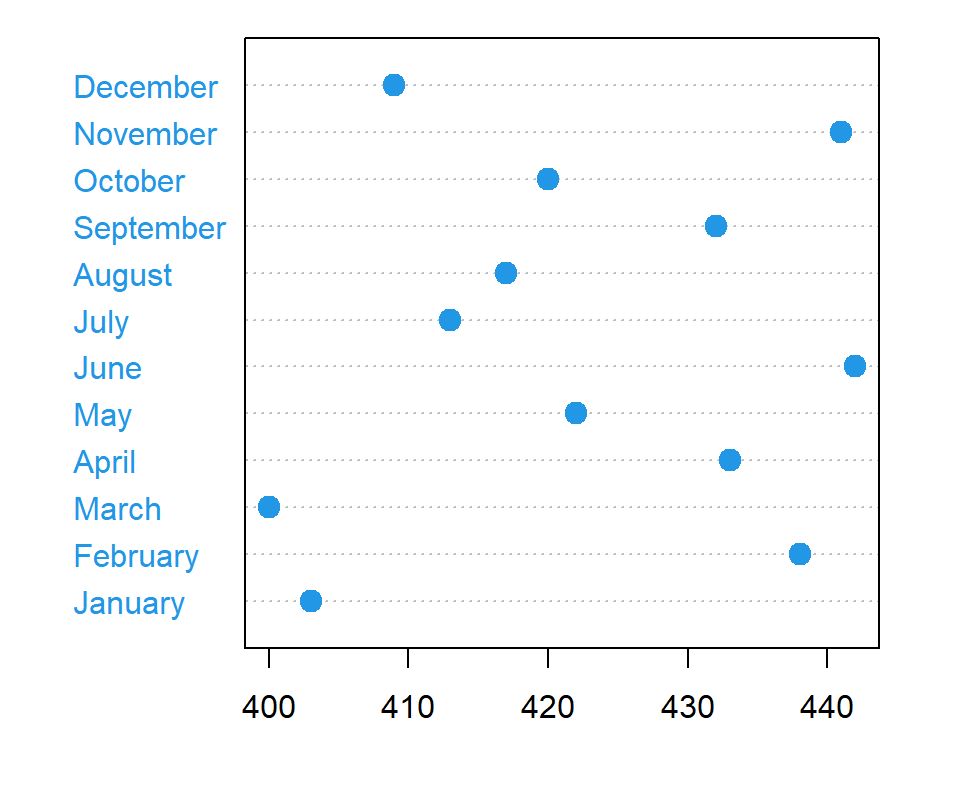
Dot chart by group
Specifying groups
Given a variable representing groups it is possible to group the elements. In the following example we are passing the quarter variable to the groups argument to group the months by quarter.
dotchart(sold,
         pch = 19, pt.cex = 1.5,
         labels = month,
         groups = rev(quarter))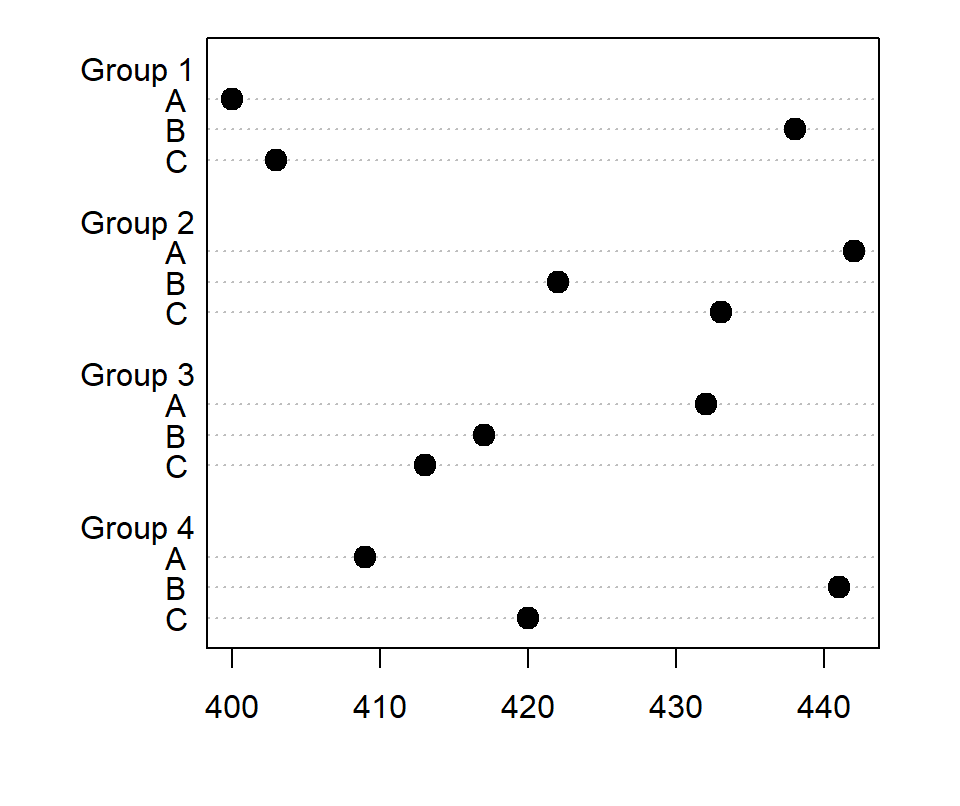
Matrix as input
Note that the dotchart function also allows passing a matrix. In this scenario the groups will be the columns of the matrix by default and the rows the observations for each group.
# Matrix from the data
m <- matrix(sold, ncol = 4)
colnames(m) <- c("G1", "G2", "G3", "G4")
rownames(m) <- LETTERS[3:1]

dotchart(m, pch = 19, pt.cex = 1.5)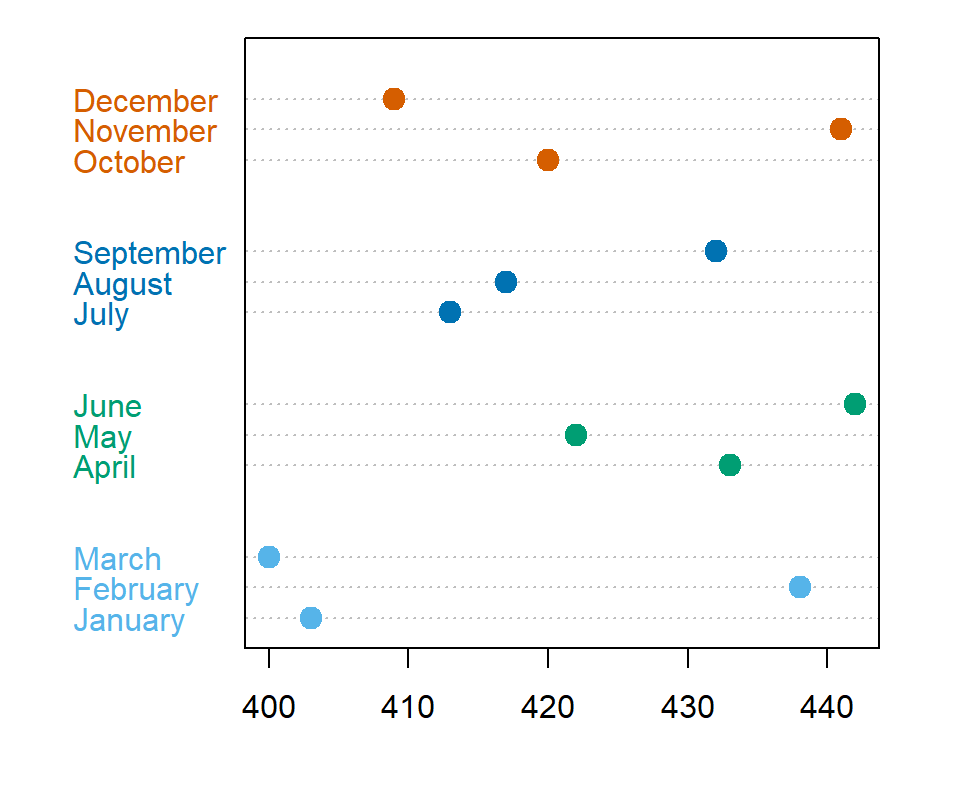
Color by group
If you have passed a grouping variable to groups you can also customize the colors for each group, passing a vector of the same length of the input data to the color argument.
# Colors for each group
cols <- c(rep("#56B4E9", 3), rep("#009E73", 3),
          rep("#0072B2", 3), rep("#D55E00", 3))

dotchart(sold,
         pch = 19, pt.cex = 1.5,
         labels = month,
         groups = rev(quarter),
         color = cols)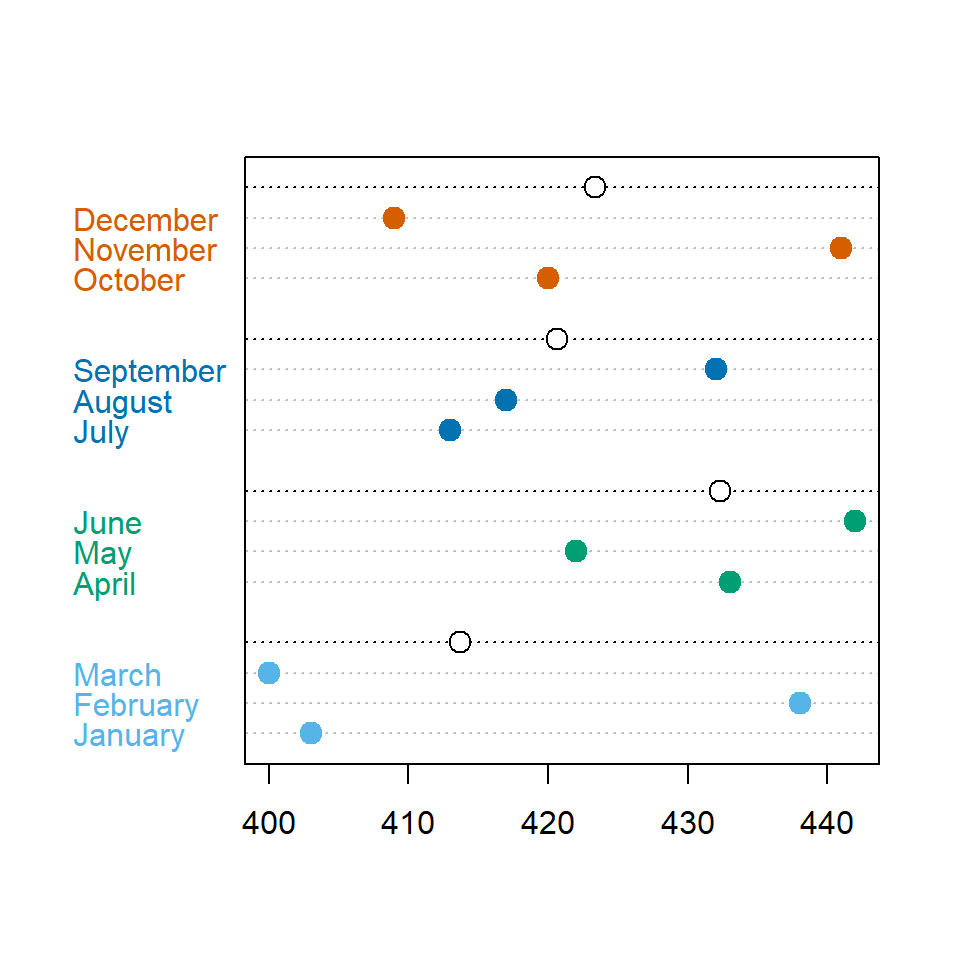
Summary for each group
The gdata argument allows passing some measure for the groups, such as a statistical summary. In the example below we are calculating the mean of sells by quarter.
# Colors for each group
cols <- c(rep("red", 3), rep("blue", 3),
          rep("green", 3), rep("orange", 3))

dotchart(sold,
         pch = 19, pt.cex = 1.5,
         labels = month,
         groups = rev(quarter),
         color = cols,
         gdata = rev(tapply(sold, quarter, mean)))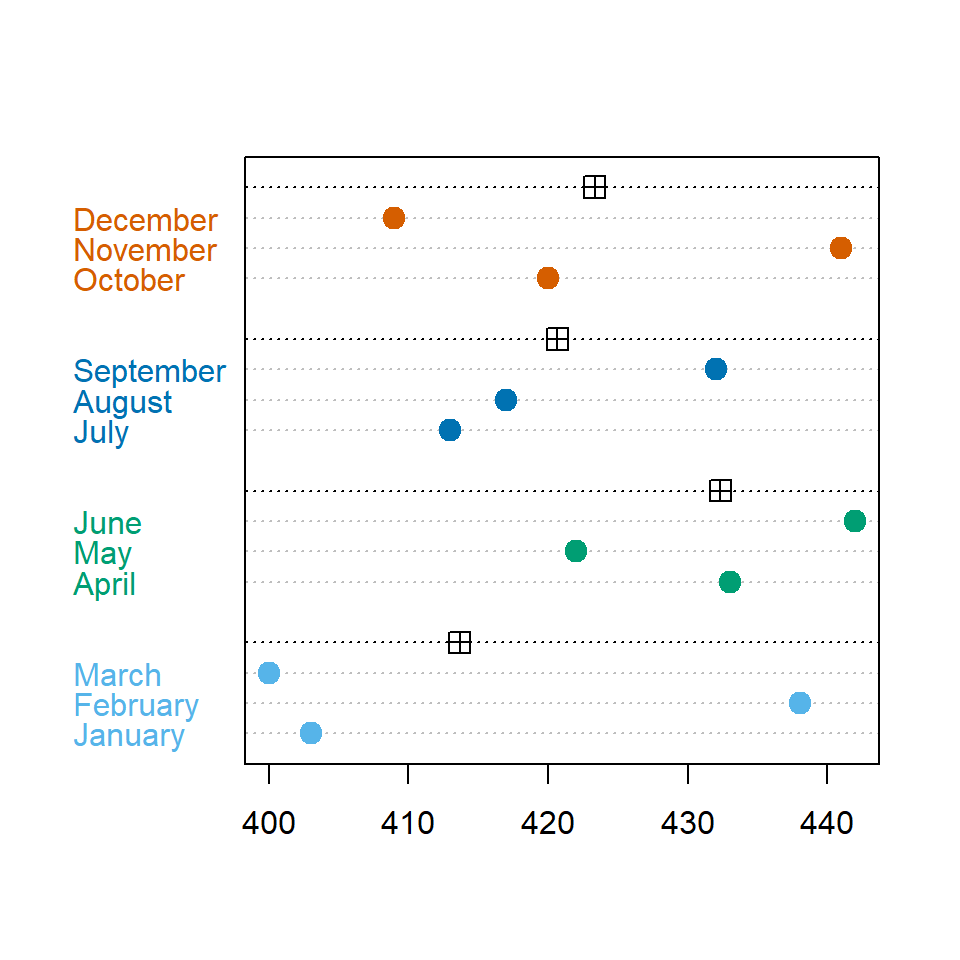
The new points added with gdata can be customized with gpch and gcolor arguments, to modify the pch symbol and the color of the new points, respectively.
# Colors for each group
cols <- c(rep("#56B4E9", 3), rep("#009E73", 3),
          rep("#0072B2", 3), rep("#D55E00", 3))

dotchart(sold,
         pch = 19, pt.cex = 1.5,
         labels = month,
         groups = rev(quarter),
         color = cols,
         gdata = rev(tapply(sold, quarter, mean)),
         gpch = 12,
         gcolor = 1)
Order the values
Finally, note that you can order the values and the labels based on the variable or other measure. In the following example we are ordering the months based on the amount of sales.
# Colors for each group
cols <- c(rep("#56B4E9", 3), rep("#009E73", 3),
          rep("#0072B2", 3), rep("#D55E00", 3))

dotchart(sort(sold),
         labels = month[order(sold)],
         pch = 19, pt.cex = 1.5,
         groups = rev(quarter),
         color = cols)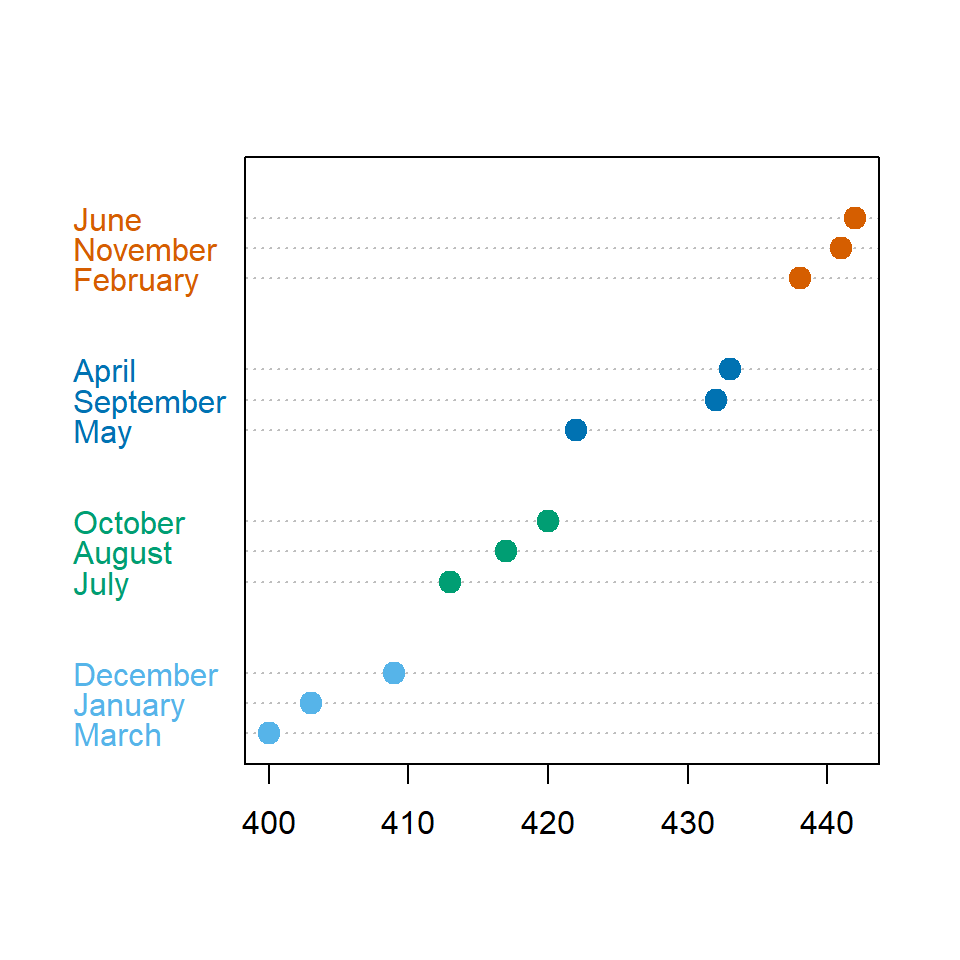

Master Statistics
Learn statistics from the basics to advanced techniques, clearly explained
Go to site