Basic box plot
The boxplot function is the function for creating box plots in base R graphics. You can pass a vector or a data frame (to plot all the columns). Since R 4.0.0 the box plots are gray by default, while in previous versions were white.
set.seed(7)
x <- rnorm(200)

boxplot(x)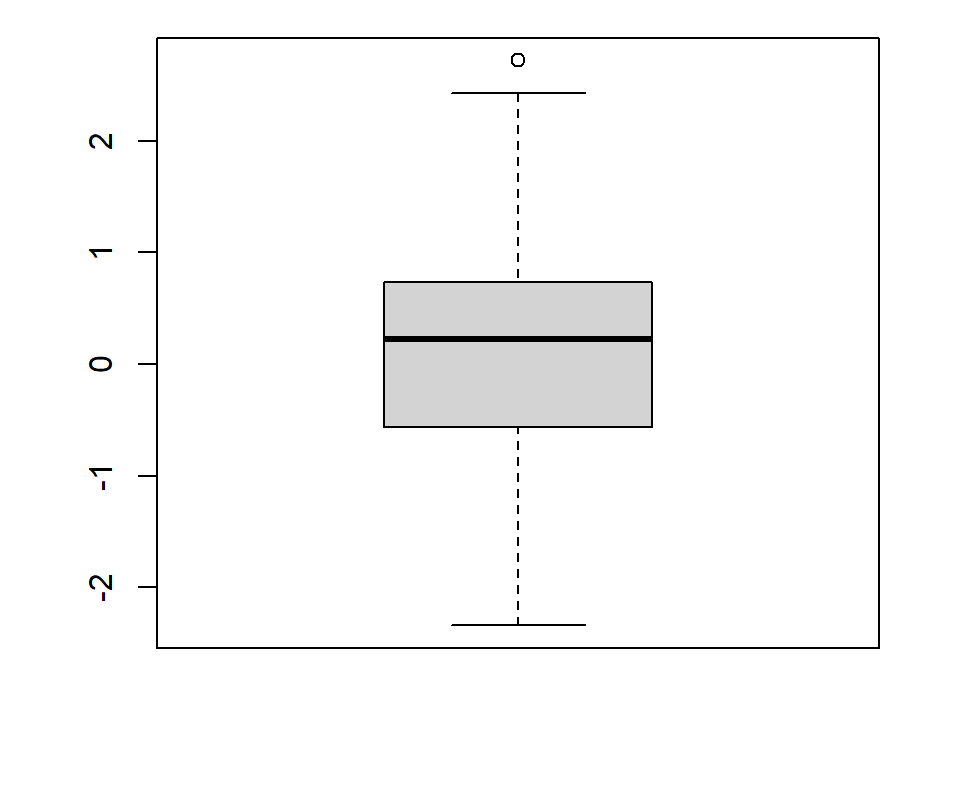
Horizontal
The horizontal argument can be set to TRUE to create a horizontal box plot. The default is vertical.
set.seed(7)
x <- rnorm(200)

boxplot(x, horizontal = TRUE)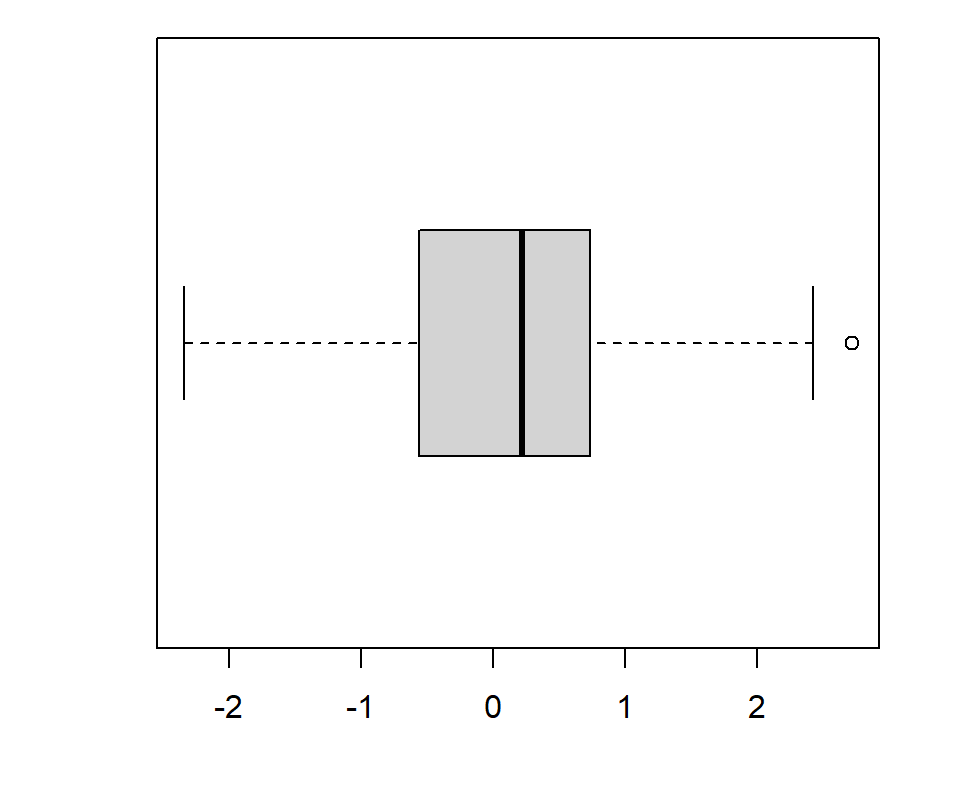
Confidence interval (notch)
The function also provides the argument notch to add the 95% confidence interval for the median. This is particular interesting for checking if there are evidences that the medians of several box plots differ or not.
set.seed(7)
x <- rnorm(200)

boxplot(x, notch = TRUE)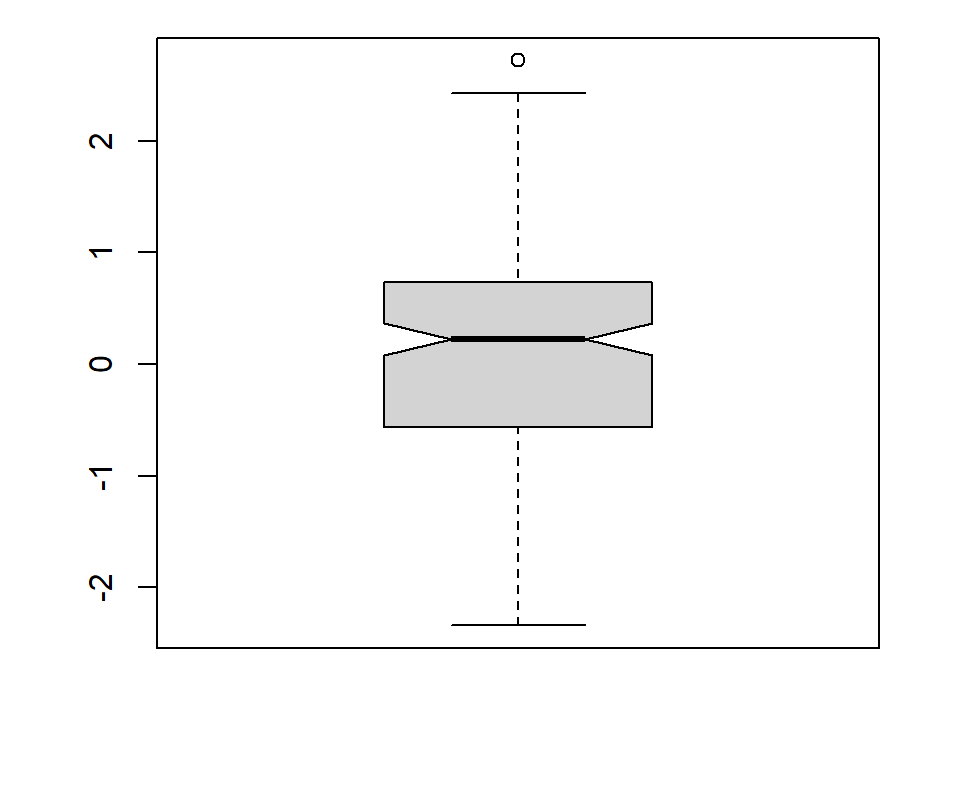
Fill color
The col argument fills the box with a color. In the following example we are adding a color with transparency making use of the rgb function.
set.seed(7)
x <- rnorm(200)

boxplot(x, col = rgb(0, 0.5, 1, alpha = 0.5))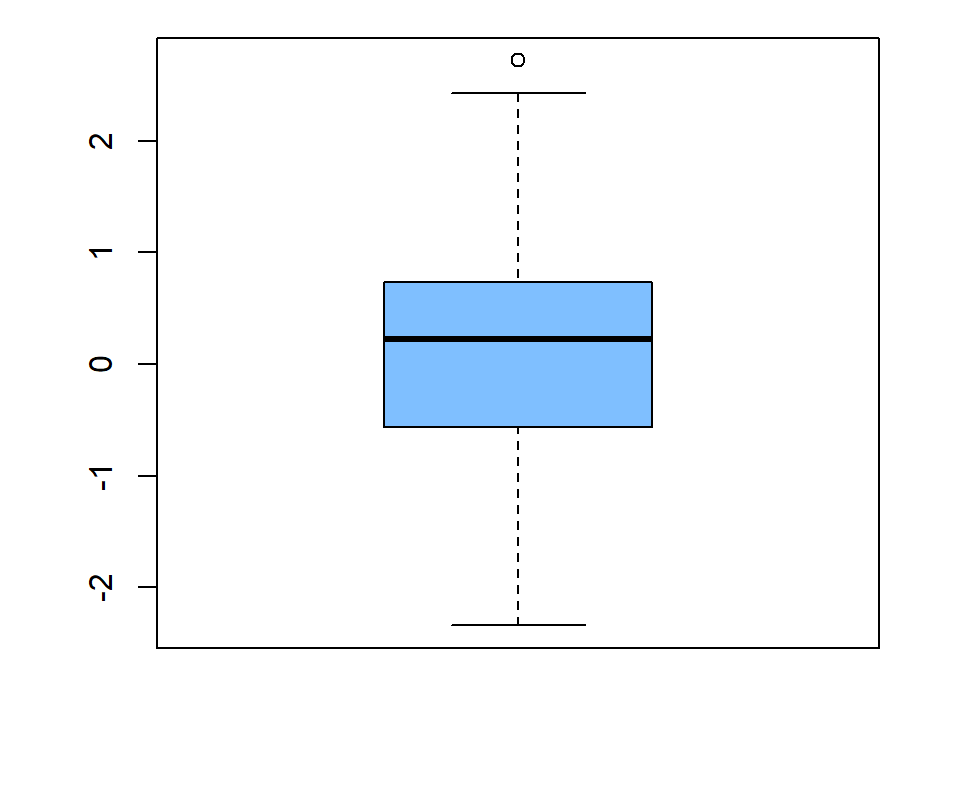
Border color
You can also change the color of the border of the whole box plot with border.
set.seed(7)
x <- rnorm(200)

boxplot(x, col = "white",
        border = 4)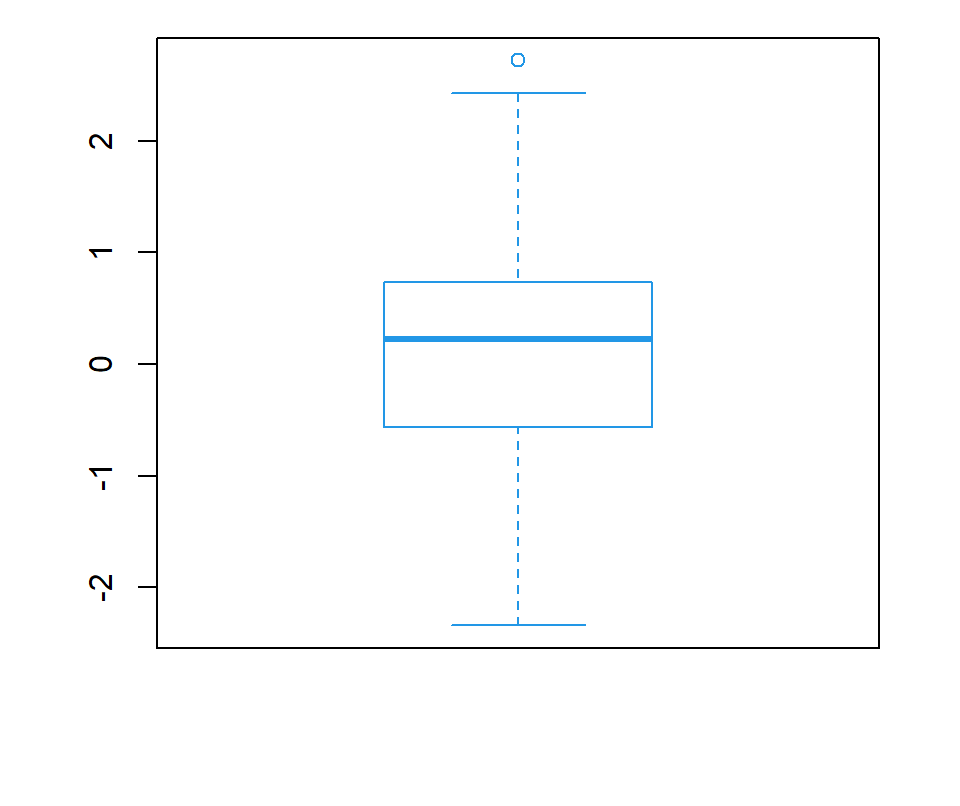
Box line type
The lty argument controls the line type of all the lines of the box plot.
set.seed(7)
x <- rnorm(200)

boxplot(x, col = "white",
        lty = 2)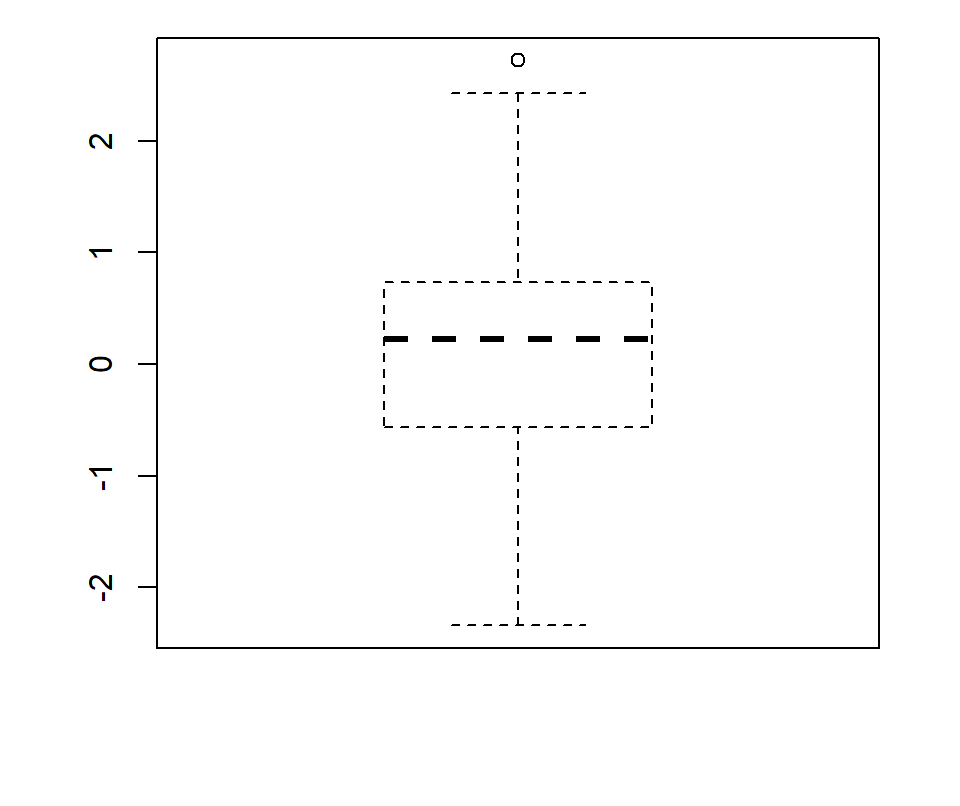
Further customization
The function allows customizing each color and each line individually. Most of the arguments below are part of the bxp function, which is called by boxplot.
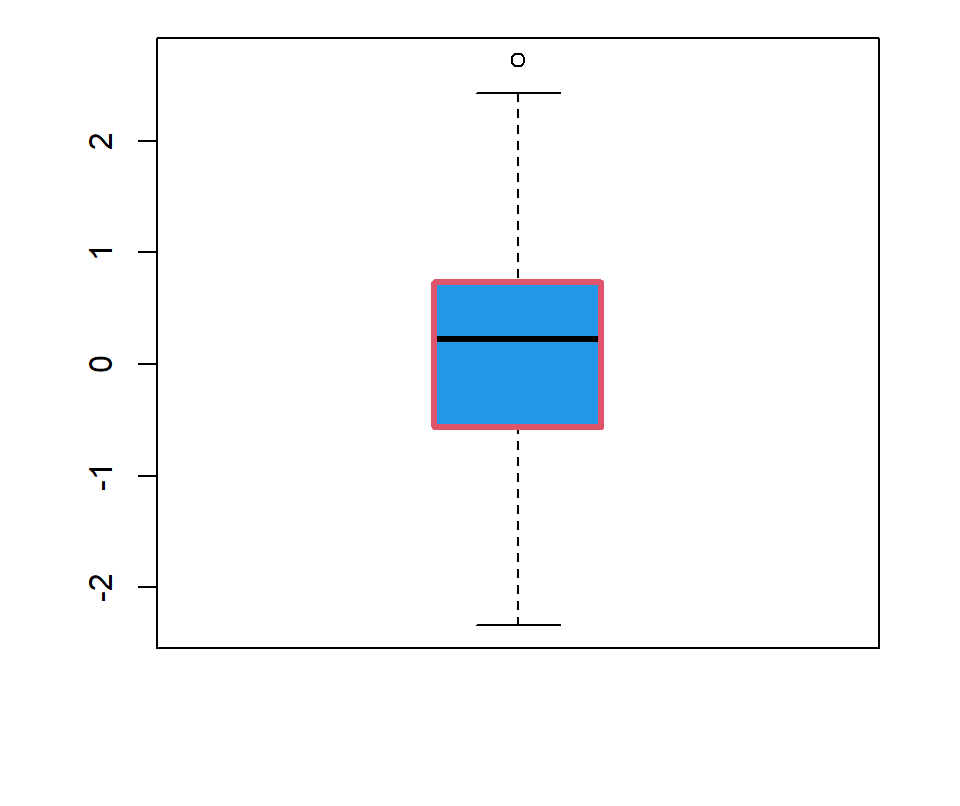
Box customization
set.seed(7)
x <- rnorm(200)

boxplot(x,
        boxwex = 0.5, # Box width
        boxlty = 1,   # Box line type
        boxlwd = 3,   # Box line width
        boxcol = 2,   # Box border color
        boxfill = 4)  # Box fill color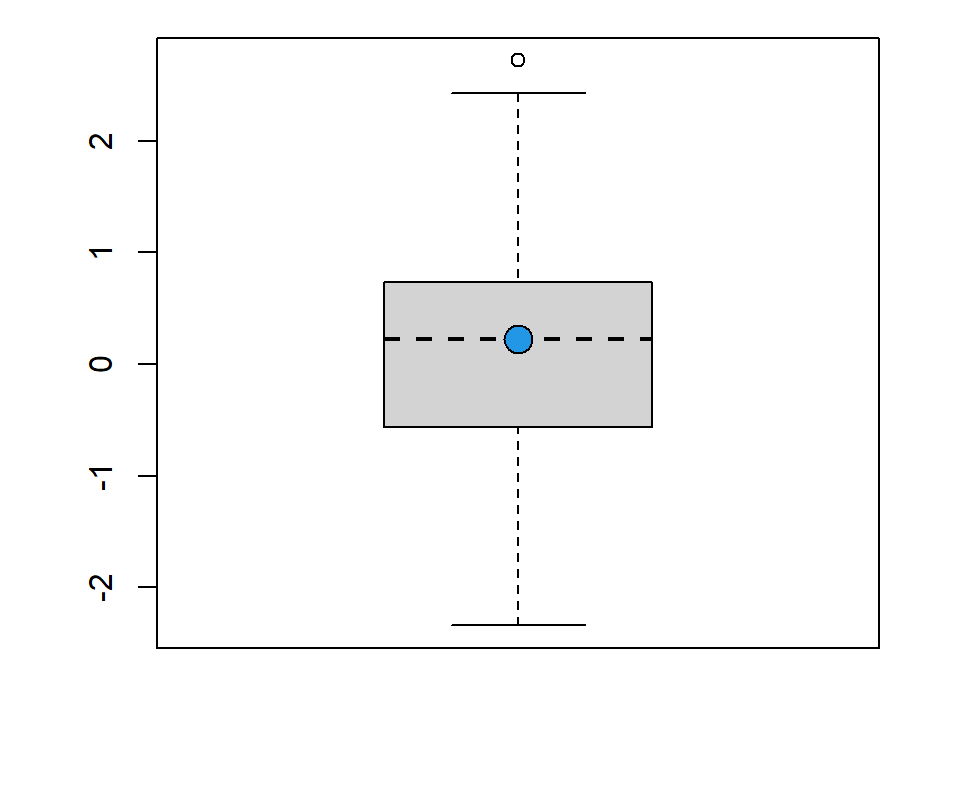
Median line customization
set.seed(7)
x <- rnorm(200)

boxplot(x,
        medlty = 2,  # Line type of the median
        medlwd = 2,  # Line width of the median
        medpch = 21, # pch symbol of the point
        medcex = 2,  # Size of the point
        medcol = 1,  # Color of the line
        medbg = 4)   # Color of the pch (21 to 25)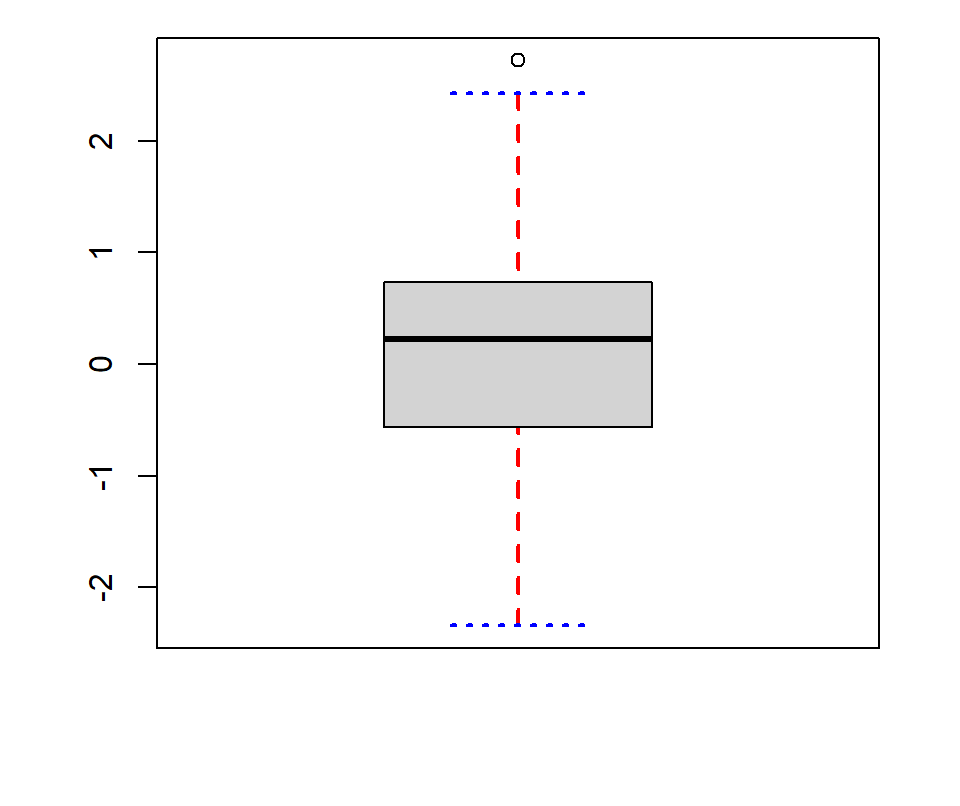
Whiskers and staple customization
set.seed(7)
x <- rnorm(200)

boxplot(x,
        whisklty = 2,       # Line type of the whiskers
        whisklwd = 2,       # Line width of the whiskers
        whiskcol = "red",   # Color of the whiskers
        staplelty = 3,      # Line type of the staples
        staplelwd = 2,      # Line width of the staples
        staplecol = "blue") # Color of the staples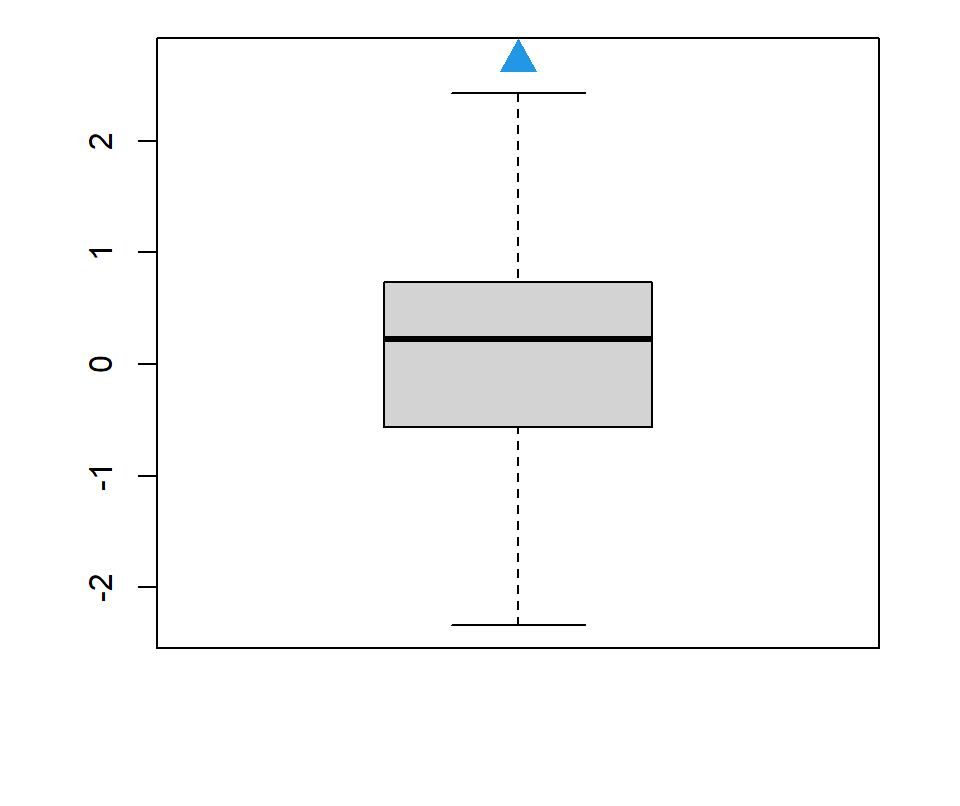
Outliers customization
set.seed(7)
x <- rnorm(200)

boxplot(x,
        outlty = 0,  # Line type
        outlwd = 1,  # Line width
        outpch = 23, # Pch for the outliers
        outcex = 2,  # Size of the outliers
        outcol = 1,  # Color
        outbg = 4)   # bg color (pch 21 to 25)
Master Statistics
Learn statistics from the basics to advanced techniques, clearly explained
Go to site