Fill area under the density curve
The polygon function can be used to shade the area under the density curve. You just need to pass the density object to it and specify a color.
# Data
set.seed(3)
y <- rnorm(150)

den <- density(y)

# Plot
plot(den)

# Fill area
polygon(den, col = "slateblue1")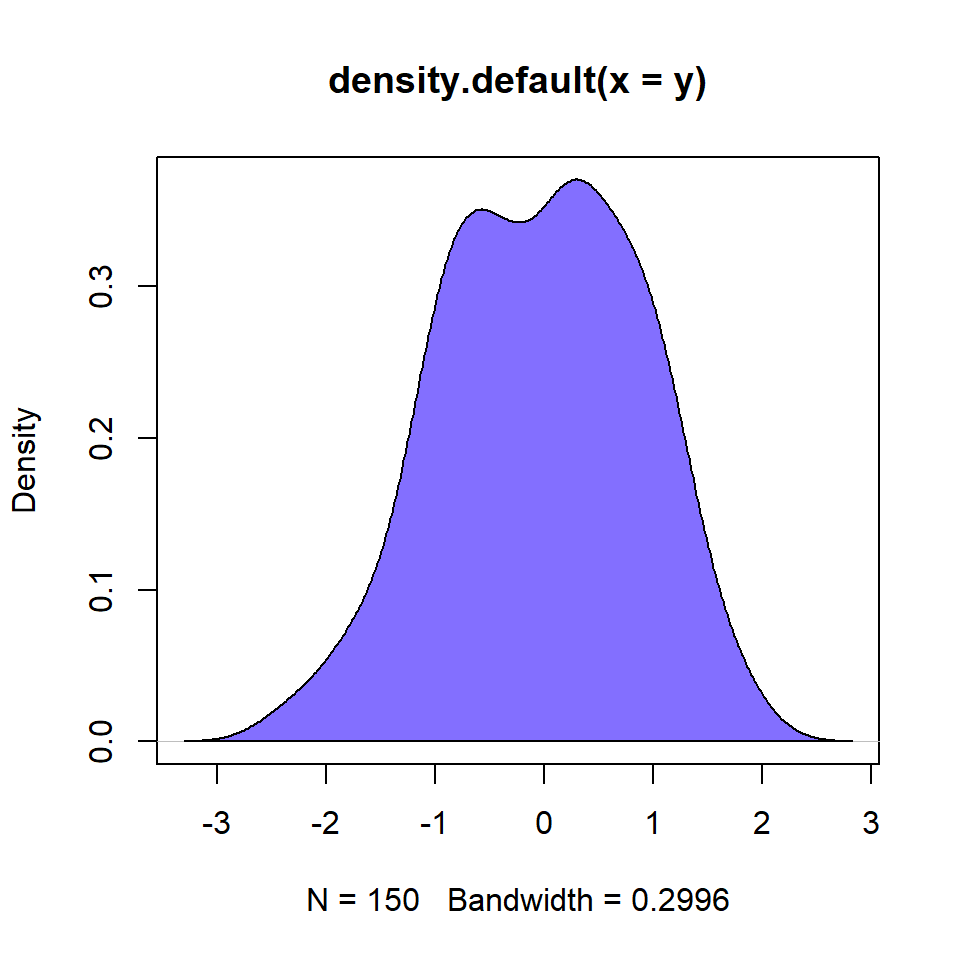
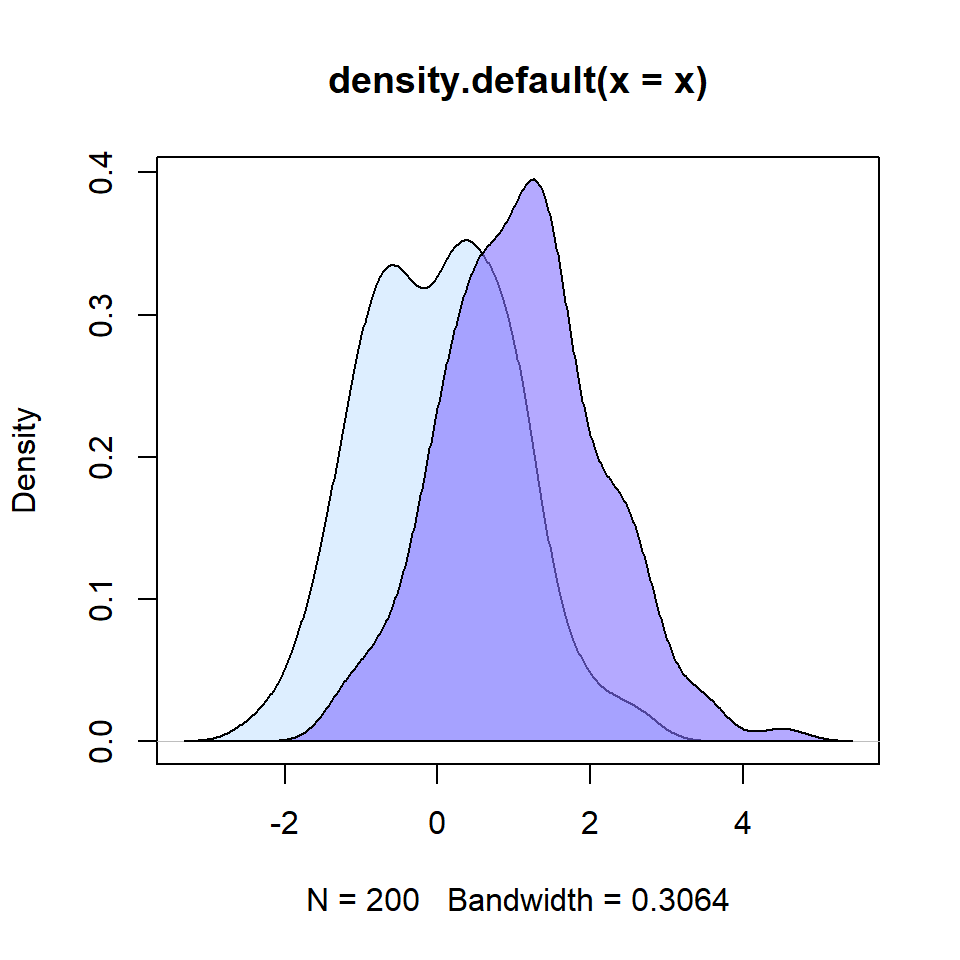
Fill density area with transparency
If you are plotting several density curves and some of them overlap it is recommended to use colors with transparency, so you will be able to see both curves. For this purpose you can use the rgb function and specify the transparency (between 0 and 1) in the alpha argument. See colors section if you need to convert HEX colors to RGB.
# Data
set.seed(3)
x <- rnorm(200)
y <- rnorm(150, mean = 1)

# Density estimations
denx <- density(x)
deny <- density(y)

# Plot
plot(denx,
     ylim = c(0, max(c(denx$y, deny$y))),
     xlim = c(min(c(denx$x, deny$x)),
              max(c(denx$x, deny$x))))
lines(deny)

# Fill the areas
polygon(denx, col = rgb(0.78, 0.89, 1, alpha = 0.6))
polygon(deny, col = rgb(0.51, 0.44, 1, alpha = 0.6))
Fill specific area under the density curve
You can also fill some specific areas under the curves, such as the area greater than a specific point, the area lower than a point or the area between two points.
Fill area for values greater than 1
# Data
set.seed(3)
y <- rnorm(150)

# Density estimation
den <- density(y)

# Plot
plot(den)

# Fill area for values greater or equal to 1
value <- 1

polygon(c(den$x[den$x >= value ], value),
        c(den$y[den$x >= value ], 0),
        col = "slateblue1",
        border = 1)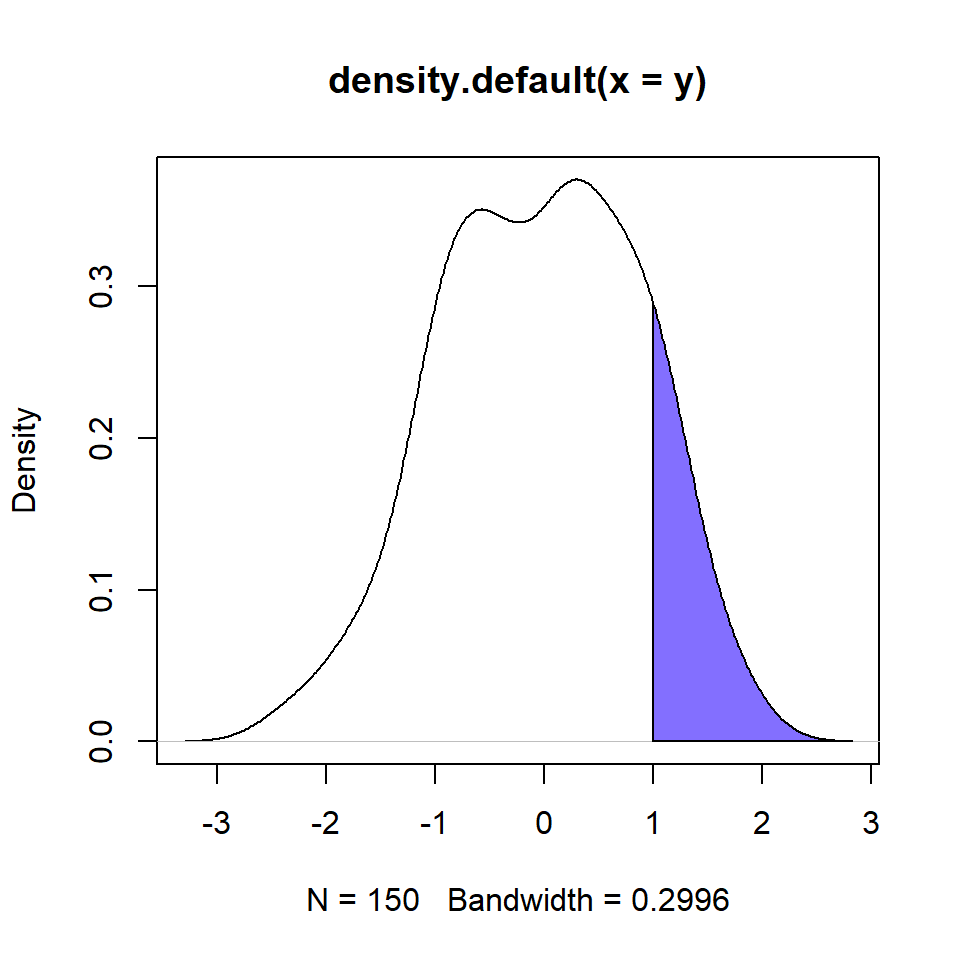
Fill area for values lower than 1
# Data
set.seed(3)
y <- rnorm(150)

# Density estimation
den <- density(y)

# Plot
plot(den)

# Fill area for values lower or equal to 1
value <- 1

polygon(c(den$x[den$x >= value ], value),
        c(den$y[den$x >= value ], 0),
        col = "slateblue1",
        border = 1)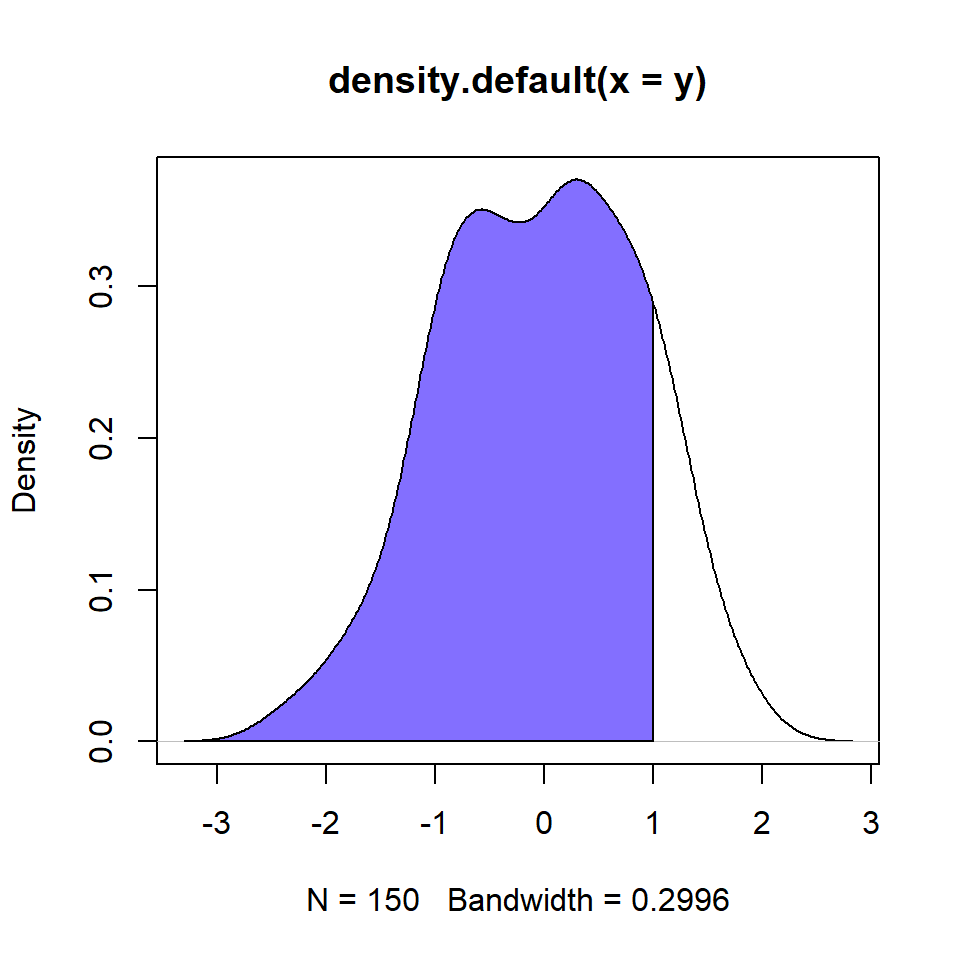
Fill area for values between -1 and 1
# Data
set.seed(3)
y <- rnorm(150)

# Density estimation
den <- density(y)

# Plot
plot(den)

# Area between -1 and 1
value1 <- -1
value2 <- 1

# Lower and higher indices on the X-axis
l <- min(which(den$x >= value1))
h <- max(which(den$x < value2))

polygon(c(den$x[c(l, l:h, h)]),
        c(0, den$y[l:h], 0),
        col = "slateblue1")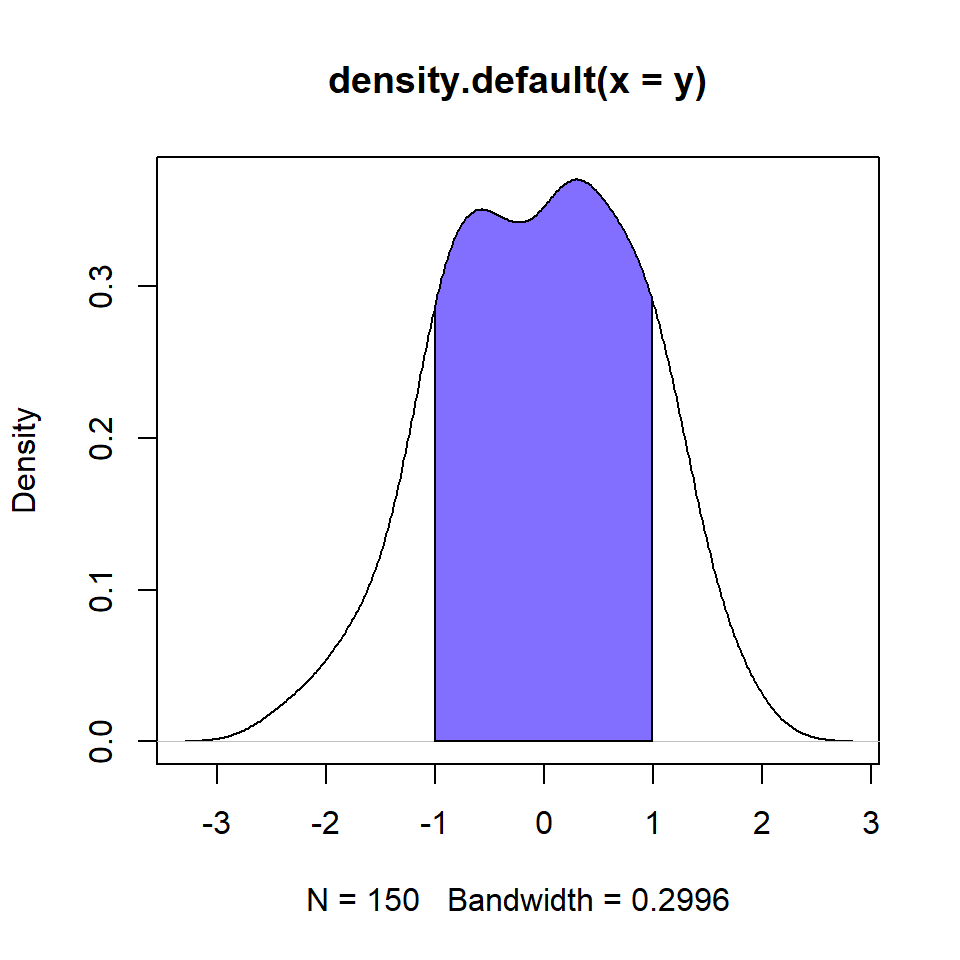

Master Statistics
Learn statistics from the basics to advanced techniques, clearly explained
Go to site