It is possible to create side by side violin plots. For that purpose you will need to split your data and create a violin plot with the vioplot function where each side represents each subgroup of data.
Sample data
Consider the trees data set, which contains three numerical variables giving the girth, height and volume of some trees.
# Sample data set
df <- trees
Side by side comparison
Split the sample data in two groups, where the first corresponds to the trees which volume is greater than the mean of the volume and the other where the mean volume is lower.
Then, plot each violin plot specifying the side you want to plot with side argument. You will need to set add = TRUE on the second violin, so the new plot is added to the previous.
Note that we used plotCentre = "line", so the mean is displayed as a horizontal line, which is the recommended workflow for this type of violin plots.
# install.packages("vioplot")
library("vioplot")

# Split the data in two groups
big_vol <- df[df$Volume >= mean(df$Volume), ]
small_vol <- df[df$Volume < mean(df$Volume), ]

# Plot each side and join them
vioplot(big_vol,
        plotCentre = "line", # Median with a line
        side = "right",   # Right side
        col = "#5773CC")  # Color for the right side
vioplot(small_vol,
        plotCentre = "line", # Median with a line
        side = "left",     # Left side
        col = "#FFB900",   # Color for the left side
        add = TRUE)        # Add it to the previous plot

legend("topleft",
       legend = c("Big", "Small"),
       fill = c("#5773CC", "#FFB900"))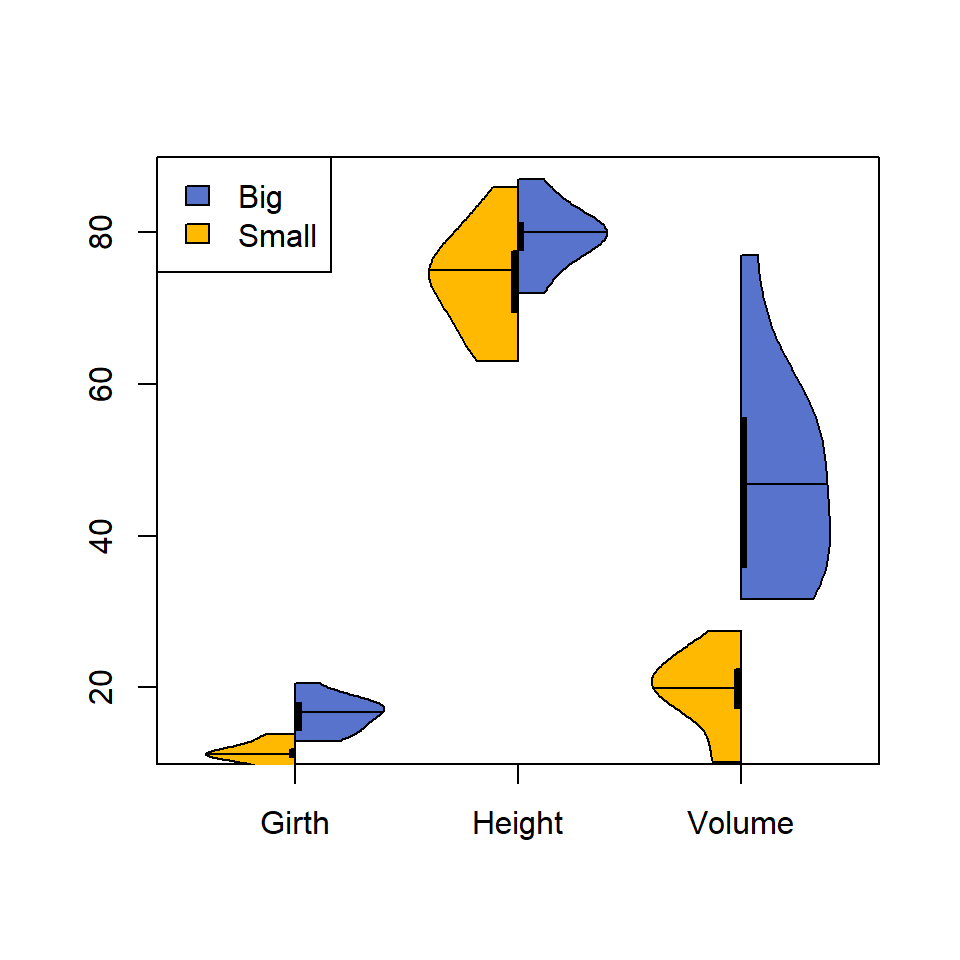
Despite not recommended, you can also show the median as a point as in the default violin plot. If you want to use this option recall that you can change the color of the point with the argument colMed.
# install.packages("vioplot")
library("vioplot")

# Split the data in two groups
big_vol <- df[df$Volume >= mean(df$Volume), ]
small_vol <- df[df$Volume < mean(df$Volume), ]

# Plot each side and join them
vioplot(big_vol,
        colMed = "green", # Color of the median point
        side = "right",   # Right side
        col = "#5773CC")  # Color for the right side
vioplot(small_vol,
        colMed = "green", # Color of the median point
        side = "left",    # Left side
        col = "#FFB900",  # Color for the left side
        add = TRUE)       # Add it to the previous plot

legend("topleft",
       legend = c("Big", "Small"),
       fill = c("#5773CC", "#FFB900"))

Master Statistics
Learn statistics from the basics to advanced techniques, clearly explained
Go to site