A histogram can be created in R with the hist function. By default a frequency histogram will be created, but you can create a density histogram setting prob = TRUE. A box plot can be created with the boxplot function.
# Sample data
set.seed(5)
x <- rnorm(400)

# Histogram
hist(x, prob = TRUE)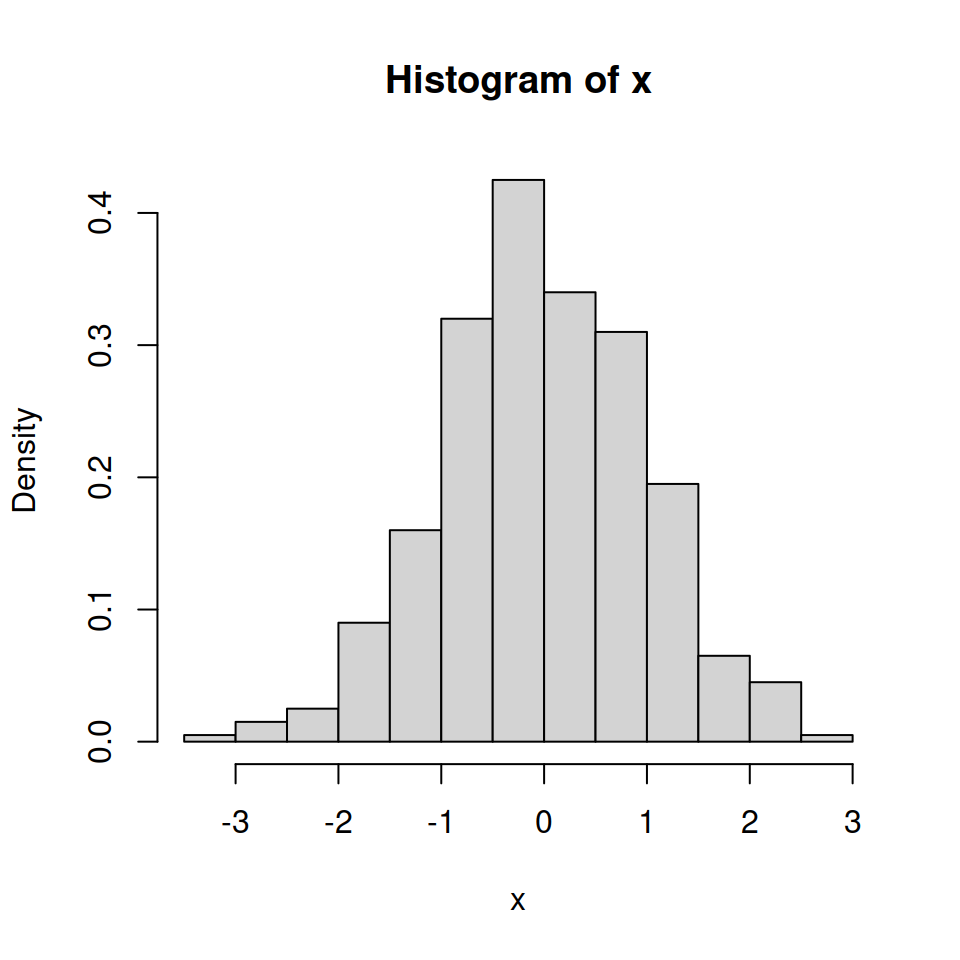
Histogram and boxplot
Sometimes it is interesting to overlay a box plot over a histogram. For that purpose you will need to use par(new = TRUE) to add a plot over the previous, removing the axes of the box plot with axes = FALSE, setting it horizontal with horizontal = TRUE and using a color with transparency making use of rgb to avoid hiding the histogram.

Box plot over an histogram
# Histogram
hist(x, prob = TRUE,
     col = "white",
     main = "")

# Add new plot
par(new = TRUE)

# Box plot
boxplot(x, horizontal = TRUE, axes = FALSE,
        col = rgb(0, 0.8, 1, alpha = 0.5))

# Box around the plots
box()
Master Statistics
Learn statistics from the basics to advanced techniques, clearly explained
Go to site