Sample data
In this tutorial we are going to use the following data frame, which first column is as numerical variable and the second a categorical variable representing groups.
# Sample dataset
set.seed(136)
df <- data.frame(y = rnorm(300),
                 group = sample(LETTERS[1:3],
                                size = 300,
                                replace = TRUE))
Box plot by group with geom_boxplot
In order to create a basic grouped box plot in R you need to pass the variables to aes and use the geom_boxplot geom as in the following example.
# install.packages("ggplot2")
library(ggplot2)

# Box plot by group
ggplot(df, aes(x = group, y = y)) +
  geom_boxplot()
Adding error bars with stat_boxplot
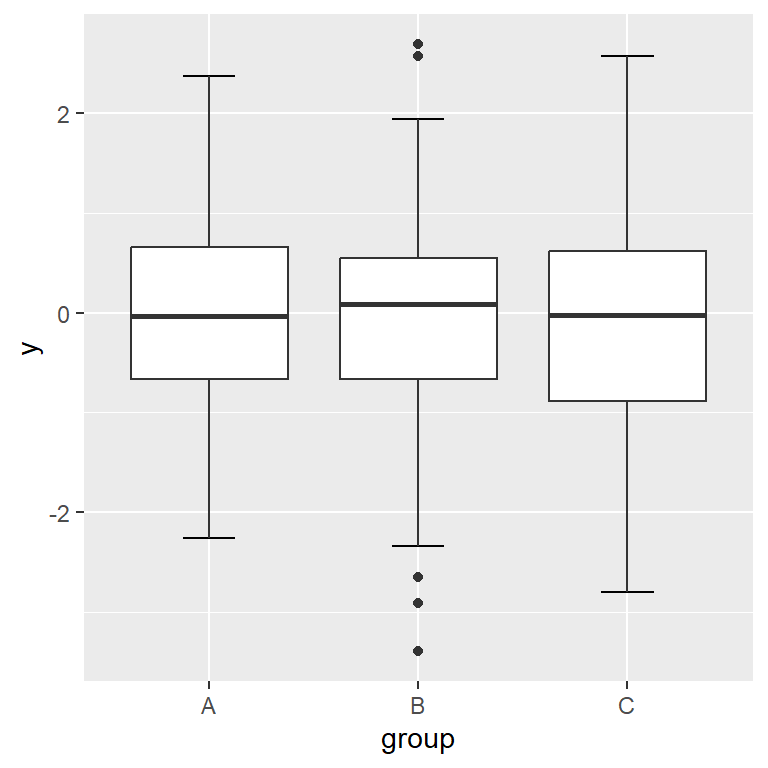
As you may have noticed, the default box plot in ggplot2 doesn’t add error bars. If you want to add them use the stat_boxplot stat and set geom = "errorbar". The width of the bars can be customized with width argument.
# install.packages("ggplot2")
library(ggplot2)

# Box plot by group with error bars
ggplot(df, aes(x = group, y = y)) +
  stat_boxplot(geom = "errorbar", # Error bars
               width = 0.25) +    # Bars width
  geom_boxplot()
Horizontal box plot by group
The box plots can also be displayed in horizontal or landscape mode. To accomplish it you can change the order of your variables inside aes or use coord_flip, as shown above.
Option 1: change the order of the variables
Set the grouping variable on the Y-axis.
# install.packages("ggplot2")
library(ggplot2)

# Horizontal box plot in ggplot2
ggplot(df, aes(x = y, y = group)) +
  stat_boxplot(geom = "errorbar",
               width = 0.25) +
  geom_boxplot()
Option 2: use coord_flip
coord_flip will invert the axes, so a vertical box plot will become horizontal and viceversa.
# install.packages("ggplot2")
library(ggplot2)

# Horizontal box plot
ggplot(df, aes(x = group, y = y)) +
  stat_boxplot(geom = "errorbar",
               width = 0.25) +
  geom_boxplot() +
  coord_flip()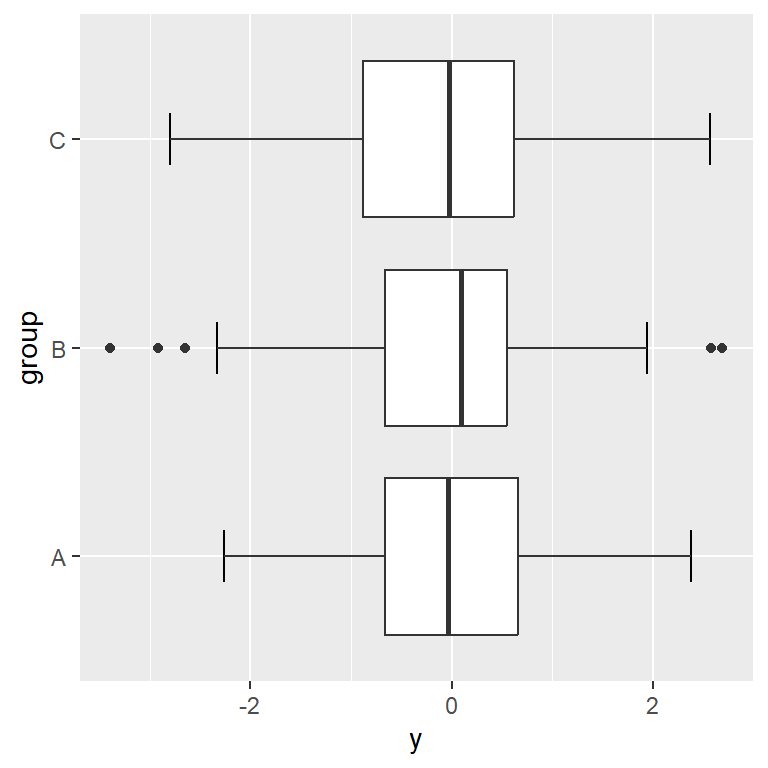
Color customization

If you pass the categorical variable to the fill argument of aes, each box plot will be filled with a color and a legend will be displayed.
# install.packages("ggplot2")
library(ggplot2)

ggplot(df, aes(x = group, y = y, fill = group)) +
  stat_boxplot(geom = "errorbar",
               width = 0.25) +
  geom_boxplot()
The colors or the box plots are fully customizable. In the following example we are setting a fill color for each group, changing the border color of the boxes and setting the color of the outliers to black.

# install.packages("ggplot2")
library(ggplot2)

# Fill colors
cols <- c("#CFD8DC", "#90A4AE", "#455A64")

ggplot(df, aes(x = group, y = y, fill = group)) +
  stat_boxplot(geom = "errorbar",
               width = 0.25) +
  geom_boxplot(alpha = 0.8,          # Fill transparency
               colour = "#474747",   # Border color
               outlier.colour = 1) + # Outlier color
  scale_fill_manual(values = cols)   # Fill colors
Legend customization
Change the title
You can change the default title of the legend with guides function as follows.
# install.packages("ggplot2")
library(ggplot2)

ggplot(df, aes(x = group, y = y, fill = group)) +
  stat_boxplot(geom = "errorbar", width = 0.25) +
  geom_boxplot() +
  guides(fill = guide_legend(title = "Title"))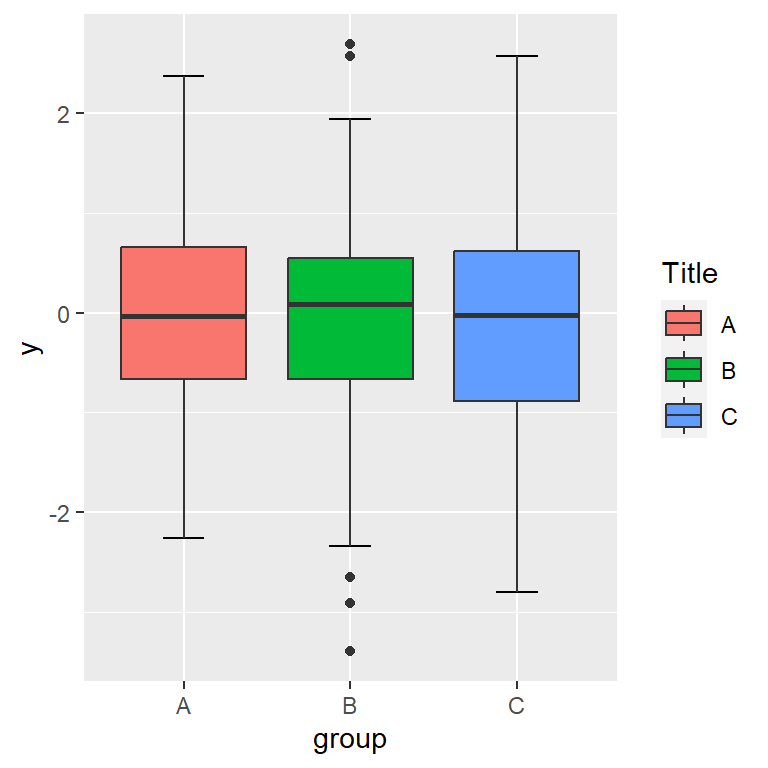
Change the labels
The legend labels are the levels of the categorical variable. You can override them with scale_fill_hue.
# install.packages("ggplot2")
library(ggplot2)

ggplot(df, aes(x = group, y = y, fill = group)) +
  stat_boxplot(geom = "errorbar", width = 0.25) +
  geom_boxplot() +
  scale_fill_hue(labels = c("G1", "G2", "G3"))
Remove the legend
If you don’t want any legend displayed you can remove it with theme(legend.position = "none").
# install.packages("ggplot2")
library(ggplot2)

ggplot(df, aes(x = group, y = y, fill = group)) +
  stat_boxplot(geom = "errorbar", width = 0.25) +
  geom_boxplot() +
  theme(legend.position = "none")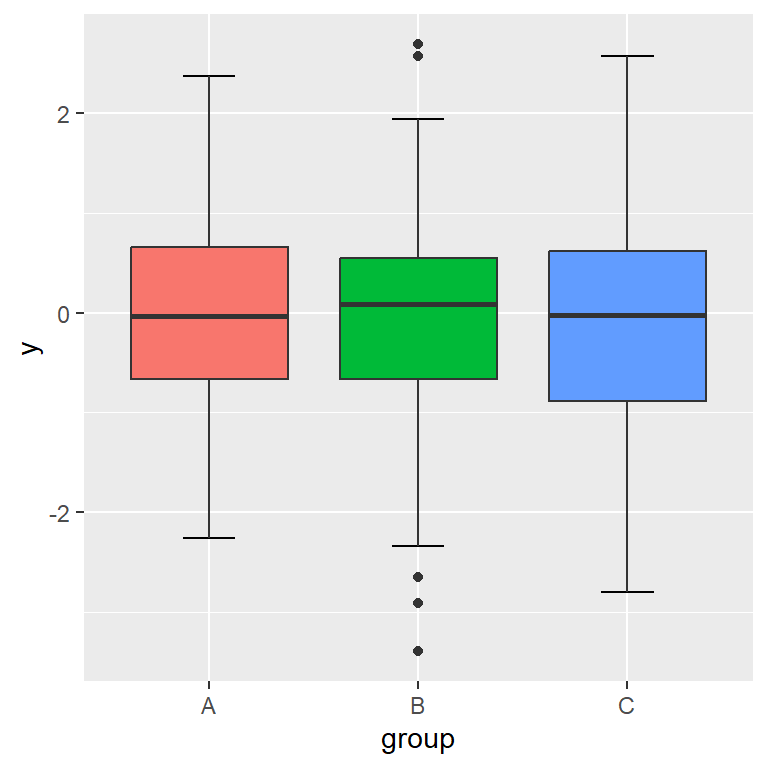

Master Statistics
Learn statistics from the basics to advanced techniques, clearly explained
Go to site