Default ggplot2 and base R histograms
The default histograms in ggplot2 and in base R are different, as ggplot2 uses 30 bins by default while base R hist function uses the Sturges method to calculate the number of bins.
As you can see, the ggplot2 histograms tend to be too binned due to this default. You can change the bin width or the number of bins to the desired value.
# install.packages("ggplot2")
library(ggplot2)

# Data
set.seed(3)
x <- rnorm(450)
df <- data.frame(x)

# Default histogram ggplot2
ggplot(df, aes(x = x)) +
  geom_histogram()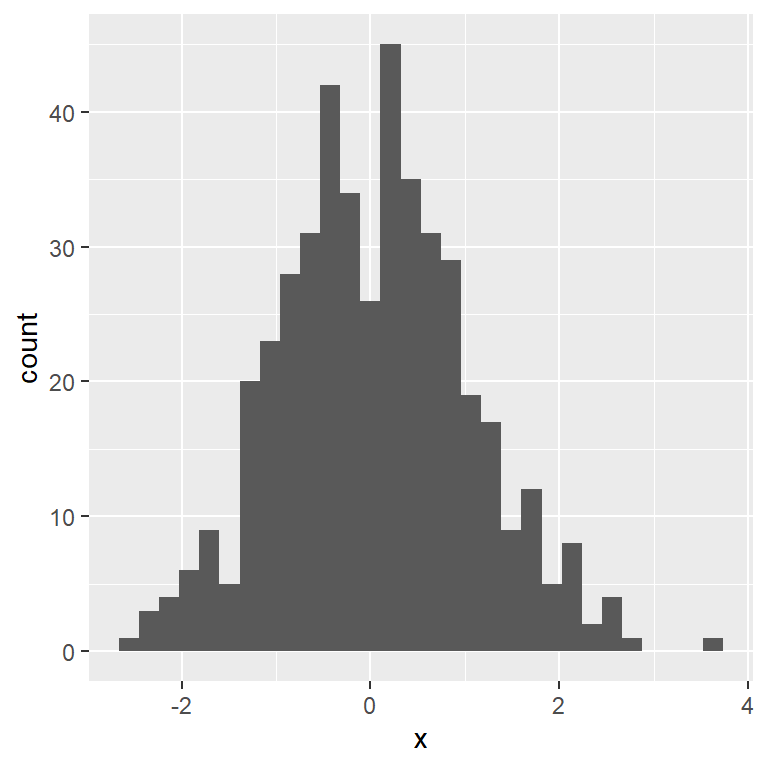
The default histogram with hist function seems to be more appropriate, as the Sturges method is computed.
# Data
set.seed(3)
x <- rnorm(450)
df <- data.frame(x)

# Default histogram base R
hist(x)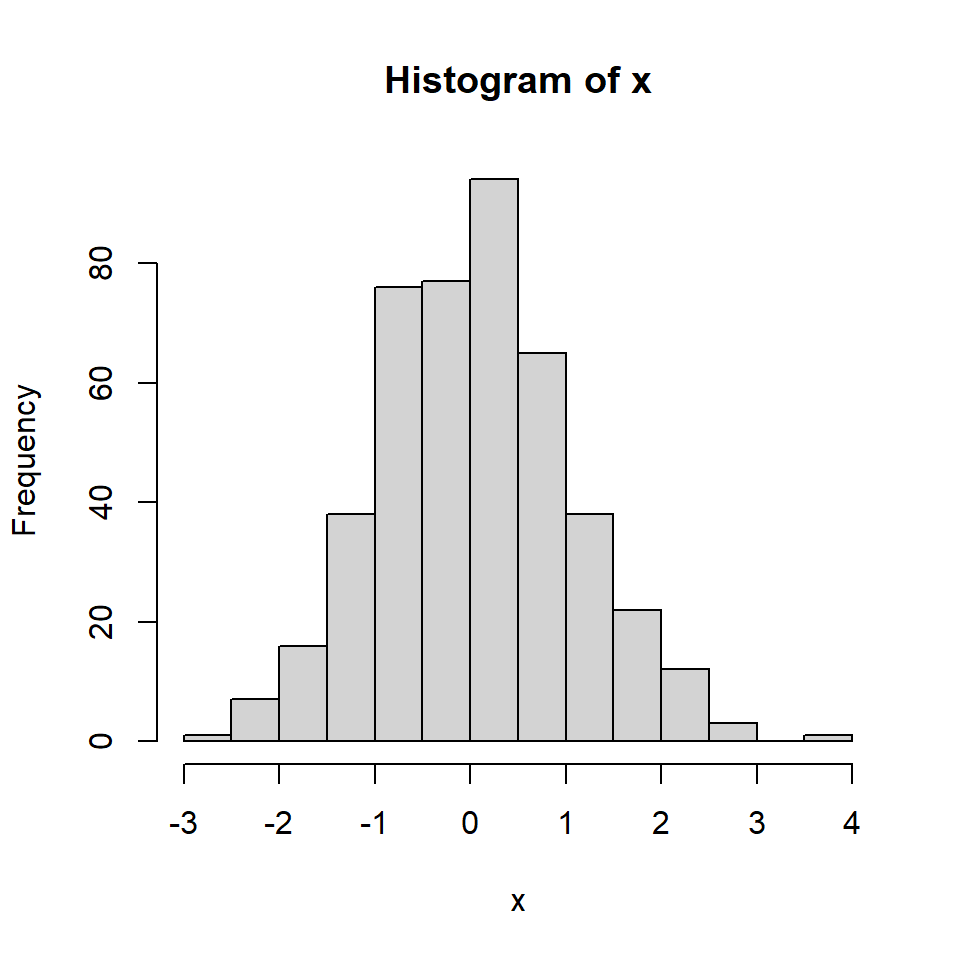
Sturges method
If you want to create a histogram in ggplot2 which uses the Sturges method you can calculate the breaks as follows and pass them to the breaks argument.

# install.packages("ggplot2")
library(ggplot2)

# Data
set.seed(3)
x <- rnorm(450)
df <- data.frame(x)

# Calculating the Sturges bins
breaks <- pretty(range(x),
                 n = nclass.Sturges(x),
                 min.n = 1)
df$breaks <- breaks

# Histogram with Sturges method
ggplot(df, aes(x = x)) +
  geom_histogram(color = 1, fill = "white",
                 breaks = breaks) +
  ggtitle("Sturges method")
Master Statistics
Learn statistics from the basics to advanced techniques, clearly explained
Go to site