Sample data
Creating a box plot by group in base R is very straightforward. In this tutorial we are going to use the following data set:
# Sample dataset
set.seed(136)
data <- data.frame(x = rnorm(300),
                   group = sample(LETTERS[1:3],
                                  size = 300,
                                  replace = TRUE))
Box plot for multiple groups
In order to create a box plot by group in R you can pass a formula of the form y ~ x, being x a numerical variable and y a categoriacal variable to the boxplot function.
Option 1
You can pass the variables accessing the data from the data frame using the dollar sign or subsetting the data frame. This approach is specially useful if your data is in two separated vectors.
boxplot(data$x ~ data$group)

# Equivalent to:
boxplot(data[, 1] ~ data[, 2])

# Equivalent to:
x <- data$x
y <- data$group
boxplot(x ~ y)
Option 2
Another option is passing your data frame to the data argument, so you will be able to specify only the names of the variables inside your data set.
boxplot(x ~ group, data = data)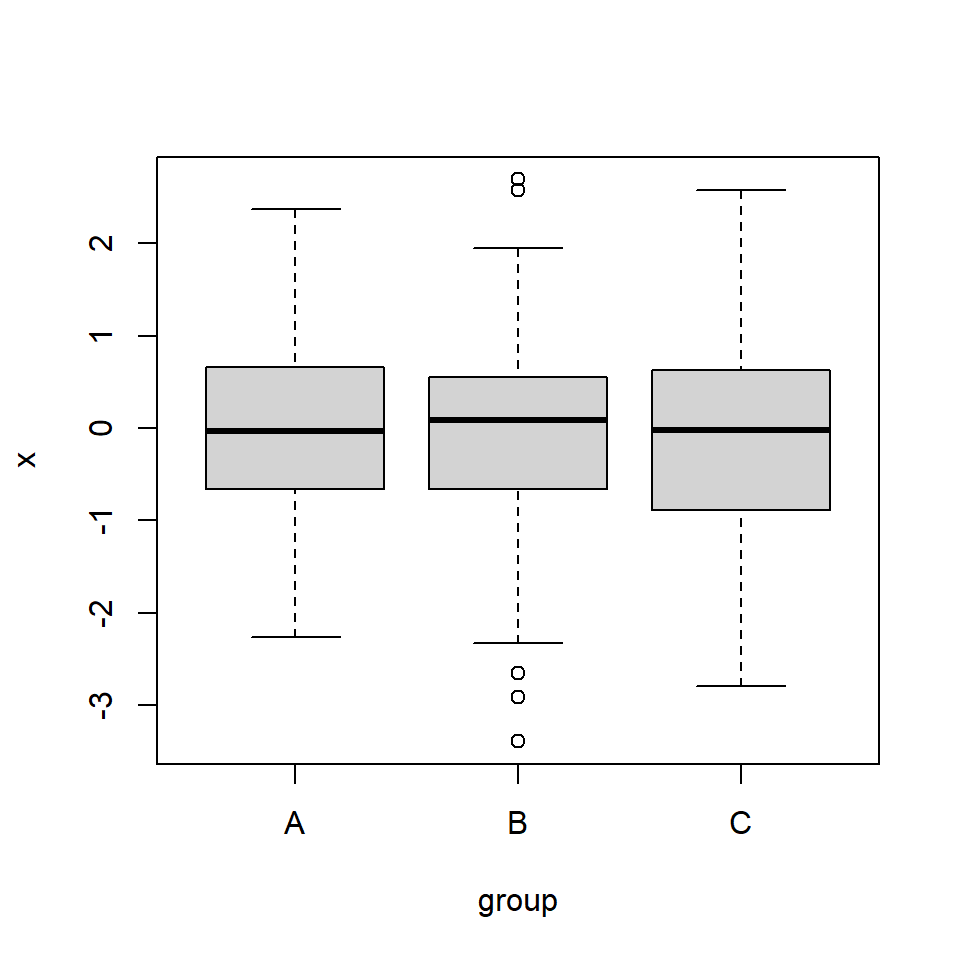
Box plot color by group

The boxplot function contains an argument named col where you can specify a vector of colors of the same length of the number of groups. See colors or palettes to choose your colors or the palette generator to create your own palettes.
boxplot(x ~ group, data = data,
        col = c("#FFE0B2", "#FFA726", "#F57C00"))
Master Statistics
Learn statistics from the basics to advanced techniques, clearly explained
Go to site