Sample data
The following data frame contains a column with two normal distributions with different mean and same variance and a categorical variable representing which observations belong to each distribution.
set.seed(3)
x1 <- rnorm(500)
x2 <- rnorm(500, mean = 3)
x <- c(x1, x2)
group <- c(rep("G1", 500), rep("G2", 500))

df <- data.frame(x, group = group)
Grouped histogram with geom_histogram
Fill
In order to create a histogram by group in ggplot2 you will need to input the numerical and the categorical variable inside aes and use geom_histogram as follows.
# install.packages("ggplot2")
library(ggplot2)

# Histogram by group in ggplot2
ggplot(df, aes(x = x, fill = group)) +
  geom_histogram()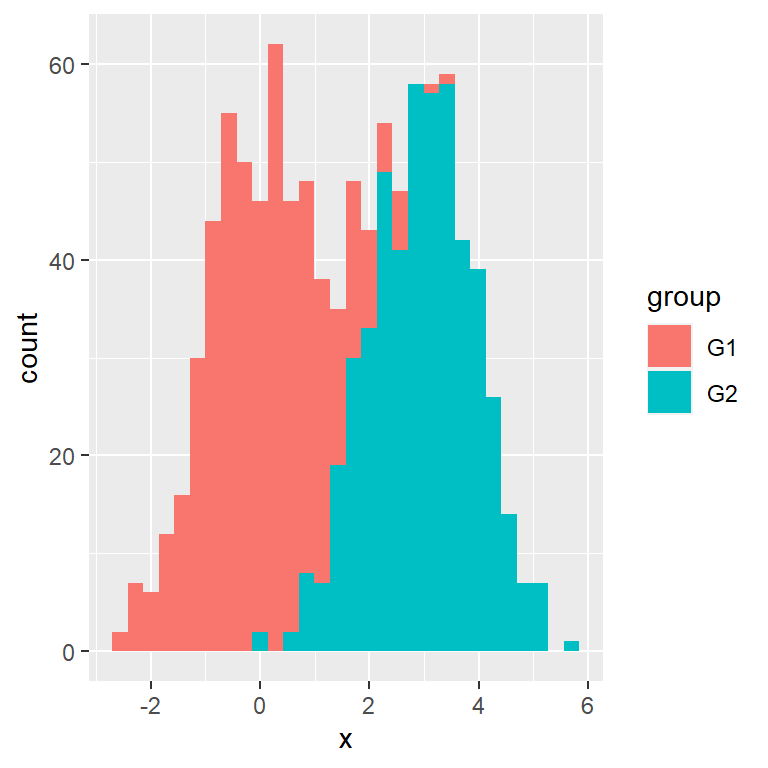
Colour
You can also set the categorical variable to the colour argument, so the border lines of each histogram will have a different color.
# install.packages("ggplot2")
library(ggplot2)

# Histogram by group in ggplot2
ggplot(df, aes(x = x, colour = group)) +
  geom_histogram()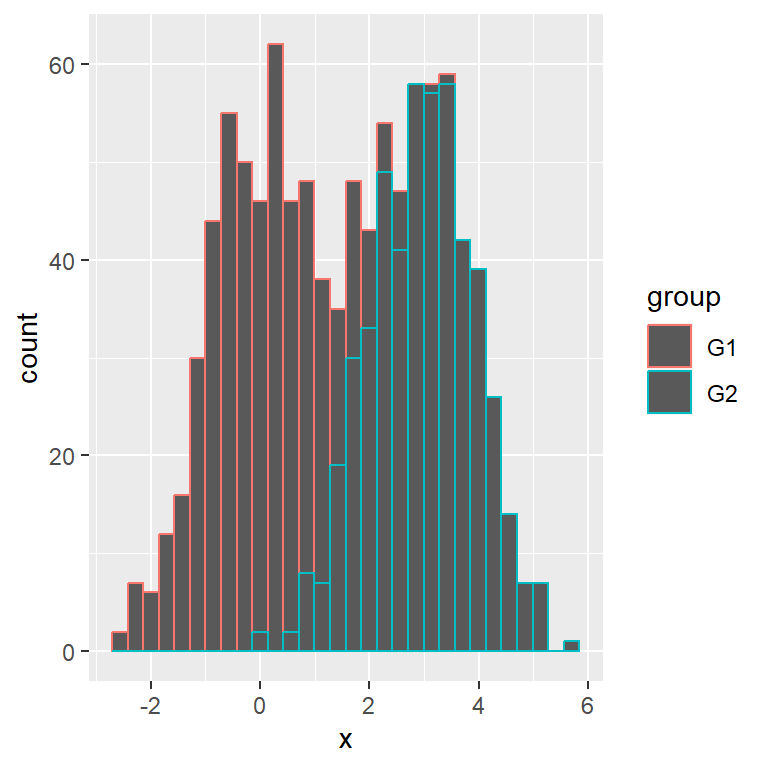
By default, if the histograms overlap, the values will be stacked. Another approach is changing the position to identity (and setting transparency) or dodge as in the following examples.
identity position
Setting position = "identity" is the most common use case, but recall to set a level of transparency with alpha so both histograms are completely visible.
# install.packages("ggplot2")
library(ggplot2)

# Histogram by group in ggplot2
ggplot(df, aes(x = x, fill = group, colour = group)) +
  geom_histogram(alpha = 0.5, position = "identity")
dodge position
Other option is using position = "dodge", which will add an space between each bar so you will be able to see both histograms.
# install.packages("ggplot2")
library(ggplot2)

# Histogram by group in ggplot2
ggplot(df, aes(x = x, fill = group, colour = group)) +
  geom_histogram(position = "dodge")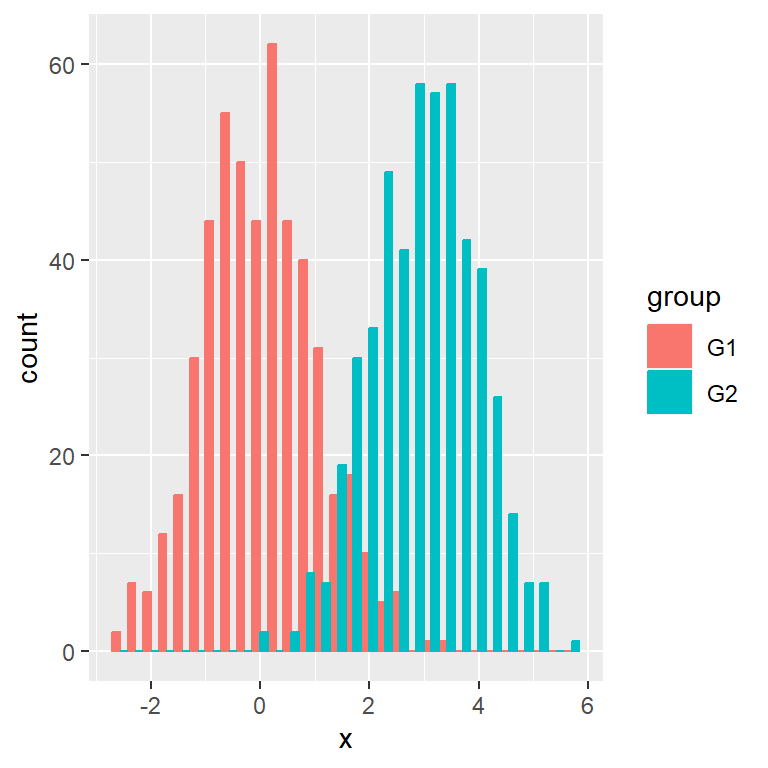
Histogram by group with custom colors

Borders color
If you set fill inside aes but not colour you can change the border color of all histograms as well as its width and linetype with geom_histogram arguments.
# install.packages("ggplot2")
library(ggplot2)

# Histogram by group in ggplot2
ggplot(df, aes(x = x, fill = group)) +
  geom_histogram(colour = "black",
                 lwd = 0.75,
                 linetype = 1,
                 position = "identity")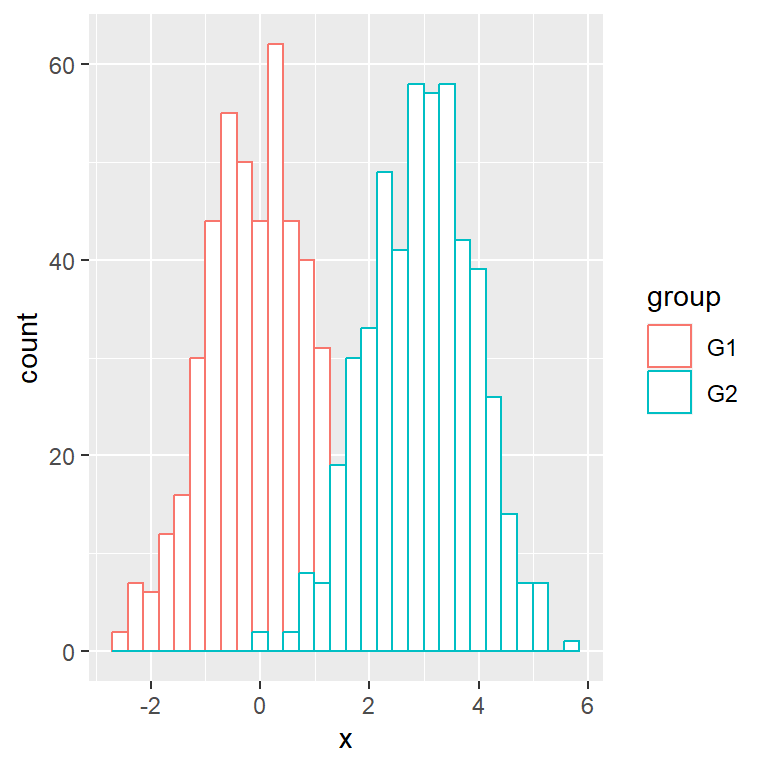
Fill color
If you set colour but not fill you can change the fill color of all histograms with the fill argument of geom_histogram.
# install.packages("ggplot2")
library(ggplot2)

# Histogram by group in ggplot2
ggplot(df, aes(x = x, colour = group)) +
  geom_histogram(fill  = "white",
                 position = "identity")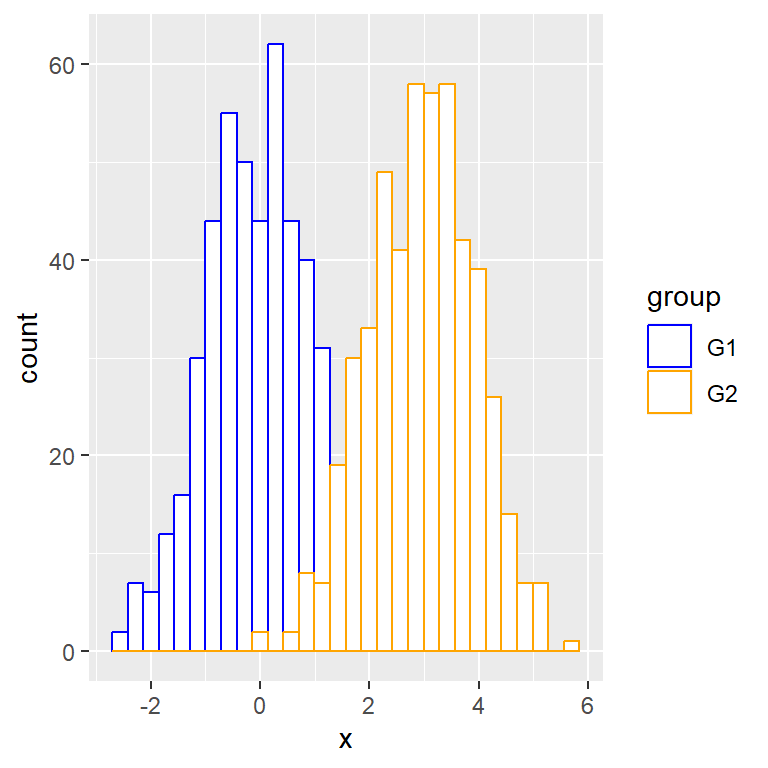
Custom border colors for each group
The borders color can be customized individually with scale_color_manual. If you want to use a palette you can use scale_color_brewer, for instance.
# install.packages("ggplot2")
library(ggplot2)

# Histogram by group in ggplot2
ggplot(df, aes(x = x, colour = group)) +
  geom_histogram(fill  = "white",
                 position = "identity") +
  scale_color_manual(values = c("blue", "orange"))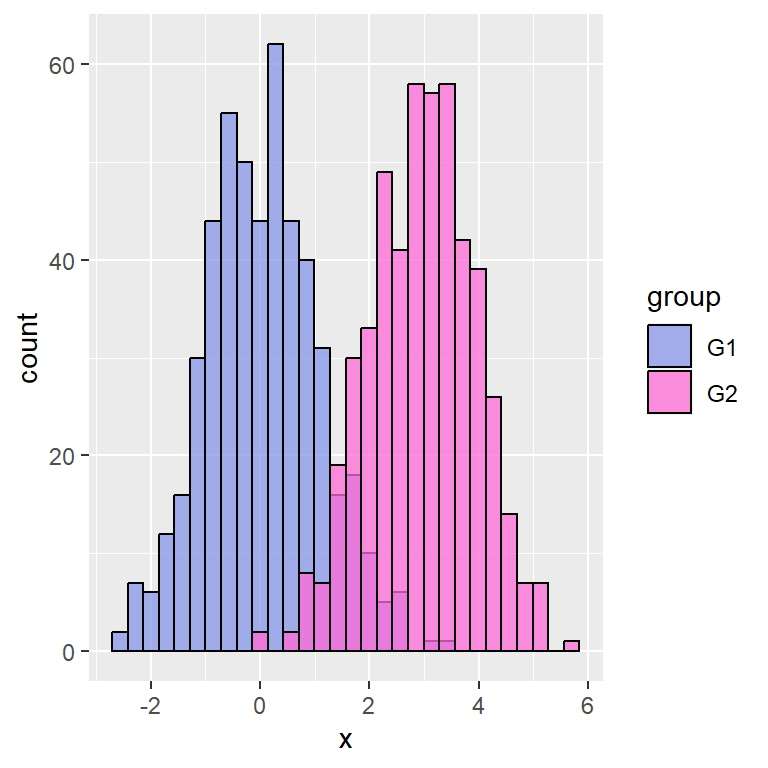
Custom fill colors for each group
Similarly to customizing the borders color, the fill colors can be set with scale_fill_manual or any function supporting fills.
# install.packages("ggplot2")
library(ggplot2)

# Histogram by group in ggplot2
ggplot(df, aes(x = x, fill = group)) +
  geom_histogram(color = 1, alpha = 0.75,
                 position = "identity") +
  scale_fill_manual(values = c("#8795E8", "#FF6AD5"))
Legend customization
Custom legend title
The legend title is the name of the column of the categorical value of the data set. You can change it with the fill and/or colour arguments of the guides function. As we are passing fill and colour to aes we are setting both or two legends will be displayed.
# install.packages("ggplot2")
library(ggplot2)

# Histogram by group in ggplot2
ggplot(df, aes(x = x, fill = group, colour = group)) +
  geom_histogram(alpha = 0.5, position = "identity") +
  guides(fill = guide_legend(title = "Title"),
         colour = guide_legend(title = "Title"))
Custom legend labels
The legend will display the names of the categorical variable by default, but you can change them with scale_color_discrete and/or scale_fill_discrete. Note that this will depend to which aes you set.
# install.packages("ggplot2")
library(ggplot2)

# Histogram by group in ggplot2
ggplot(df, aes(x = x, fill = group, colour = group)) +
  geom_histogram(alpha = 0.5, position = "identity") +
  scale_color_discrete(labels = c("A", "B")) +
  scale_fill_discrete(labels = c("A", "B"))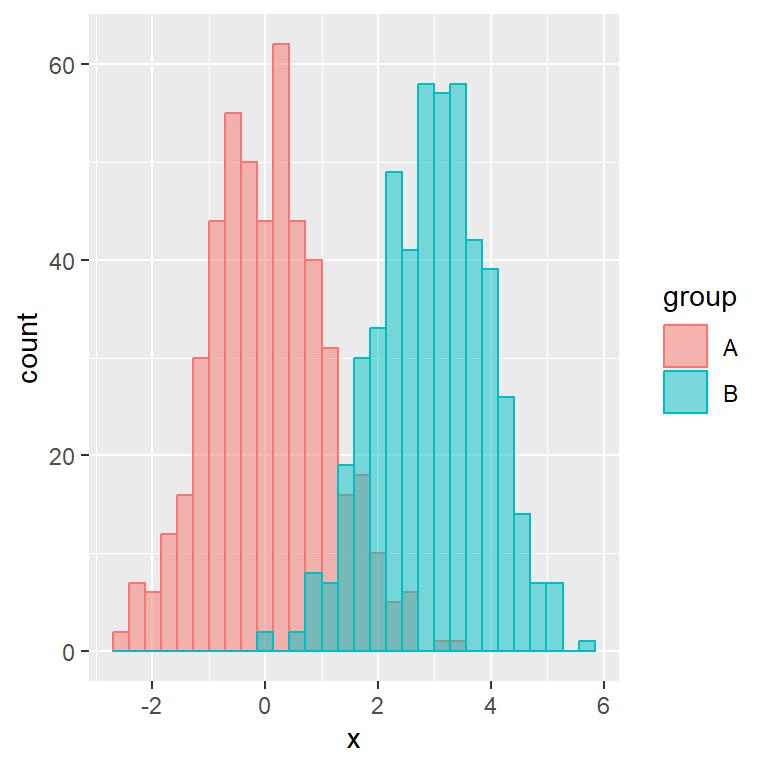
Legend position
The position of the legend defaults to the right, but can be changed with the legend.position component of the theme function as in the example below.
# install.packages("ggplot2")
library(ggplot2)

# Histogram by group in ggplot2
ggplot(df, aes(x = x, fill = group, colour = group)) +
  geom_histogram(alpha = 0.5, position = "identity") +
  theme(legend.position = "left")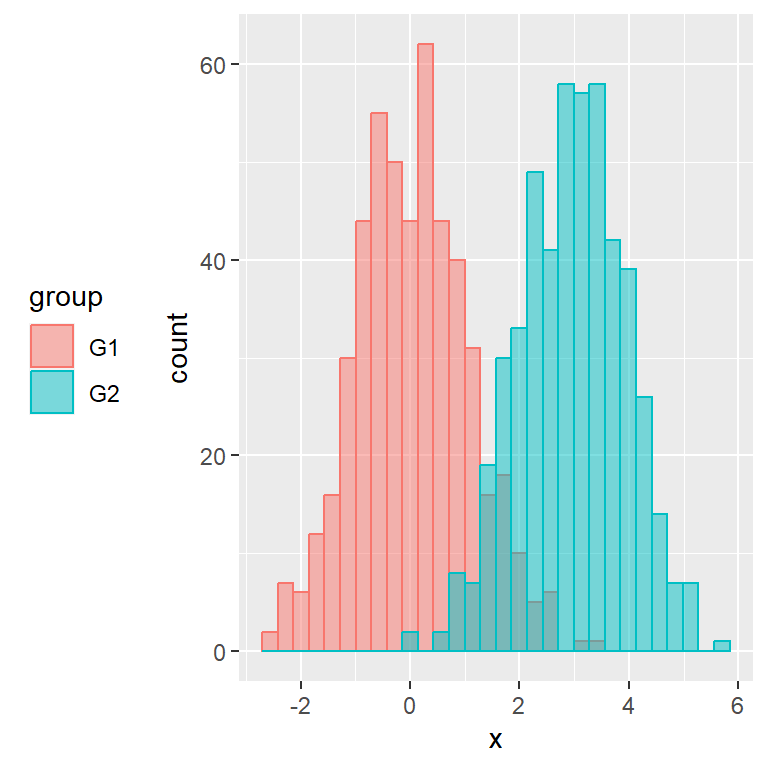
Remove the legend
Setting position = "none" the legend will be completely removed.
# install.packages("ggplot2")
library(ggplot2)

# Histogram by group in ggplot2
ggplot(df, aes(x = x, fill = group, colour = group)) +
  geom_histogram(alpha = 0.5, position = "identity") +
  theme(legend.position = "none")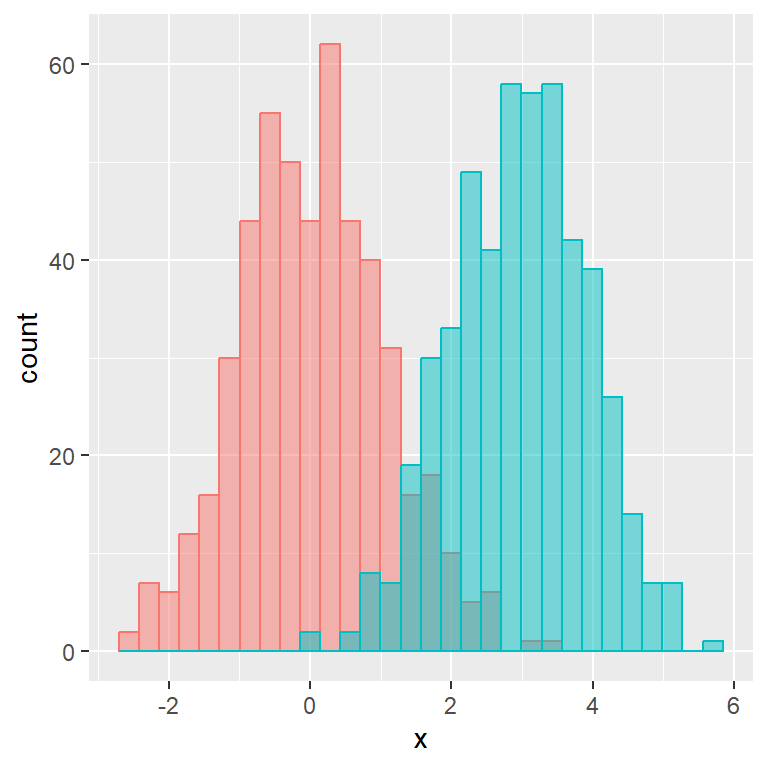

Master Statistics
Learn statistics from the basics to advanced techniques, clearly explained
Go to site