Sample data
Consider the chickwts data set, which contains a numerical variable giving the chicken weights from an experiment and a categorial variable giving the feed type of each chicken.
# Sample data set
df <- chickwts
Violin plot by group
Default violin plots
Violin plots are an alternative to box plots which can be created in base R with vioplot package. In order to create a violin plot by group you will need to input a formula, such as y ~ x, being y a numerical variable and x a categorical variable containing groups.
# install.packages("vioplot")
library("vioplot")

vioplot(weight ~ feed, data = df)

# Equivalent to:
vioplot(df$weight ~ df$feed)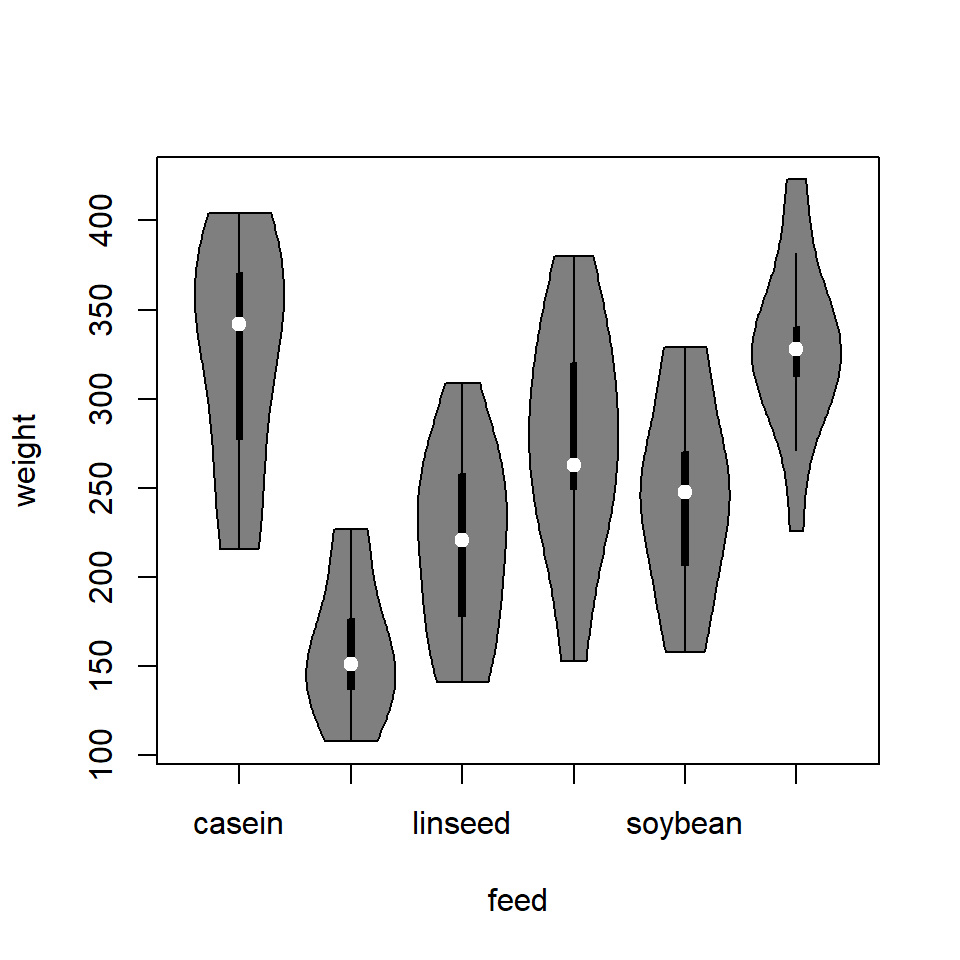
Horizontal violin plots
The default violin plots are displayed vertical but it is possible to create a horizontal violin plot setting the horizontal argument to TRUE.
# install.packages("vioplot")
library("vioplot")

vioplot(df$weight ~ df$feed,
        horizontal = TRUE)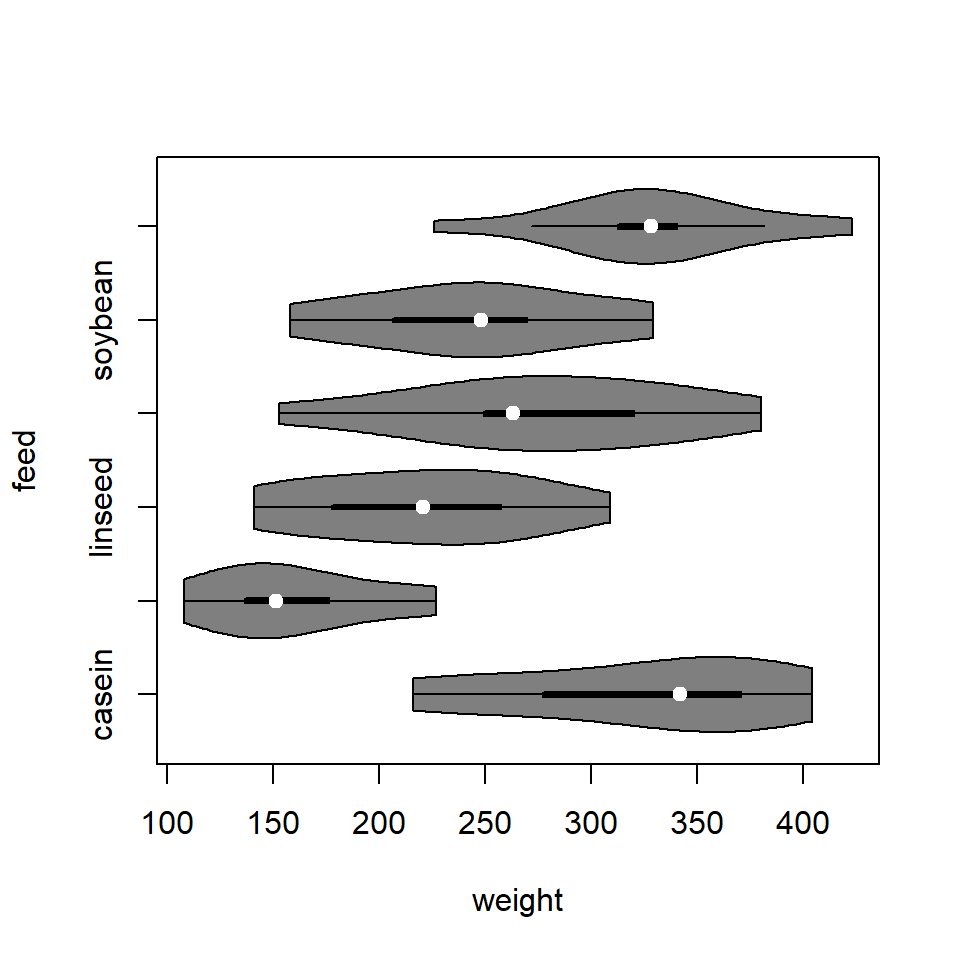
Violin sides
You can also plot one side of the violins, setting the argument side to "right" or "left". Note that both sides are symmetric and represent the kernel density estimate of the underlying data. vioplot uses the optimal bandwidth by sm.density.compare from sm package.
# install.packages("vioplot")
library("vioplot")

vioplot(df$weight ~ df$feed,
        side = "right") # or "left"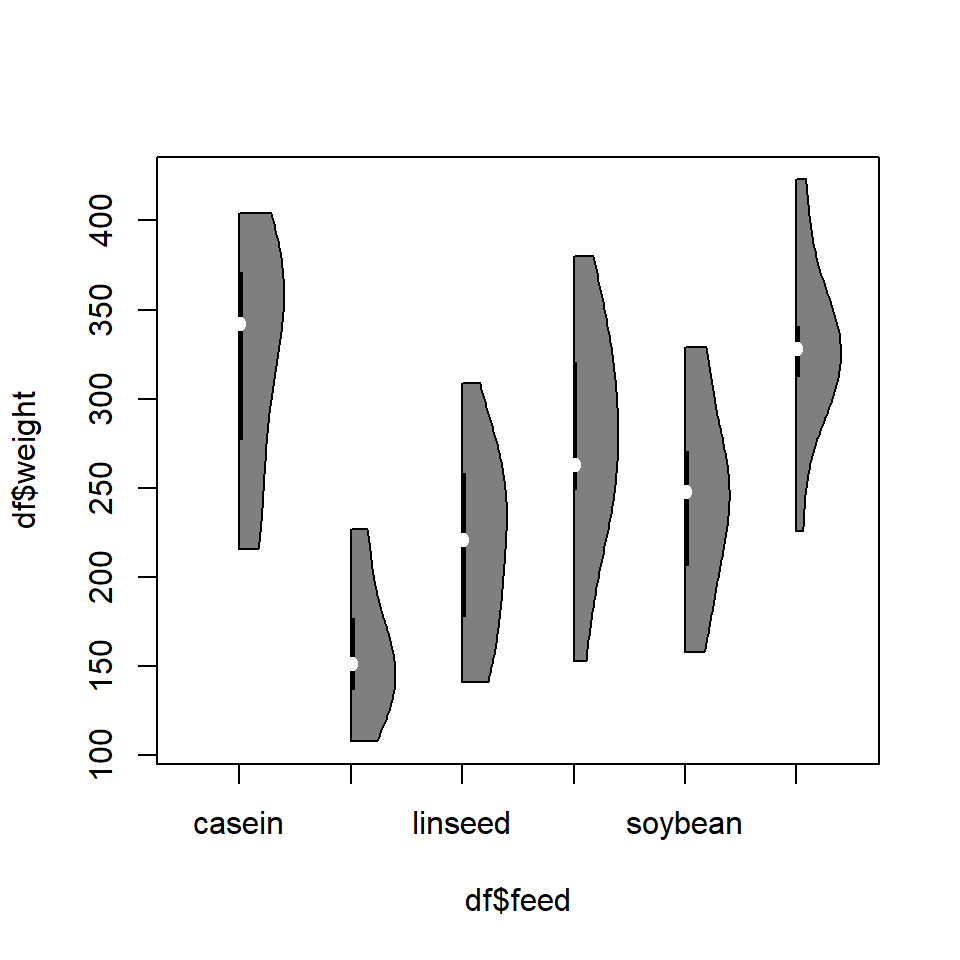
Violin plot colors
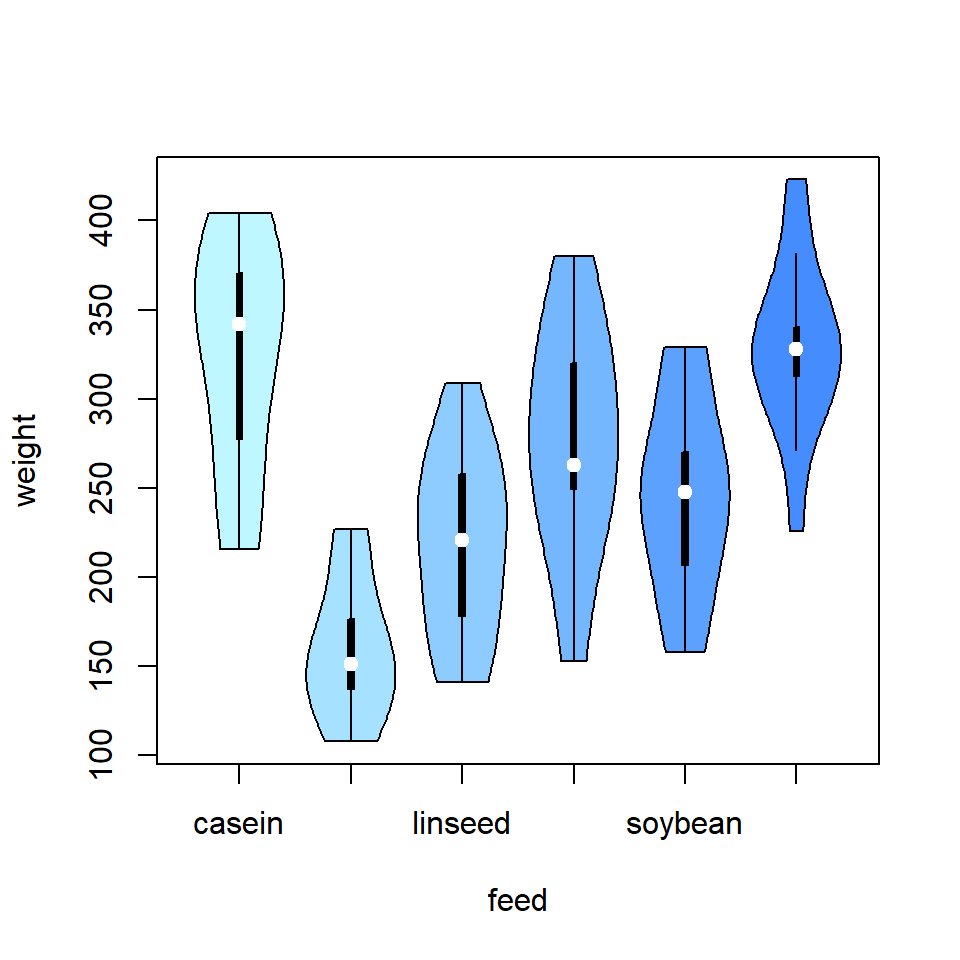
Fill color
The colors for each group can be customized with the col argument. You can set an unique color to colorize all the violins with the same color or set a vector of colors like in the following example.
# install.packages("vioplot")
library("vioplot")

vioplot(weight ~ feed, data = df,
        col = c("#bef7ff", "#a6e2ff", "#8eccff",
                "#75b7ff", "#5da1ff", "#458cff"))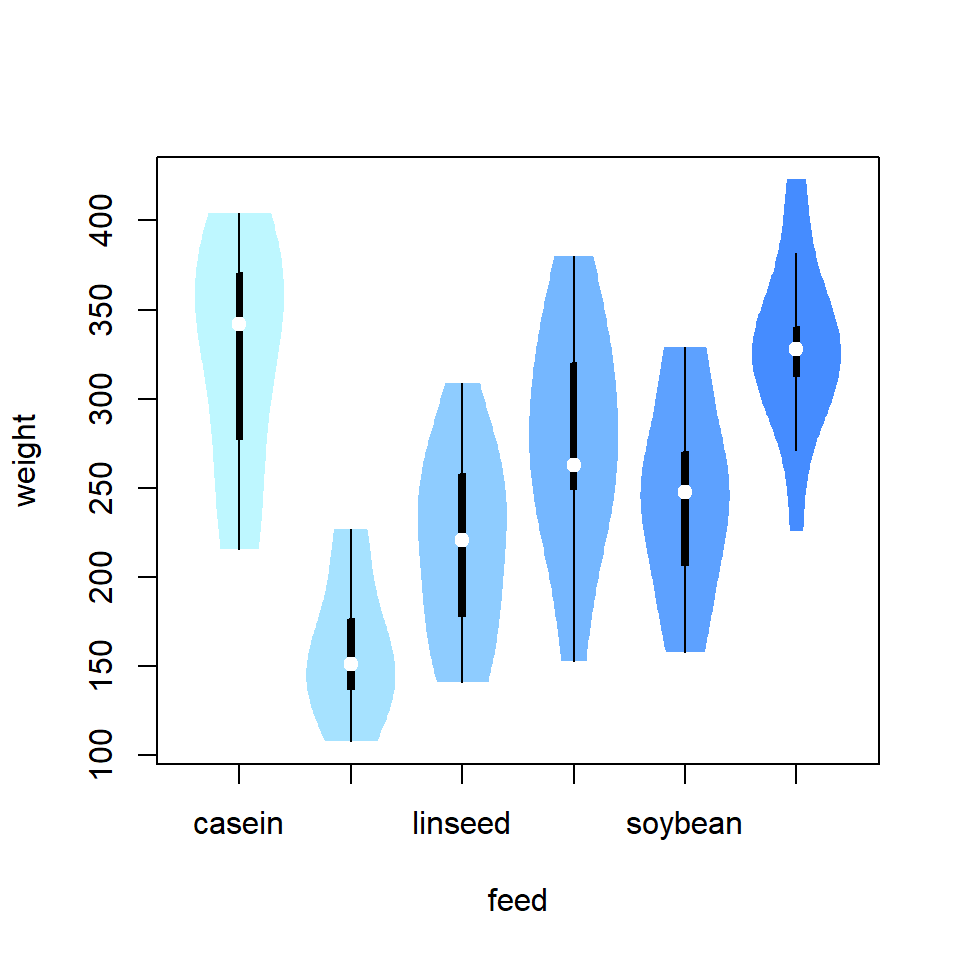
Border color
The border for each violin can be customized the same way as the fill color. If you want to remove all the borders set border = NA.
# install.packages("vioplot")
library("vioplot")

vioplot(weight ~ feed, data = df,
        col = c("#bef7ff", "#a6e2ff", "#8eccff",
                "#75b7ff", "#5da1ff", "#458cff"),
        border = NA)
Master Statistics
Learn statistics from the basics to advanced techniques, clearly explained
Go to site