Sample data
The following data frame contains the measure of a variable within three different groups. We will use this data in the examples below.
# Sample data
set.seed(1995)
y <- round(rnorm(200), 1)

df <- data.frame(y = y,
                group = sample(c("G1", "G2", "G3"),
                               size = 200,
                               replace = TRUE))
Beeswarm plot in ggplot2 with geom_beeswarm
The ggbeeswarm package contains a function named geom_beeswarm, which can be used to create a beeswarm in ggplot2.
# install.packages("ggplot2")
library(ggplot2)
# install.packages("ggbeeswarm")
library(ggbeeswarm)

# Basic beeswarm plot in ggplot2
ggplot(df, aes(x = group, y = y)) +
  geom_beeswarm()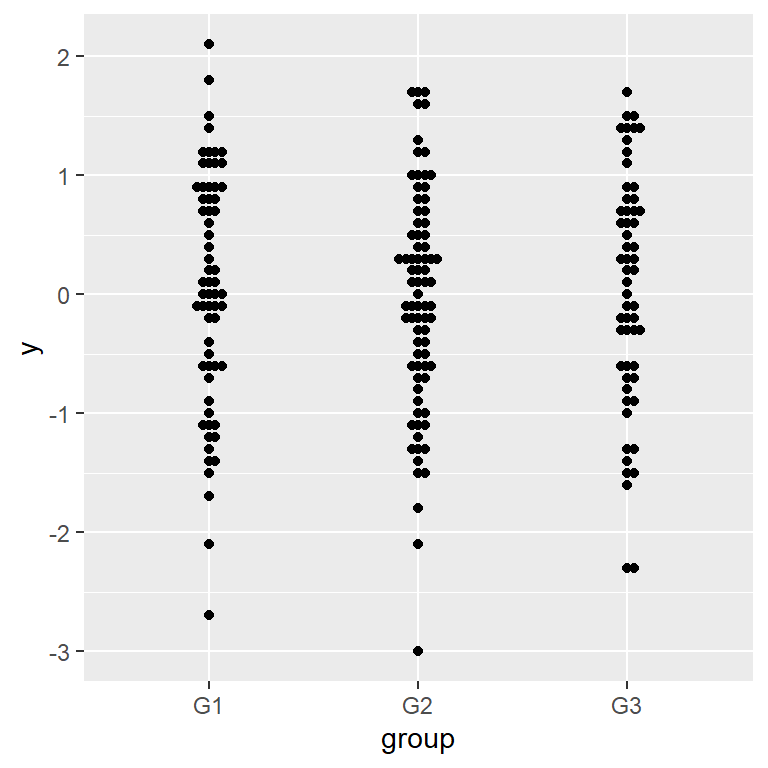
Size and scaling
By default the observations are shown all very close to each other. You can use the cex argument to increase the spacing and size to increase the size of the point.
# install.packages("ggplot2")
library(ggplot2)
# install.packages("ggbeeswarm")
library(ggbeeswarm)

# Beeswarm plot in ggplot2
ggplot(df, aes(x = group, y = y)) +
  geom_beeswarm(cex = 3)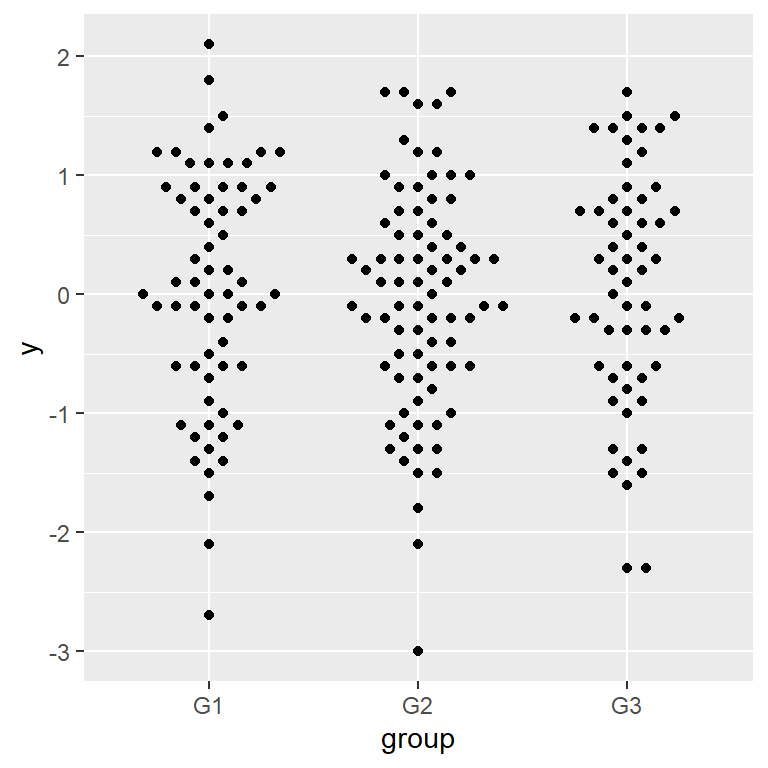
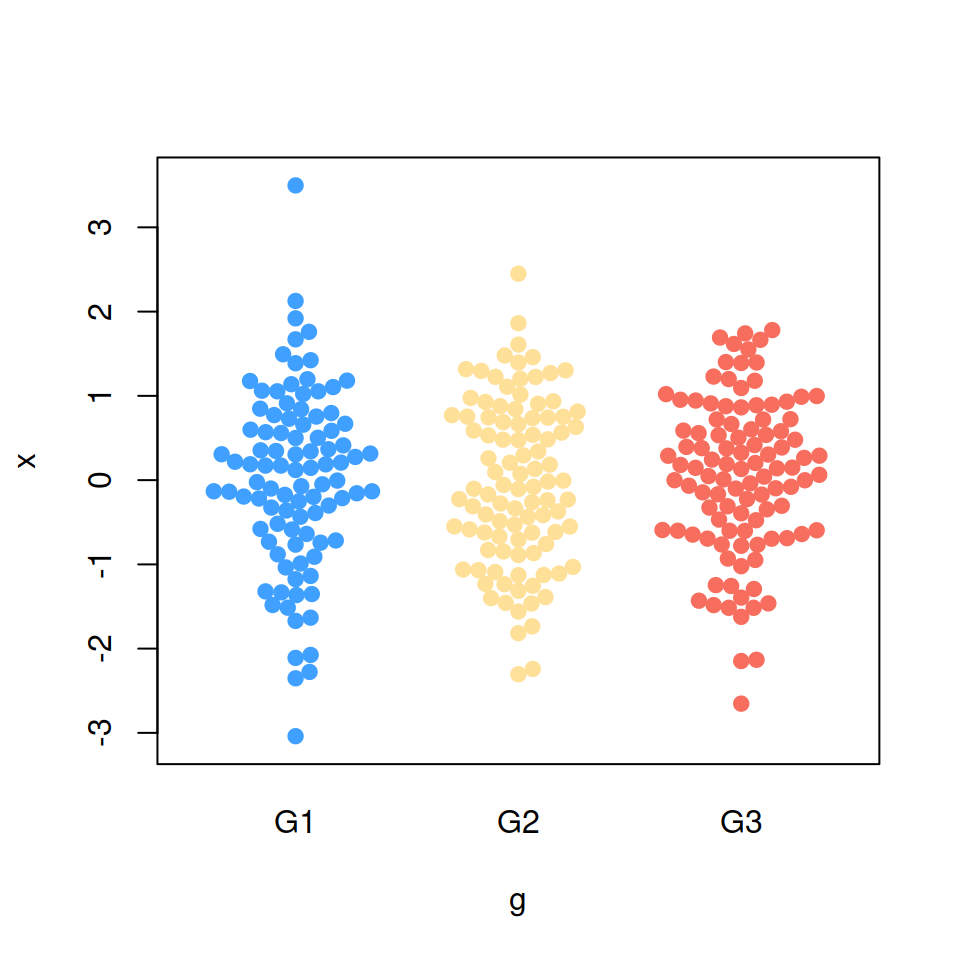
Color by group
As with other ggplot2 charts if you want to color the observations by group you can pass the categorical variable to the color or colour argument of aes.
# install.packages("ggplot2")
library(ggplot2)
# install.packages("ggbeeswarm")
library(ggbeeswarm)

# Beeswarm plot in ggplot2
ggplot(df, aes(x = group, y = y, color = group)) +
  geom_beeswarm(cex = 3)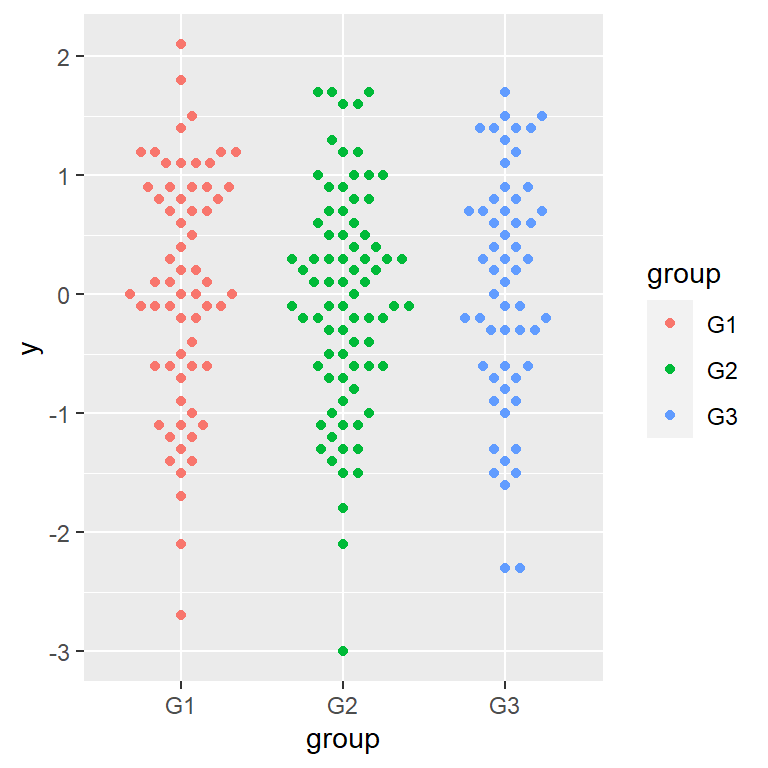
Change the colors
If you color the observations by group a default color scale will be used. You can change the colors with scale_color_brewer, scale_color_manual or an equivalent color scale.
# install.packages("ggplot2")
library(ggplot2)
# install.packages("ggbeeswarm")
library(ggbeeswarm)

# Beeswarm plot in ggplot2
ggplot(df, aes(x = group, y = y, color = group)) +
  geom_beeswarm(cex = 3) +
  scale_color_brewer(palette = "Set1")
Priority methods
In order to perform point layout a priority method must be chosen. By default the ascending method is used but you can change it with the priority argument. The other possible values are "descending", "density", "random" and "none".
# install.packages("ggplot2")
library(ggplot2)
# install.packages("ggbeeswarm")
library(ggbeeswarm)

# Beeswarm plot in ggplot2
ggplot(df, aes(x = group, y = y, color = group)) +
  geom_beeswarm(cex = 3,
                priority = "density")
Adding quasi-random noise with geom_quasirandom
The ggbeeswarm package also contains geom_quasirandom, which draws jittered data points similarly to geom_jitter but reducing overplotting using a van der Corput sequence or Tukey texturing.
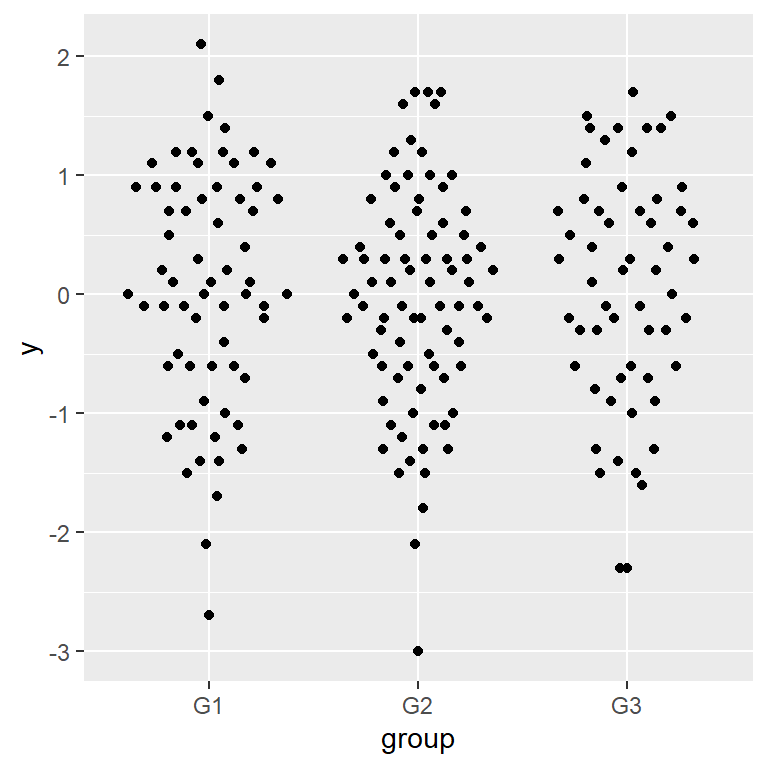
In order to add jittered data points without overplotting use the geom_quasirandom function as shown below.
# install.packages("ggplot2")
library(ggplot2)
# install.packages("ggbeeswarm")
library(ggbeeswarm)

# van der Corput sequence or Tukey texturing
ggplot(df, aes(x = group, y = y)) +
  geom_quasirandom()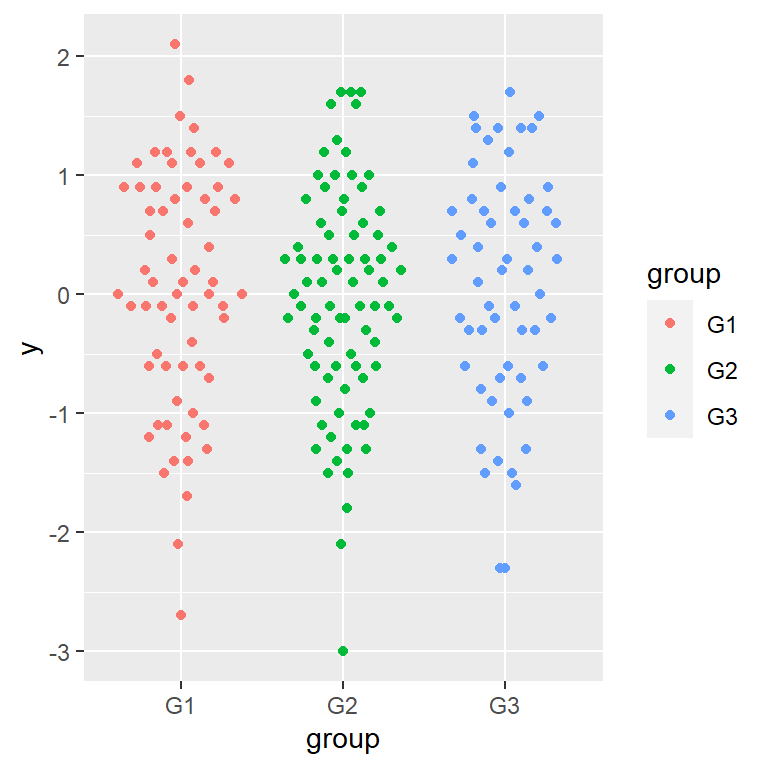
Color by group
As with geom_beeswarm you can color the observations by group if needed, passing the categorical variable to color.
# install.packages("ggplot2")
library(ggplot2)
# install.packages("ggbeeswarm")
library(ggbeeswarm)

# van der Corput sequence or Tukey texturing
ggplot(df, aes(x = group, y = y, color = group)) +
  geom_quasirandom()
Methods
There are different methods to distribute the points. By default the "quasirandom" method is used but you can also set "pseudorandom", "smiley" or "frowney".
“pseudorandom” method
# install.packages("ggplot2")
library(ggplot2)
# install.packages("ggbeeswarm")
library(ggbeeswarm)

# pseudorandom method
ggplot(df, aes(x = group, y = y)) +
  geom_quasirandom(method = "pseudorandom")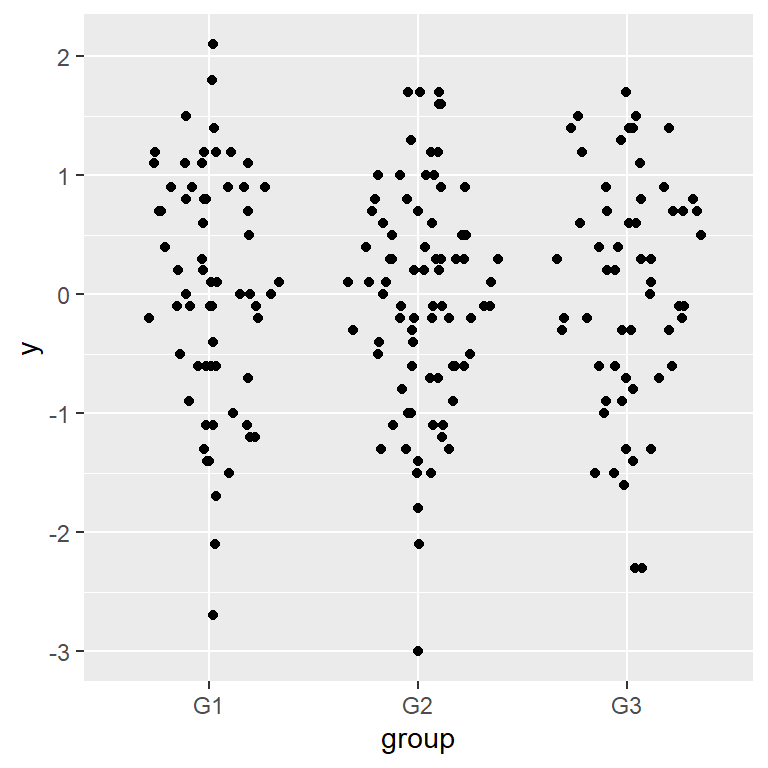
“smiley” method
# install.packages("ggplot2")
library(ggplot2)
# install.packages("ggbeeswarm")
library(ggbeeswarm)

# smiley method
ggplot(df, aes(x = group, y = y)) +
  geom_quasirandom(method = "smiley")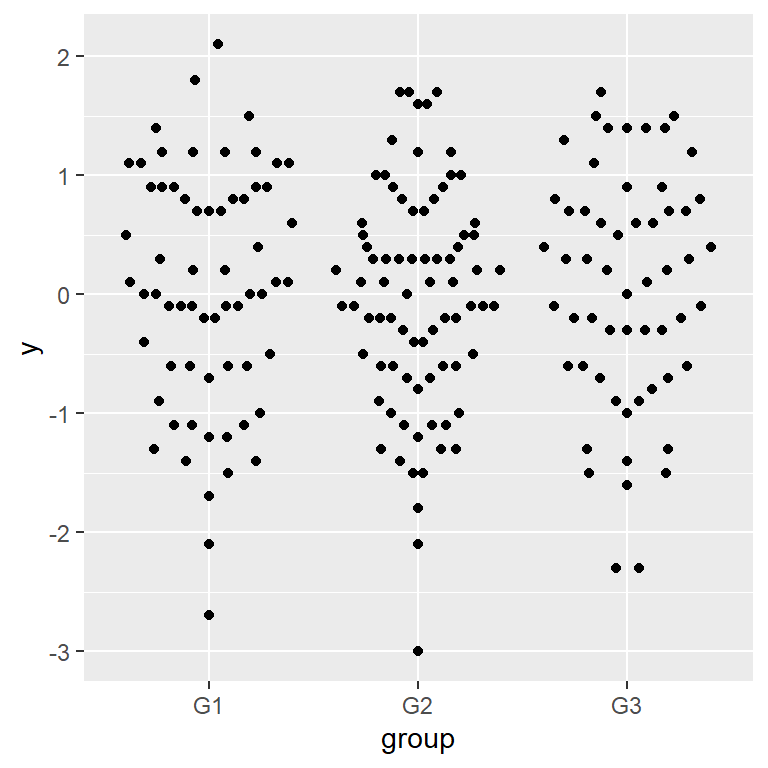
“frowney” method
# install.packages("ggplot2")
library(ggplot2)
# install.packages("ggbeeswarm")
library(ggbeeswarm)

# frowney method
ggplot(df, aes(x = group, y = y)) +
  geom_quasirandom(method = "frowney")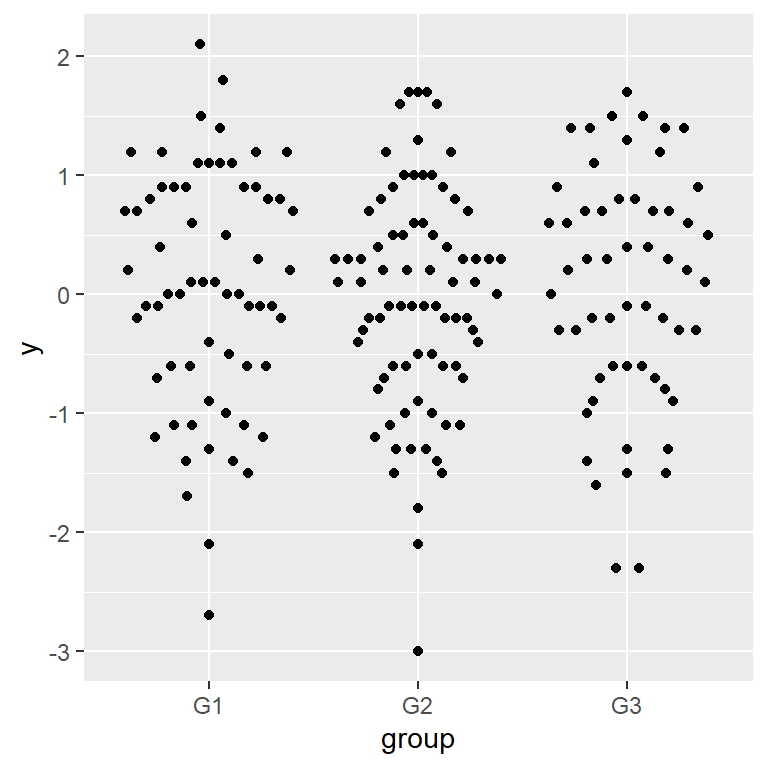

Master Statistics
Learn statistics from the basics to advanced techniques, clearly explained
Go to site