A basic histogram can be created with the hist function. In order to add a normal curve or the density line you will need to create a density histogram setting prob = TRUE as argument.
# Sample data
set.seed(3)
x <- rnorm(200)

# Histogram
hist(x, prob = TRUE)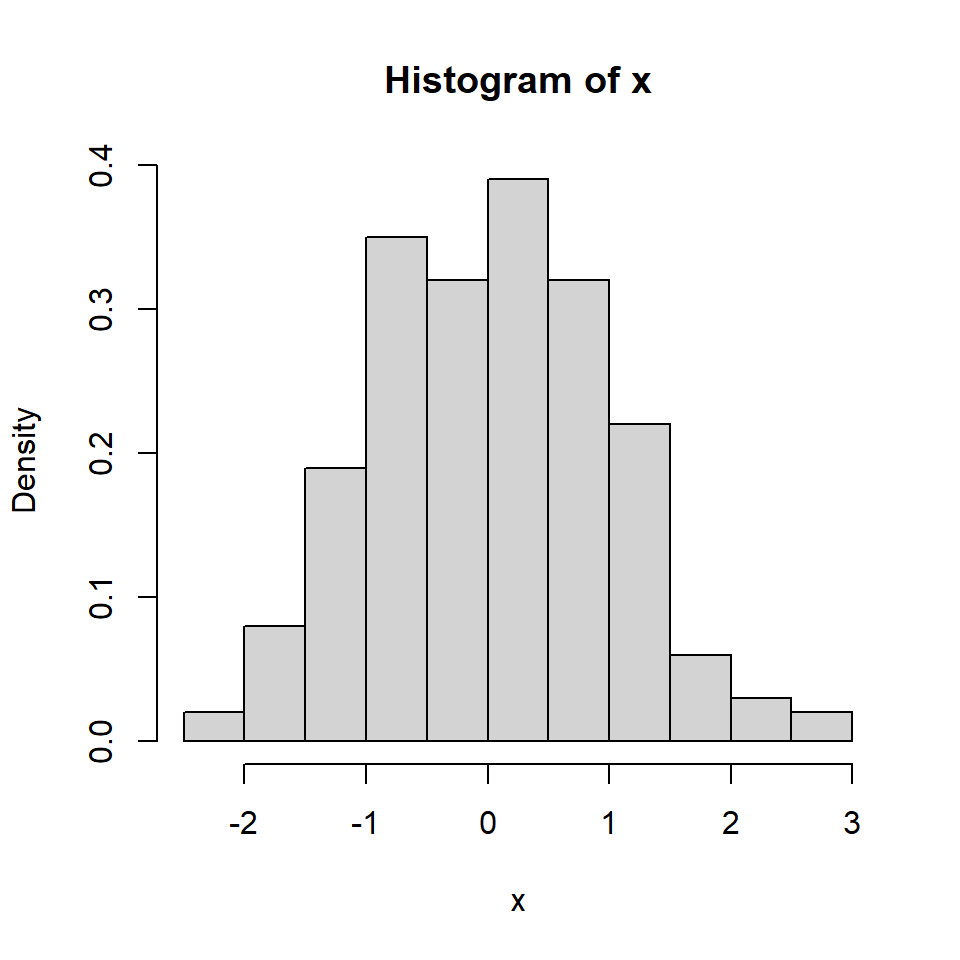
Histogram with normal curve

If you want to overlay a normal curve over your histogram you will need to calculate it with the dnorm function based on a grid of values and the mean and standard deviation of the data. Then you can add it with lines.
# X-axis grid
x2 <- seq(min(x), max(x), length = 40)

# Normal curve
fun <- dnorm(x2, mean = mean(x), sd = sd(x))

# Histogram
hist(x, prob = TRUE, col = "white",
     ylim = c(0, max(fun)),
     main = "Histogram with normal curve")
lines(x2, fun, col = 2, lwd = 2)
Histogram with density line
If you prefer adding the density curve of the data you can make use of the density function as shown in the example below.
# Sample data
set.seed(3)
x <- rnorm(200)

# Histogram
hist(x, prob = TRUE, ylim = c(0, max(fun)),
     main = "Histogram with density curve")
lines(density(x), col = 4, lwd = 2)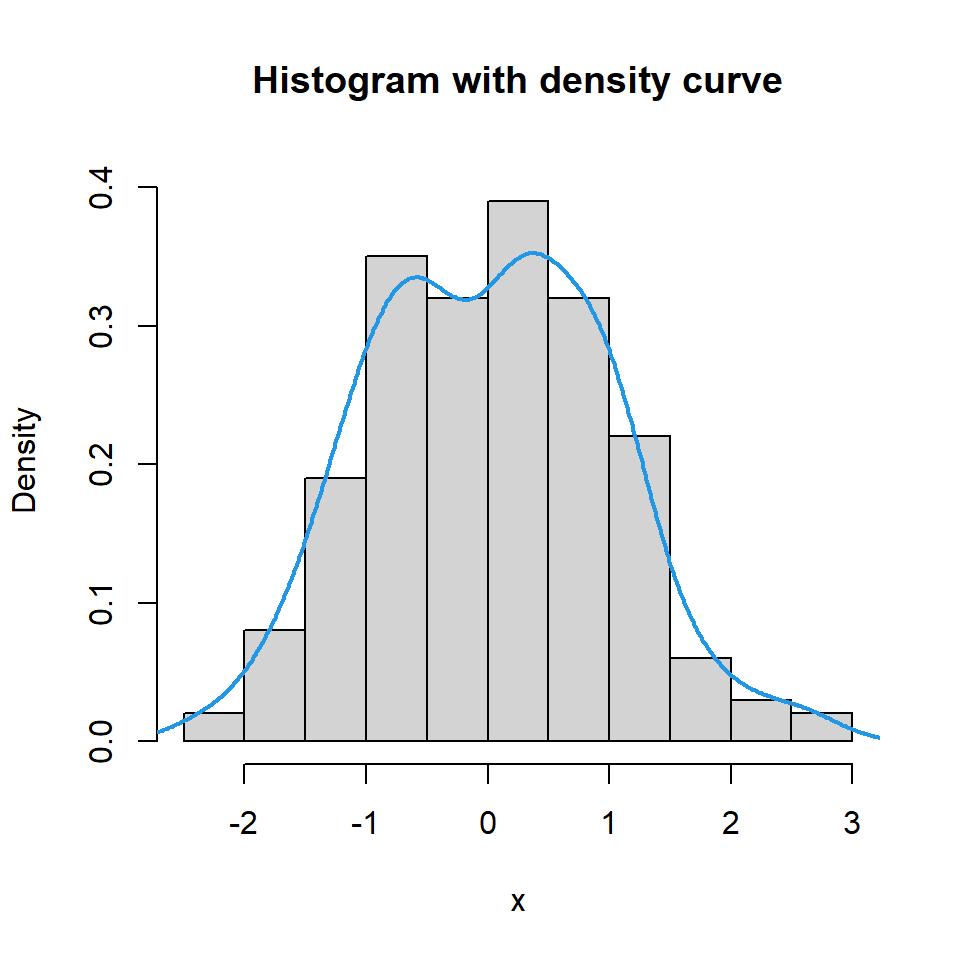

Master Statistics
Learn statistics from the basics to advanced techniques, clearly explained
Go to site