Sample data
The data set used in the following examples is warpbreaks, which gives the number of warp breaks in a yarn, the type of wool and the level of tension.
# Sample data set
warpbreaks
Grouped violin plot with geom_violin
A violin plot by group can be created in ggplot passing the numerical (breaks) and the categorical (tension) variable to aes and using geom_violin.
# install.packages("ggplot2")
library(ggplot2)

ggplot(warpbreaks, aes(x = tension, y = breaks)) +
  geom_violin()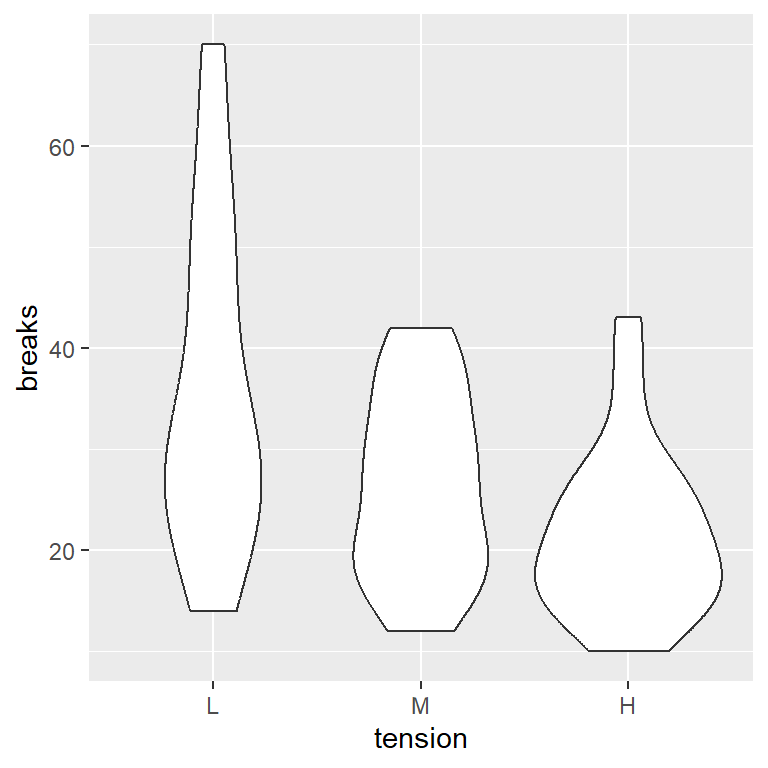
Horizontal violin plot
If you want a horizontal violin plot instead of vertical you can pass the categorical variable (tension) to y or use coord_flip as in the example below.
# install.packages("ggplot2")
library(ggplot2)

ggplot(warpbreaks, aes(x = tension, y = breaks)) +
  geom_violin() +
  coord_flip()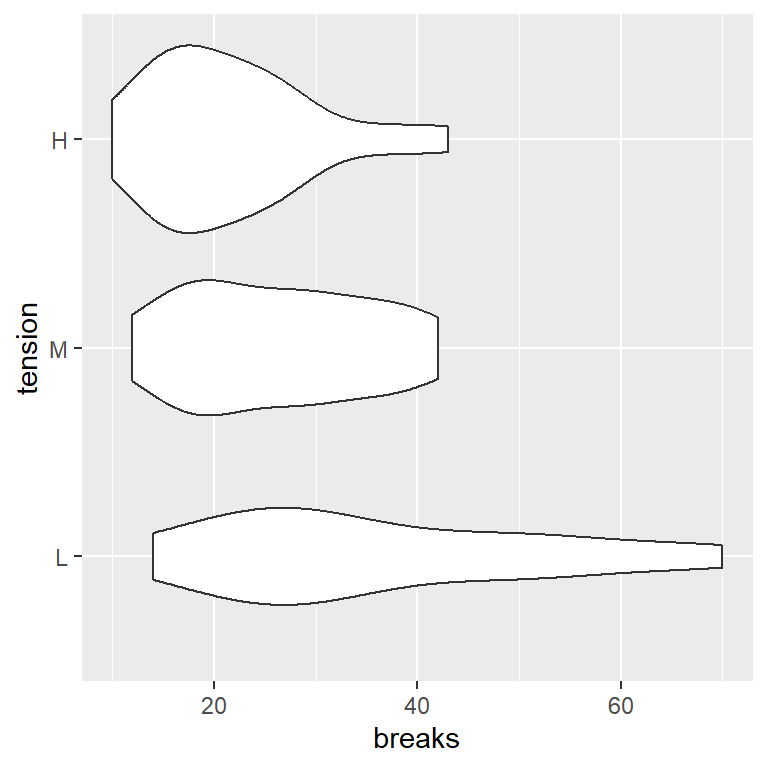
Avoid trimming the trails
By default, the trails of the violin are trimmed to the range of the data. To avoid trimming set trim = FALSE inside geom_violin.
# install.packages("ggplot2")
library(ggplot2)

ggplot(warpbreaks, aes(x = tension, y = breaks)) +
  geom_violin(trim = FALSE)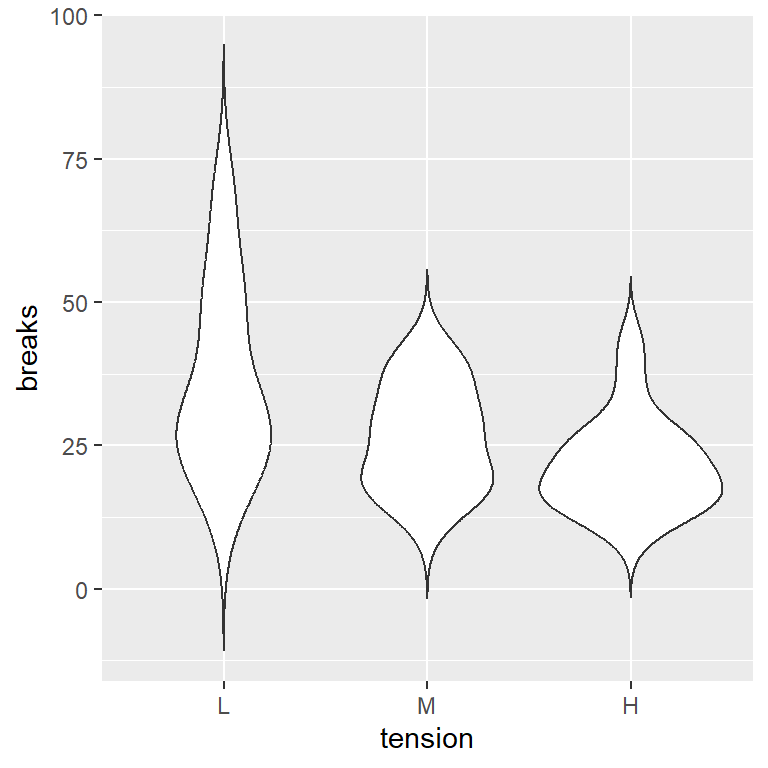
Adding quantiles
The desired quantiles can be added passing a vector to the draw_quantiles argument, as in the example below.
# install.packages("ggplot2")
library(ggplot2)

ggplot(warpbreaks, aes(x = tension, y = breaks)) +
  geom_violin(trim = FALSE,
              draw_quantiles = c(0.25, 0.5, 0.75))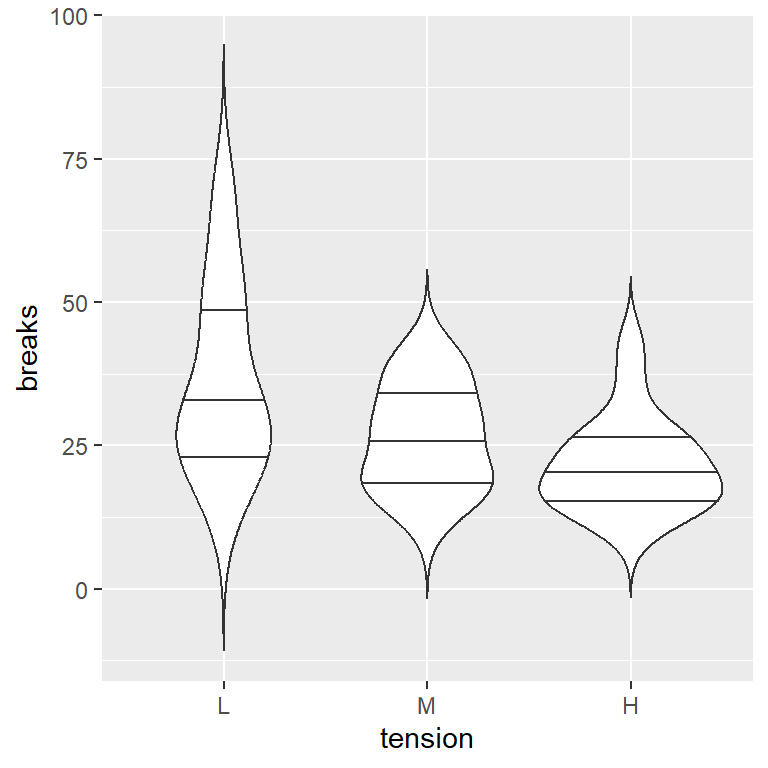
Adding box plots
You can also overlay box plots to the violin plots to show the median and the outliers. Recall to set a small width for the box plots.
# install.packages("ggplot2")
library(ggplot2)

ggplot(warpbreaks, aes(x = tension, y = breaks)) +
  geom_violin(trim = FALSE) +
  geom_boxplot(width = 0.07)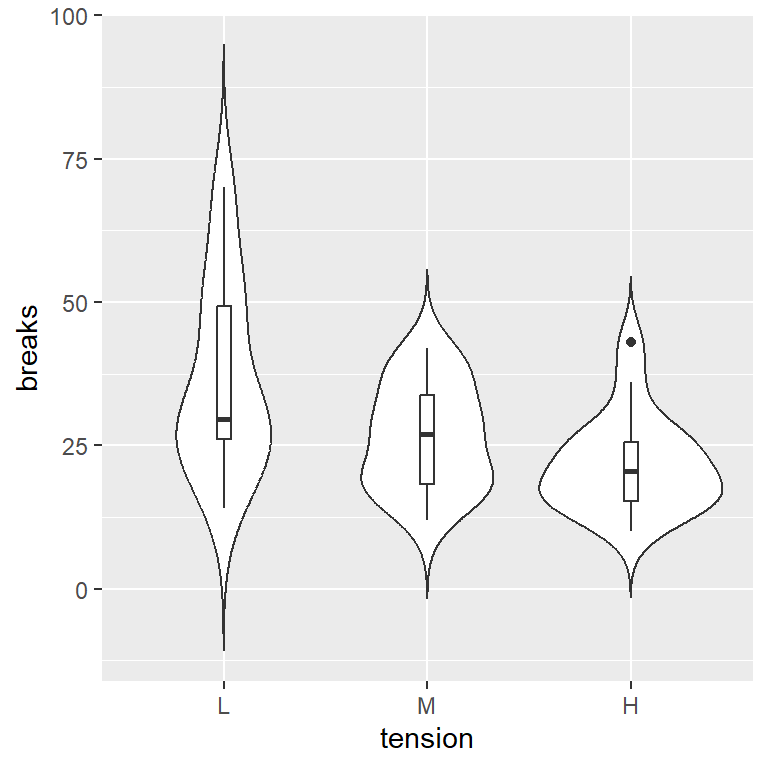
Bandwidth customization
The violins are kernel density estimates of the data, so a bandwidth is involved for its computation. The default bandwidth can be changed with bw.
# install.packages("ggplot2")
library(ggplot2)

ggplot(warpbreaks, aes(x = tension, y = breaks)) +
  geom_violin(trim = FALSE, bw = 10) +
  geom_boxplot(width = 0.07)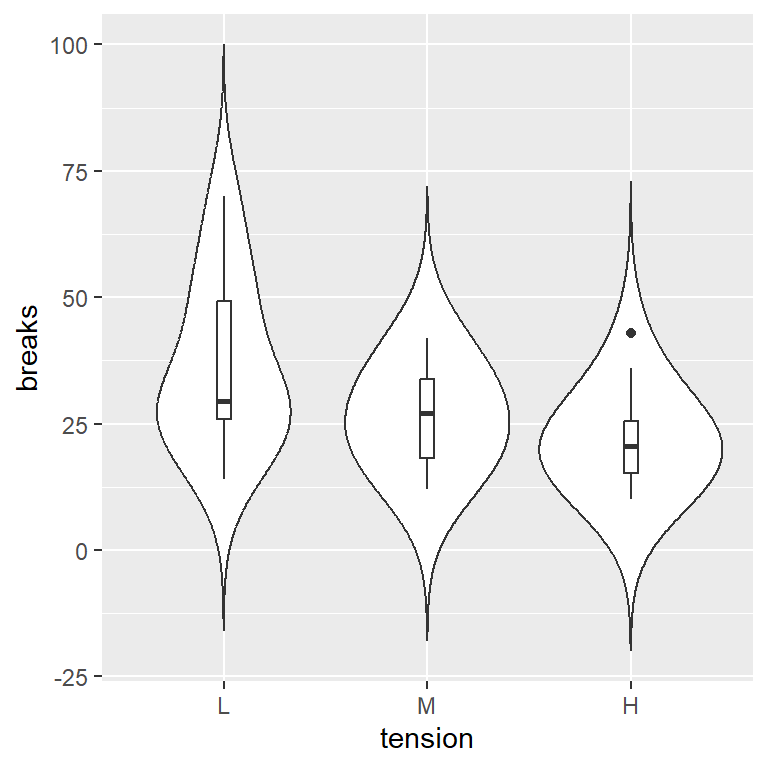
Fill and border colors
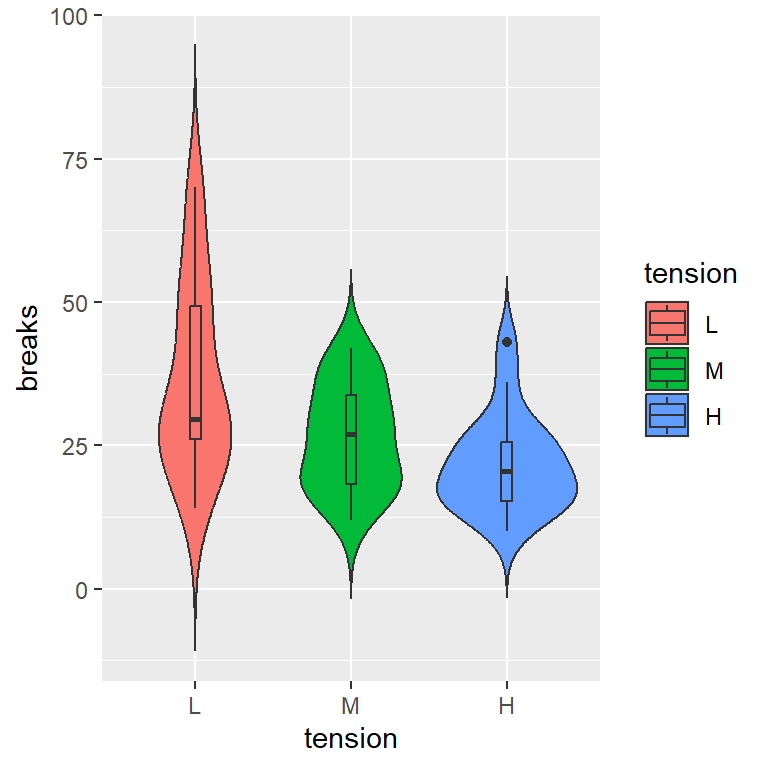
Fill color by group
If you want to fill the violins by group pass the categorical variable to the fill argument of aes.
# install.packages("ggplot2")
library(ggplot2)

ggplot(warpbreaks, aes(x = tension, y = breaks, fill = tension)) +
  geom_violin(trim = FALSE) +
  geom_boxplot(width = 0.07)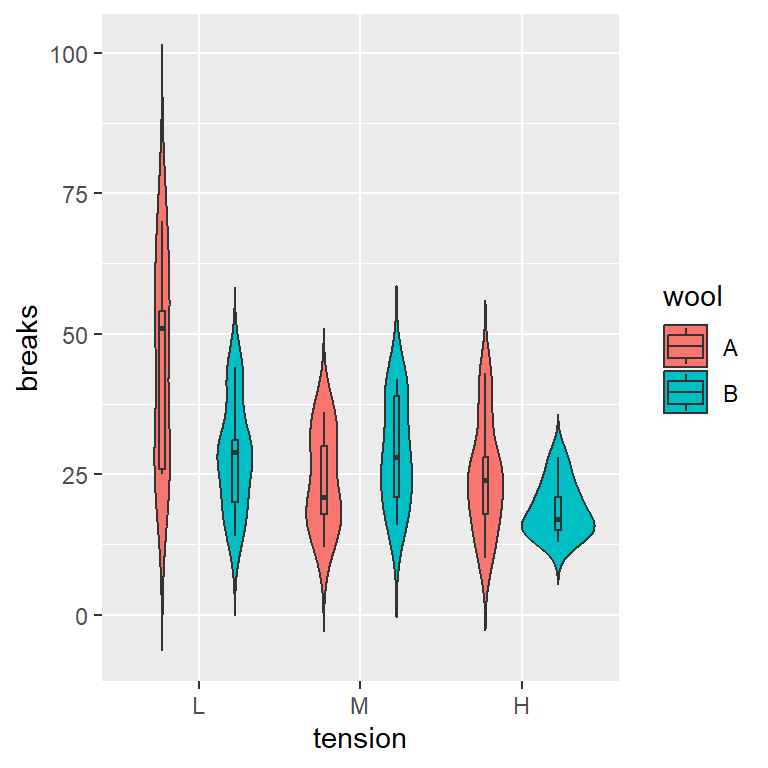
Fill color by subgroup
If you have other categorical variable you can create subgroups and fill the areas based on these subgroups.
# install.packages("ggplot2")
library(ggplot2)

ggplot(warpbreaks, aes(x = tension, y = breaks, fill = wool)) +
  geom_violin(trim = FALSE) +
  geom_boxplot(width = 0.07, position = position_dodge(width = 0.9))
Color scale
The default colors can be changed. For instance, you can use the brewer palette as follows:
# install.packages("ggplot2")
library(ggplot2)

ggplot(warpbreaks, aes(x = tension, y = breaks, fill = tension)) +
  geom_violin(trim = FALSE) +
  geom_boxplot(width = 0.07) +
  scale_fill_brewer()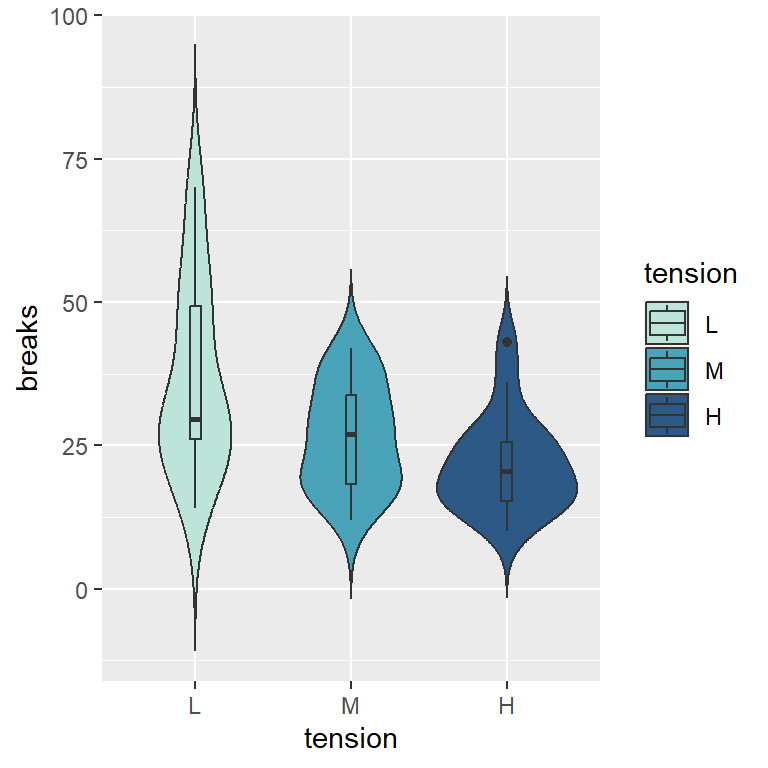
Custom colors
If you want to use your custom color palette you can use scale_fill_manual and input the colors to the values argument.
# install.packages("ggplot2")
library(ggplot2)

ggplot(warpbreaks, aes(x = tension, y = breaks, fill = tension)) +
  geom_violin(trim = FALSE) +
  geom_boxplot(width = 0.07) +
  scale_fill_manual(values = c("#BCE4D8", "#49A4B9", "#2C5985"))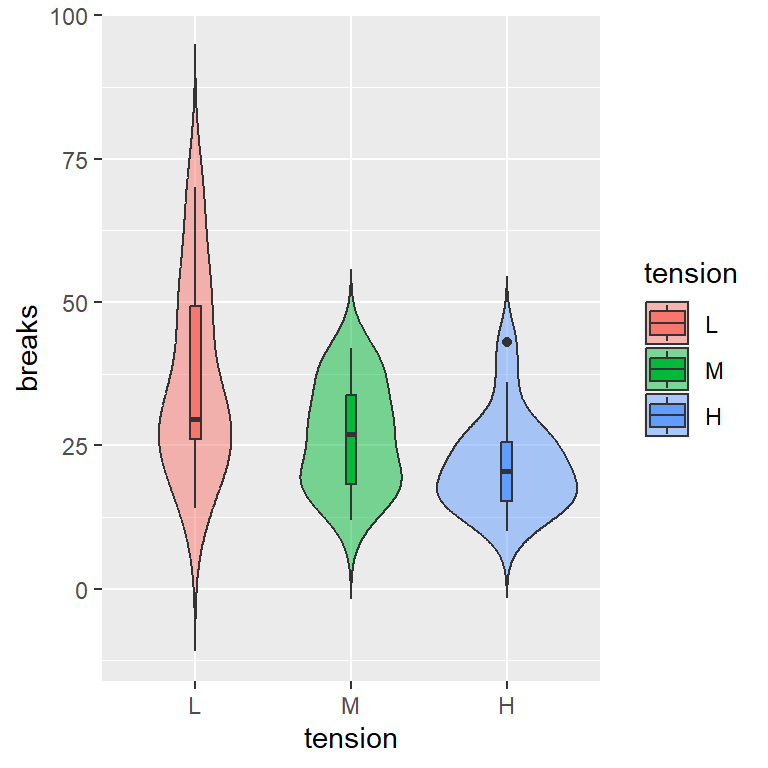
Fill transparency
The fill transparency can be modified with the alpha argument of the geom_violin function.
# install.packages("ggplot2")
library(ggplot2)

ggplot(warpbreaks, aes(x = tension, y = breaks, fill = tension)) +
  geom_violin(trim = FALSE,
              alpha = 0.5) +
  geom_boxplot(width = 0.07)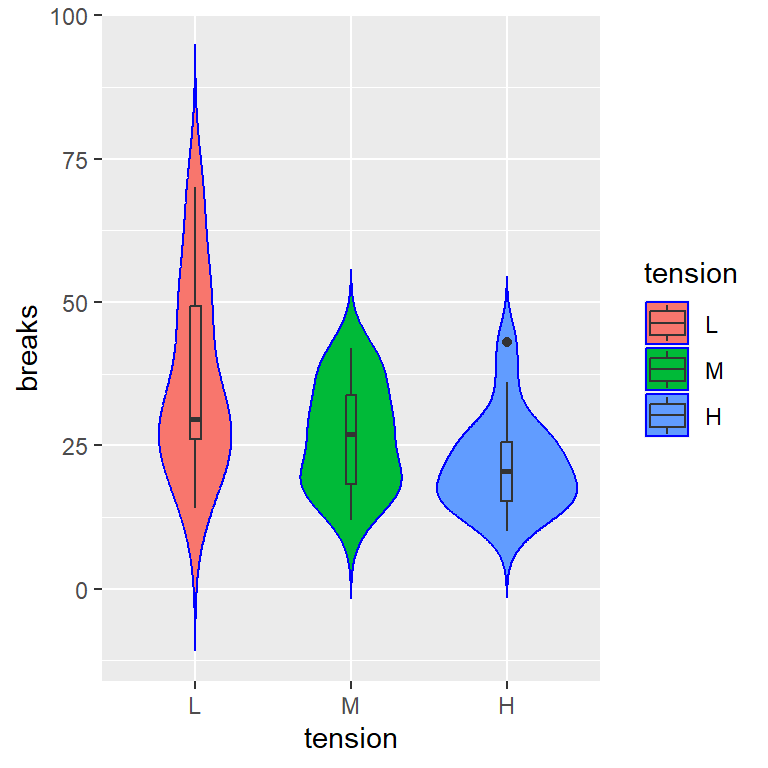
Border color
The color argument of geom_violin can be used to change the color of the borders.
# install.packages("ggplot2")
library(ggplot2)

ggplot(warpbreaks, aes(x = tension, y = breaks, fill = tension)) +
  geom_violin(trim = FALSE,
              color = "blue") +
  geom_boxplot(width = 0.07)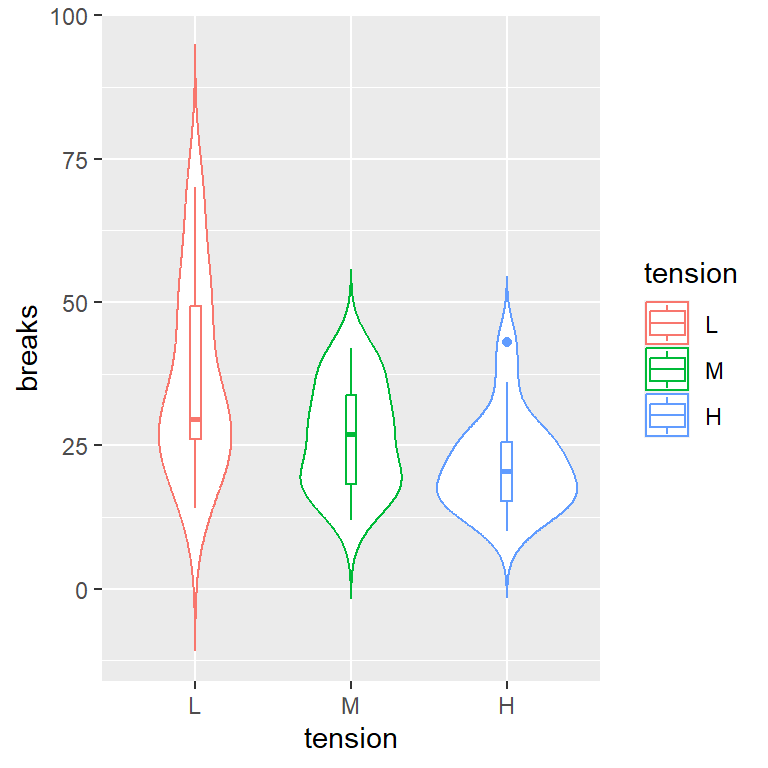
Border color by group
However, if you want to set a border color based on the groups, you can pass the categorical variable to the color argument of the aes function.
# install.packages("ggplot2")
library(ggplot2)

ggplot(warpbreaks, aes(x = tension, y = breaks, color = tension)) +
  geom_violin(trim = FALSE) +
  geom_boxplot(width = 0.07)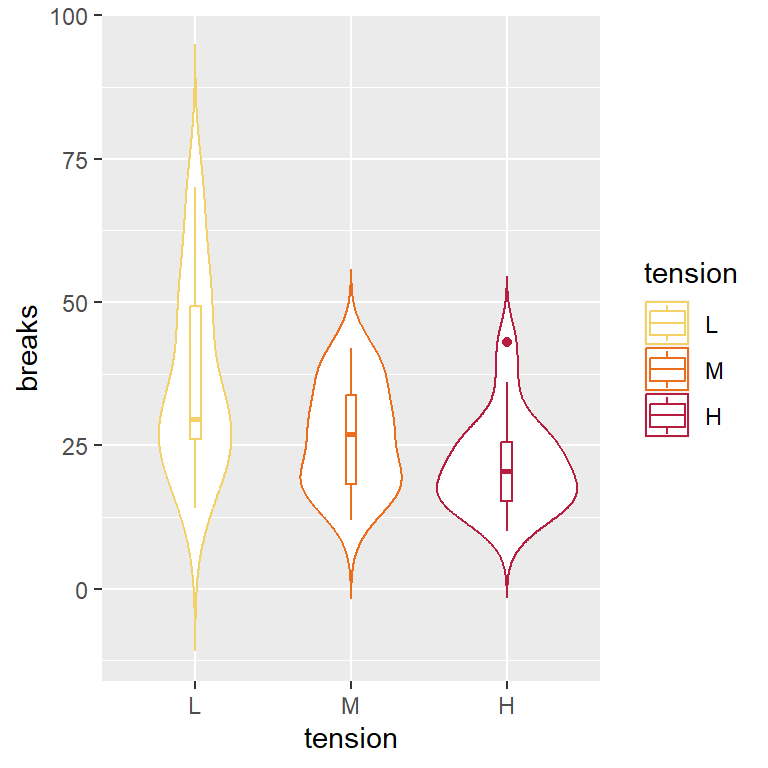
Custom border colors
Similarly to changing the fill colors, you can customize the border colors, but with scale_color_manual.
# install.packages("ggplot2")
library(ggplot2)

ggplot(warpbreaks, aes(x = tension, y = breaks, color = tension)) +
  geom_violin(trim = FALSE) +
  geom_boxplot(width = 0.07) +
  scale_color_manual(values = c("#F4D166", "#EC6E1C", "#B71D3E"))
Legend customization
Legend title
The legend title displays the name of the categorical variable. To change this default title use the guides function as follows.
# install.packages("ggplot2")
library(ggplot2)

ggplot(warpbreaks, aes(x = tension, y = breaks, fill = tension)) +
  geom_violin(trim = FALSE) +
  geom_boxplot(width = 0.07) +
  guides(fill = guide_legend(title = "Title"))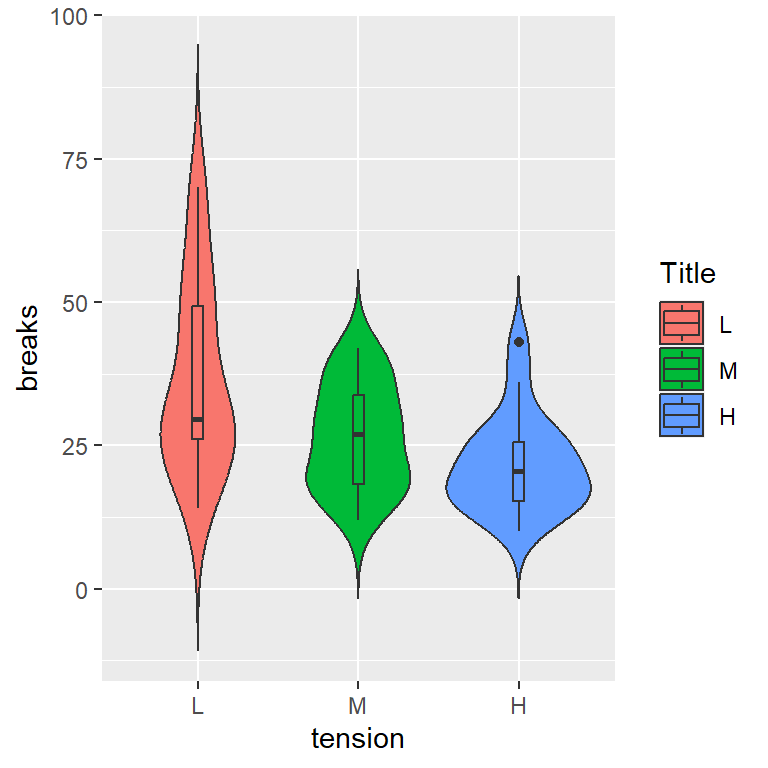
Key labels
The legend key labels are the names of the groups. These labels can be changed with scale_fill_manual if you change the fill colors or with scale_fill_hue to only change the labels.
# install.packages("ggplot2")
library(ggplot2)

ggplot(warpbreaks, aes(x = tension, y = breaks, fill = tension)) +
  geom_violin(trim = FALSE) +
  geom_boxplot(width = 0.07) +
  scale_fill_hue(labels = c("G1", "G2", "G3"))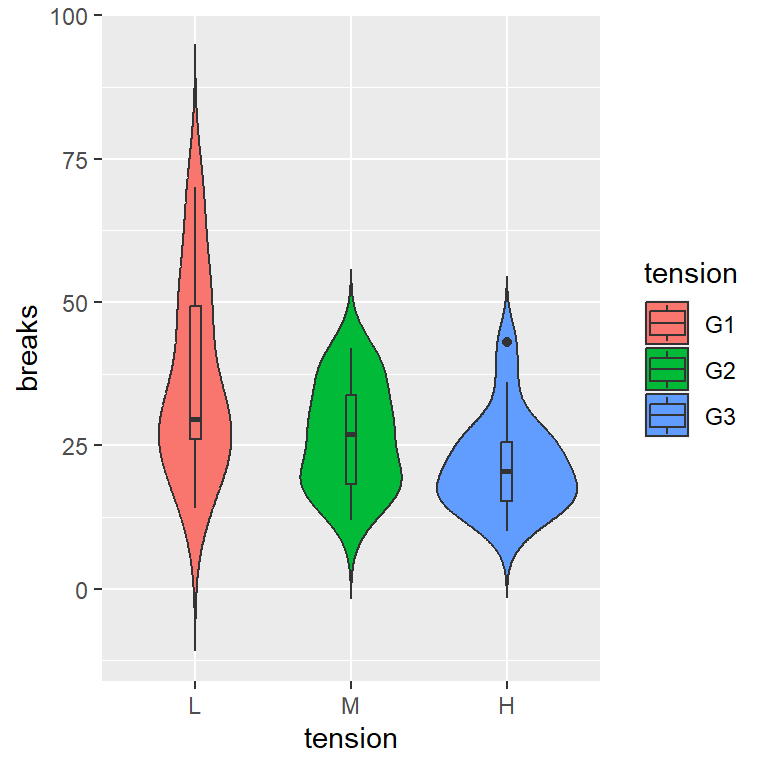
Remove legend
Finally, if you want to remove the default legend you can set the legend position to "none" or add show.legend = FALSE to geom_violin and geom_boxplot (if you added it).
# install.packages("ggplot2")
library(ggplot2)

ggplot(warpbreaks, aes(x = tension, y = breaks, fill = tension)) +
  geom_violin(trim = FALSE) +
  geom_boxplot(width = 0.07) +
  theme(legend.position = "none")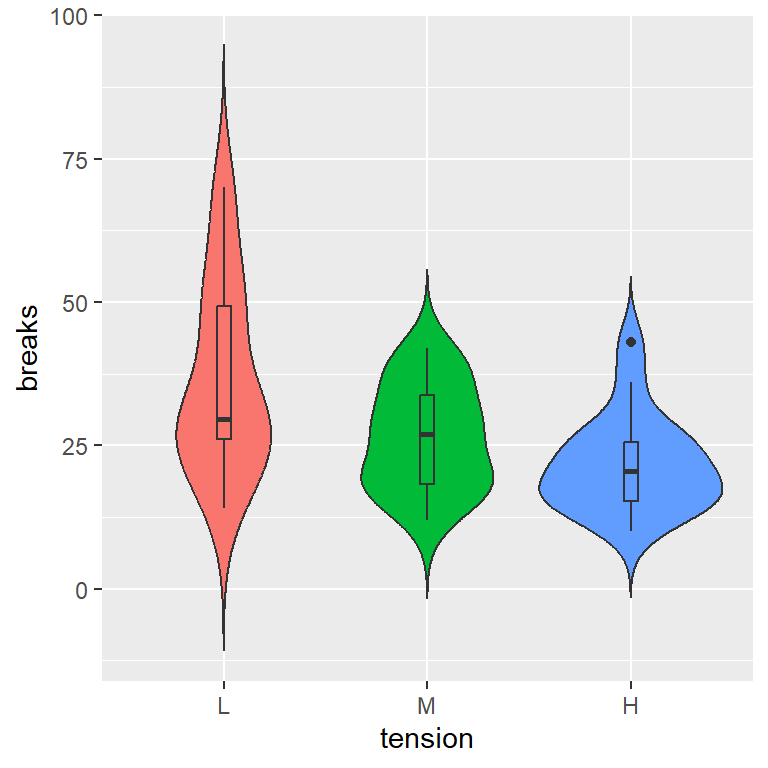

Master Statistics
Learn statistics from the basics to advanced techniques, clearly explained
Go to site