A basic frequency histogram
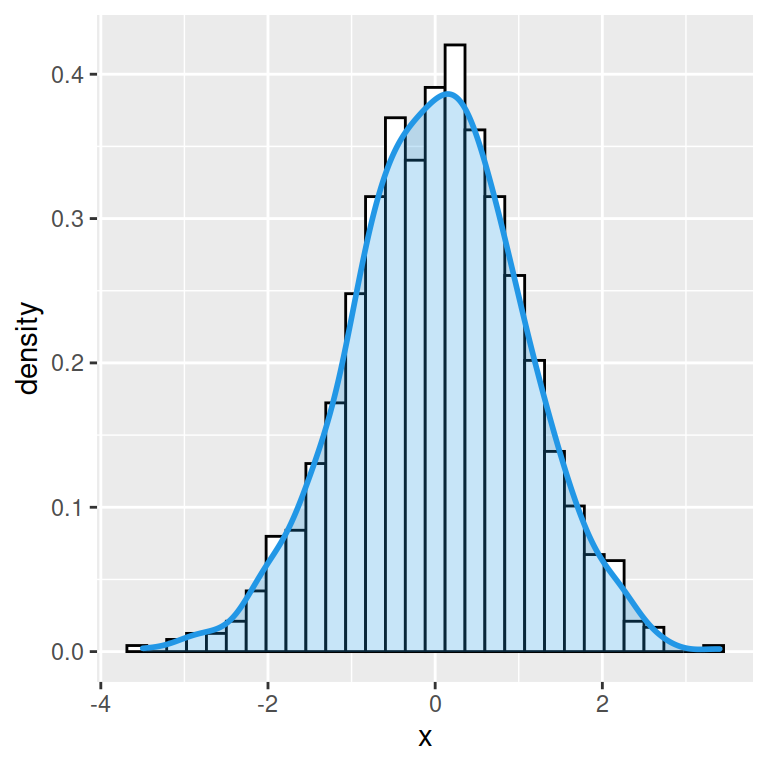
The hist function allows creating histograms in base R. By default, the function will create a frequency histogram.
# Sample data (exponential)
set.seed(1)
x <- rexp(400)

# Histogram
hist(x)
Color of the histogram

Fill color
You can change the default fill color of the histogram bars (gray since R 4.0.0) to other making use of the col argument.
# Sample data (exponential)
set.seed(1)
x <- rexp(400)

# Blue histogram
hist(x,       # Data
     col = 4) # Color
Border color
The border argument allows modifying the border color of the bars.
# Sample data (exponential)
set.seed(1)
x <- rexp(400)

# White histogram with blue borders
hist(x,
     col = "white", # Fill color
     border = 4)    # Border
Shading lines
You can also use shading lines instead of a fill color. Set them with the density argument and modify its angle with angle.
# Sample data (exponential)
set.seed(1)
x <- rexp(400)

# White histogram with shading lines
hist(x,
     col = 4,      # Color
     density = 10, # Shading lines
     angle = 20)   # Shading lines angle
Titles and labels
You can also modify the title, subtitle, and axes labels with main, sub, xlab and ylab arguments, respectively.
# Sample data (exponential)
set.seed(1)
x <- rexp(400)

# Histogram with titles
hist(x,
     main = "Title of the histogram", # Title
     sub = "Subtitle",                # Subtitle
     xlab = "X-axis label",           # X-axis label
     ylab = "Y-axis label")           # Y-axis label

