Box plot with jittered points with geom_jitter
Adding jittered points (a stripchart) to a box plot in ggplot is useful to see the underlying distribution of the data. To add these points you will need to use geom_jitter.
# install.packages("ggplot2")
library(ggplot2)

# Data
set.seed(8)
y <- rnorm(200)
df <- data.frame(y)

# Basic box plot
ggplot(df, aes(x = "", y = y)) +
  geom_boxplot() +
  geom_jitter()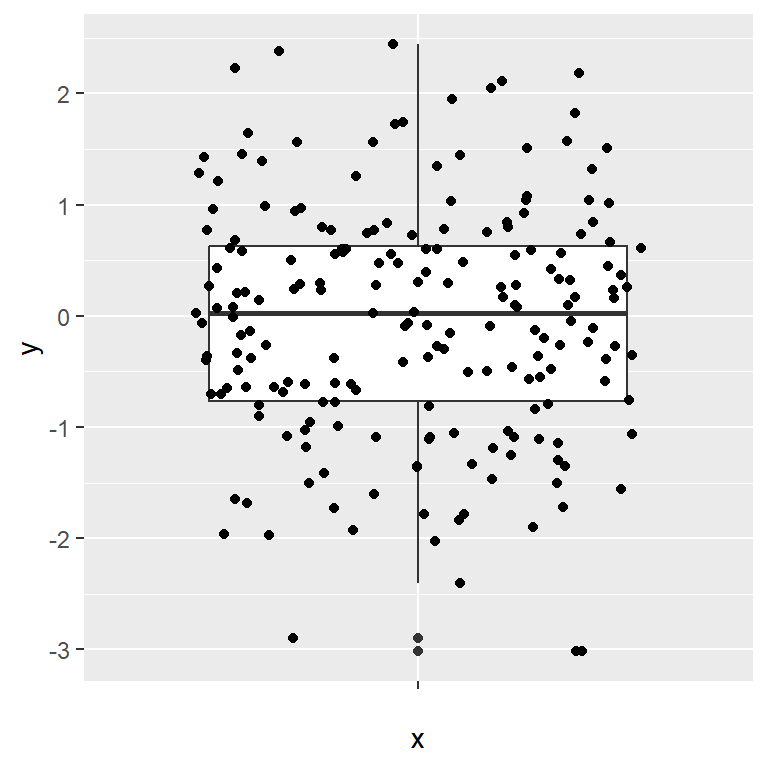
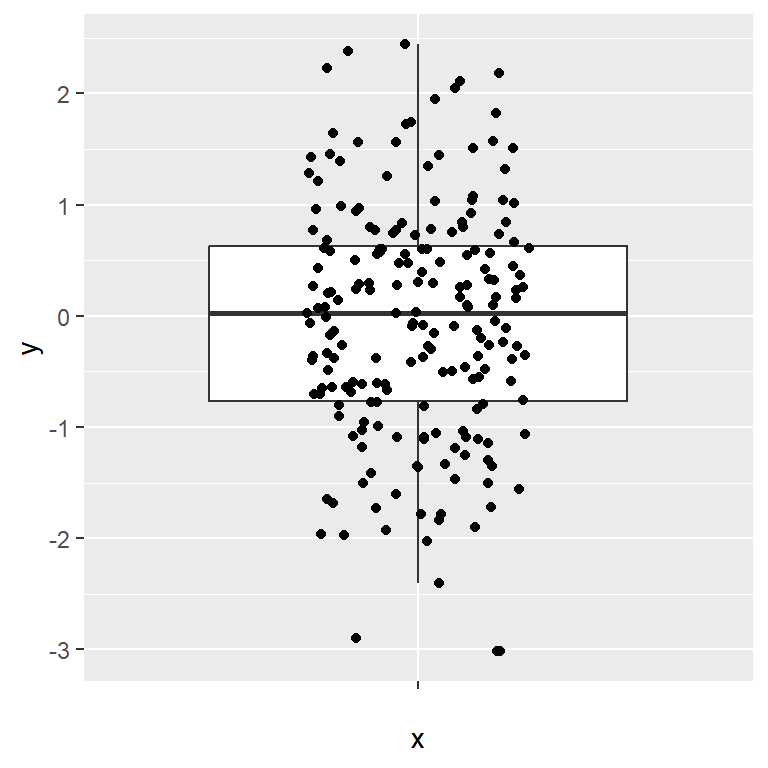
A good practice is removing the outliers of the box plot with outlier.shape = NA, as the jitter will add them again.
# install.packages("ggplot2")
library(ggplot2)

# Data
set.seed(8)
y <- rnorm(200)
df <- data.frame(y)

# Basic box plot
ggplot(df, aes(x = "", y = y)) +
  geom_boxplot(outlier.shape = NA) +
  geom_jitter()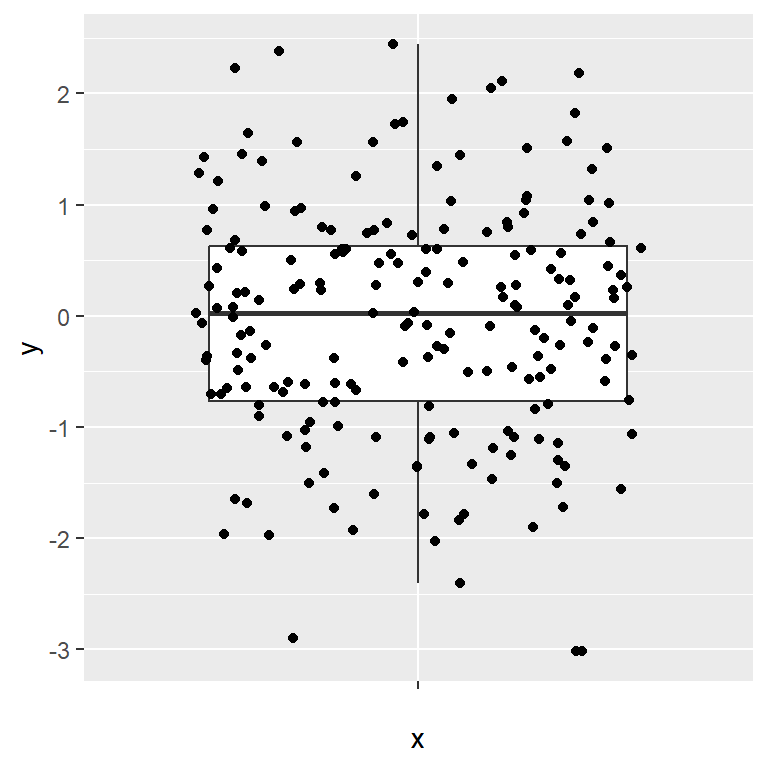
Recall that you can flip the axes with coord_flip or flipping the variables inside aes.
# install.packages("ggplot2")
library(ggplot2)

# Data
set.seed(8)
y <- rnorm(200)
df <- data.frame(y)

# Basic box plot
ggplot(df, aes(x = "", y = y)) +
  geom_boxplot(outlier.shape = NA) +
  geom_jitter() +
  coord_flip()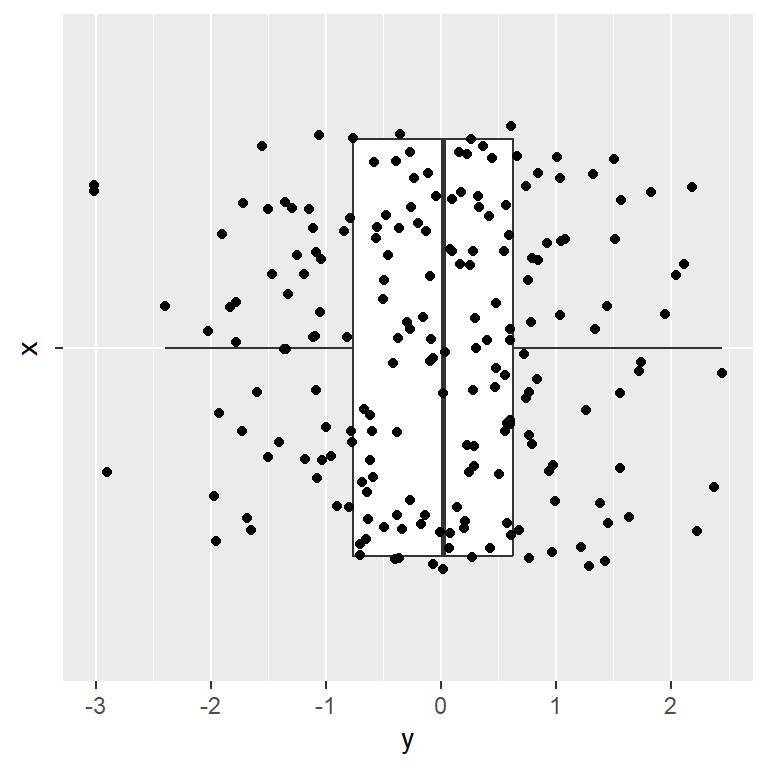
Customization of the jittered points
The jittered points can be customized in several ways. You can change the amount of jitter with width, the color of the points, its shape or its size, as shown in the examples below.
Width
# install.packages("ggplot2")
library(ggplot2)

# Data
set.seed(8)
y <- rnorm(200)
df <- data.frame(y)

# Basic box plot
ggplot(df, aes(x = "", y = y)) +
  geom_boxplot(outlier.shape = NA) +
  geom_jitter(width = 0.2)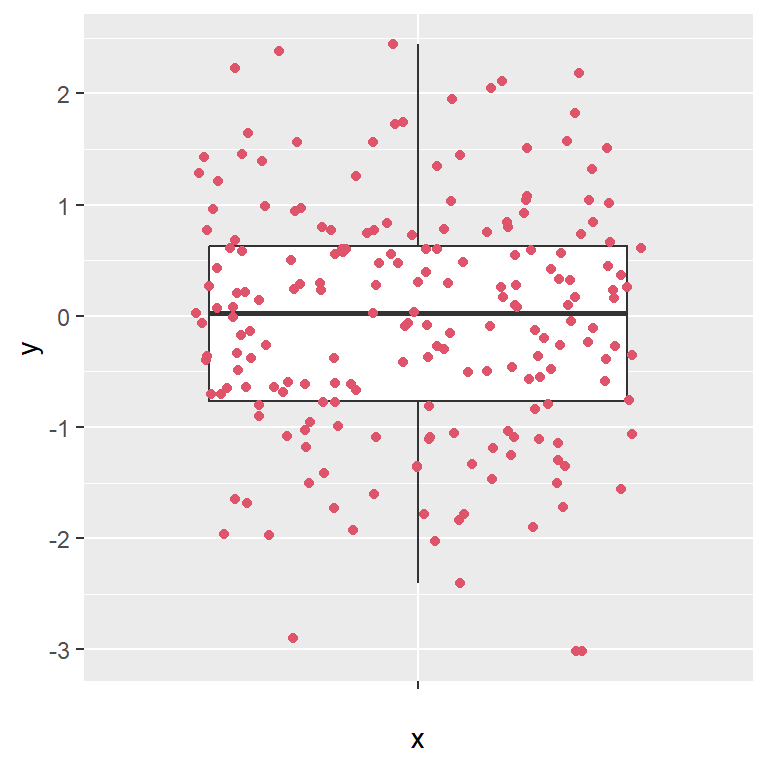
Colour
# install.packages("ggplot2")
library(ggplot2)

# Data
set.seed(8)
y <- rnorm(200)
df <- data.frame(y)

# Basic box plot
ggplot(df, aes(x = "", y = y)) +
  geom_boxplot(outlier.shape = NA) +
  geom_jitter(colour = 2)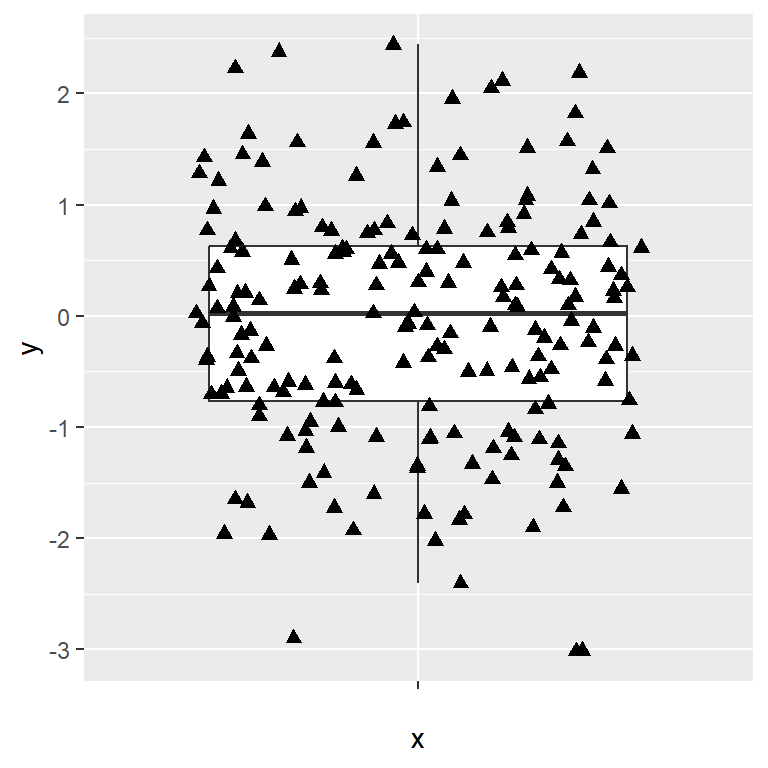
Shape and size
# install.packages("ggplot2")
library(ggplot2)

# Data
set.seed(8)
y <- rnorm(200)
df <- data.frame(y)

# Basic box plot
ggplot(df, aes(x = "", y = y)) +
  geom_boxplot(outlier.shape = NA) +
  geom_jitter(shape = 17, size = 2)
Box plot by group with jitter
If you have a categorical variable representing groups you can create a box plot by group and add the points to each group and customize its color, size and shape.
Jitter by group
# install.packages("ggplot2")
library(ggplot2)

# Data
set.seed(8)
y <- rnorm(200)
group <- sample(LETTERS[1:3], size = 200,
                replace = TRUE)
df <- data.frame(y, group)

# Box plot by group with jitter
ggplot(df, aes(x = group, y = y)) +
  geom_boxplot(outlier.shape = NA) +
  geom_jitter()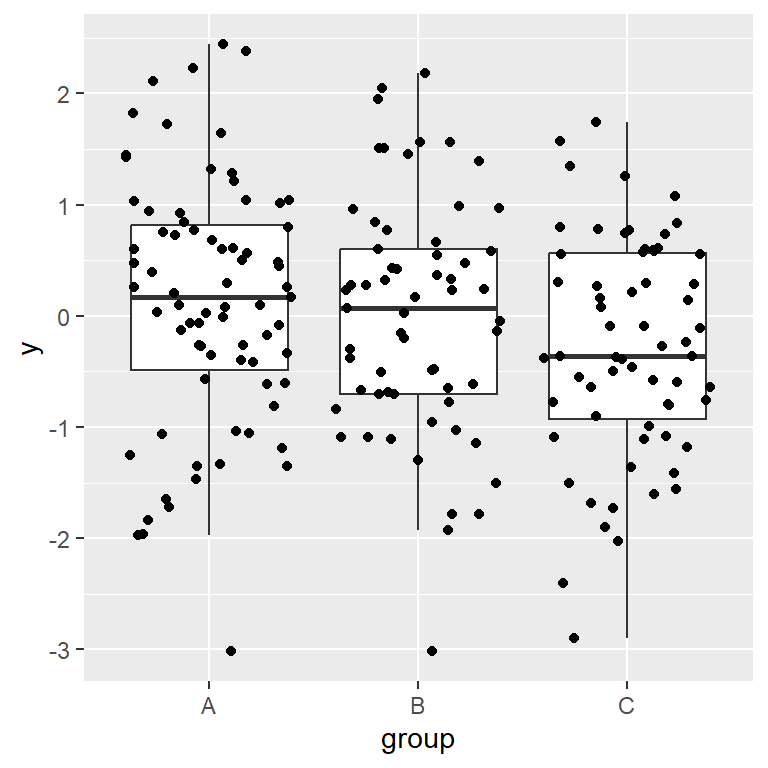
Jitter by group with custom color
# install.packages("ggplot2")
library(ggplot2)

# Data
set.seed(8)
y <- rnorm(200)
group <- sample(LETTERS[1:3], size = 200,
                replace = TRUE)
df <- data.frame(y, group)

# Box plot by group with jitter
ggplot(df, aes(x = group, y = y)) +
  geom_boxplot(outlier.shape = NA) +
  geom_jitter(colour = 2)
Jitter by group with color by group
# install.packages("ggplot2")
library(ggplot2)

# Data
set.seed(8)
y <- rnorm(200)
group <- sample(LETTERS[1:3], size = 200,
                replace = TRUE)
df <- data.frame(y, group)

# Box plot by group with jitter
ggplot(df, aes(x = group, y = y, colour = group)) +
  geom_boxplot(outlier.shape = NA) +
  geom_jitter()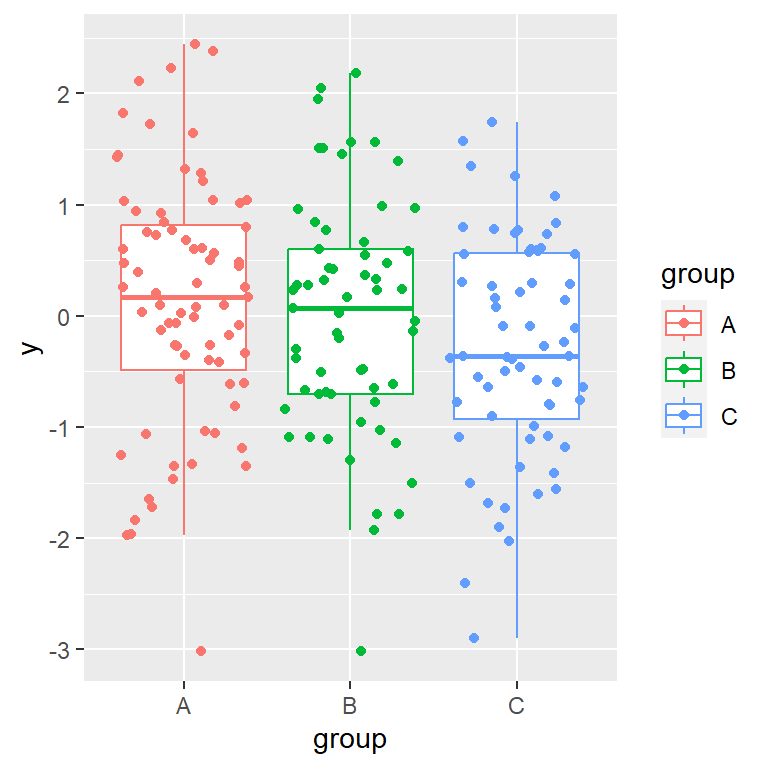
Jitter by group with custom shape
# install.packages("ggplot2")
library(ggplot2)

# Data
set.seed(8)
y <- rnorm(200)
group <- sample(LETTERS[1:3],
                size = 200,
                replace = TRUE)
df <- data.frame(y, group)

# Box plot by group with jitter
ggplot(df, aes(x = group, y = y,
               colour = group,
               shape = group)) +
  geom_boxplot(outlier.shape = NA) +
  geom_jitter()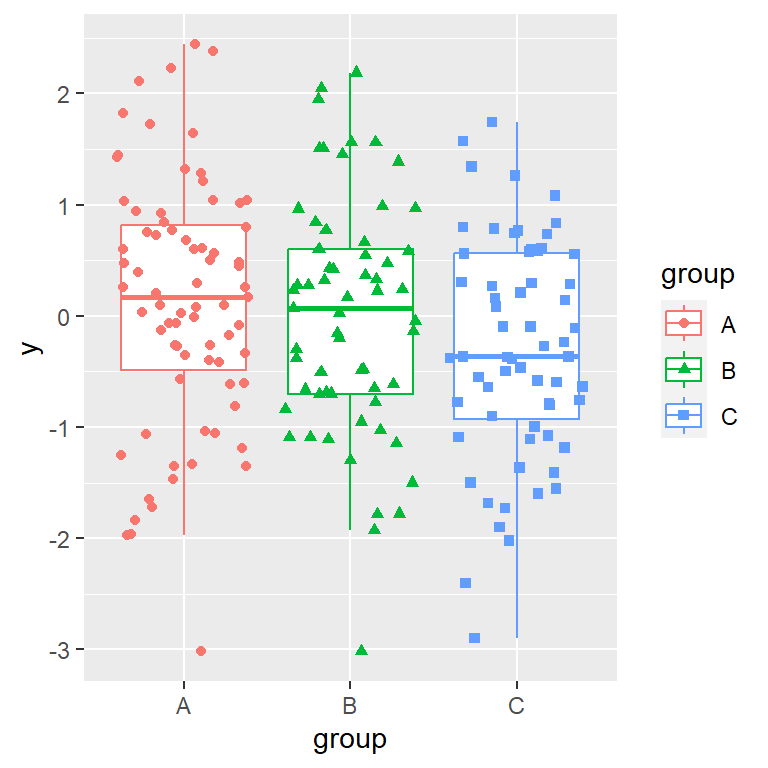

Master Statistics
Learn statistics from the basics to advanced techniques, clearly explained
Go to site