Basic ridgeline plot in base R
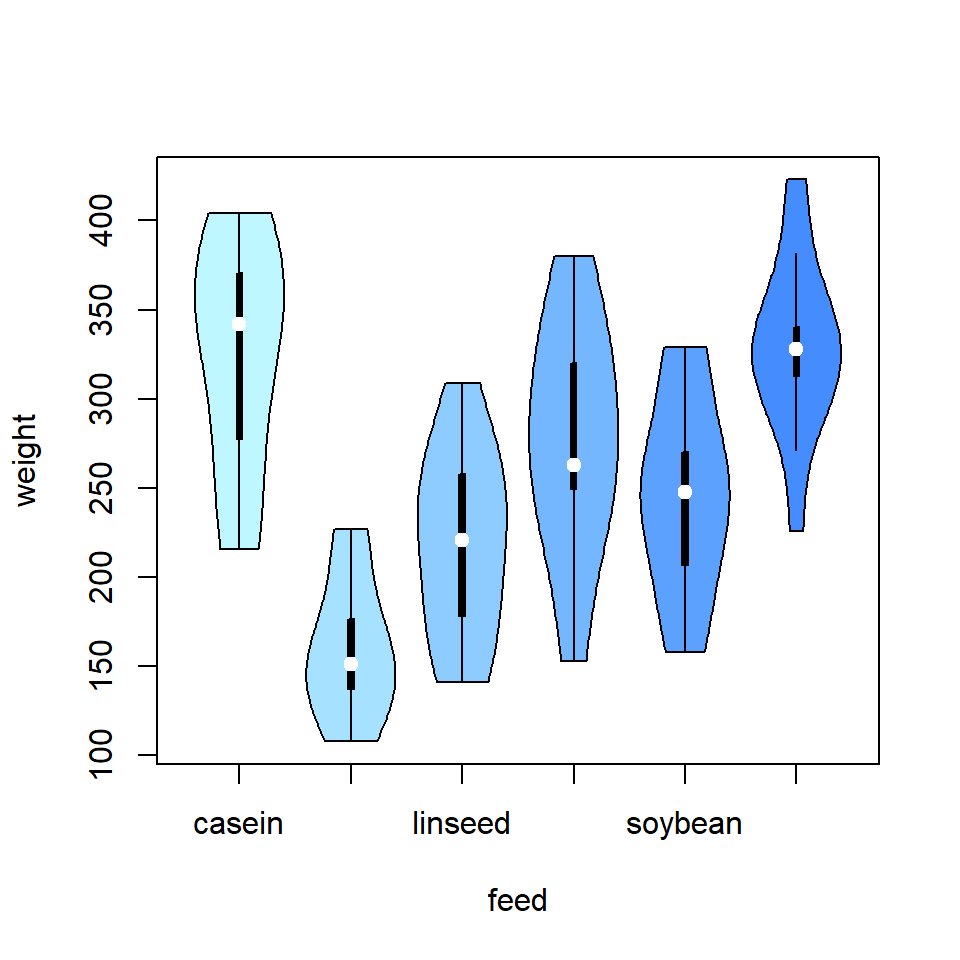
The ridgeline package contains a function of the same name which can be used to create ridgeline plots in base R. You will need to input a numeric variable and a categorical variable representing groups. In this example we are going to use the chickwts dataset.
# install.packages("remotes")
remotes::install_github("R-CoderDotCom/ridgeline@main")

library(ridgeline)

ridgeline(chickwts$weight, chickwts$feed)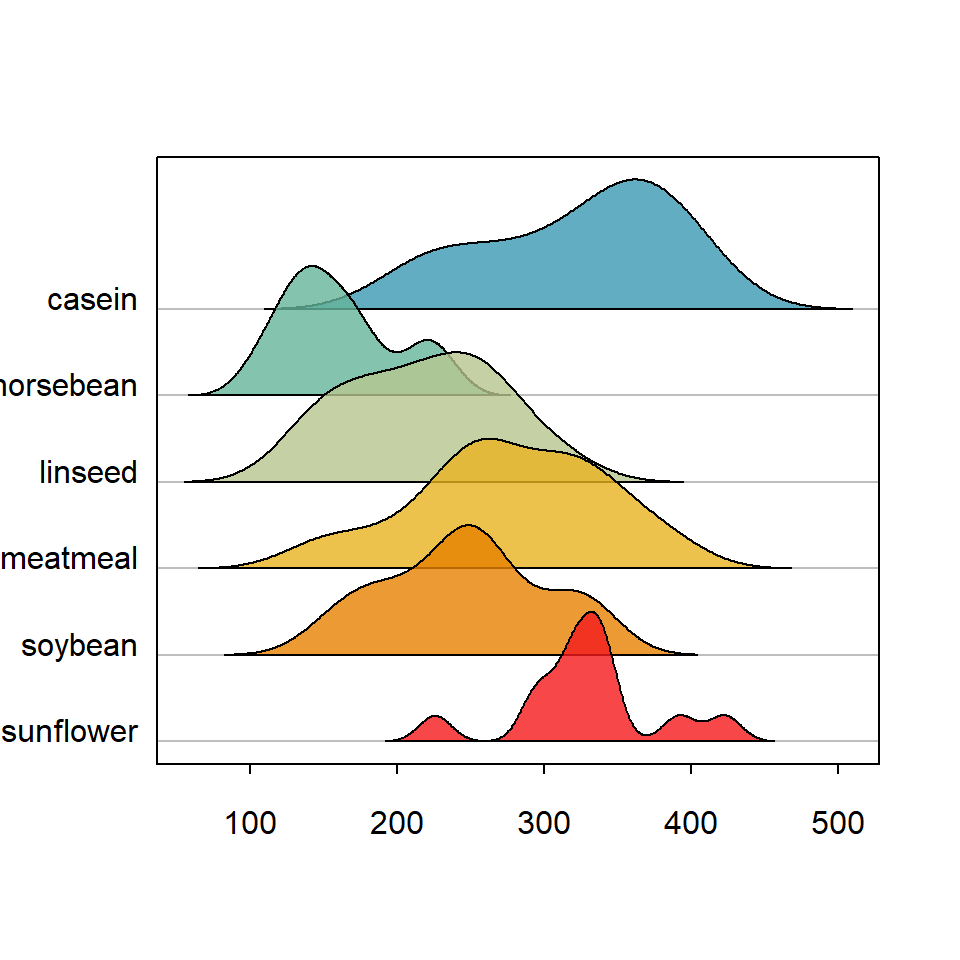
ridgeline bandwidth selection
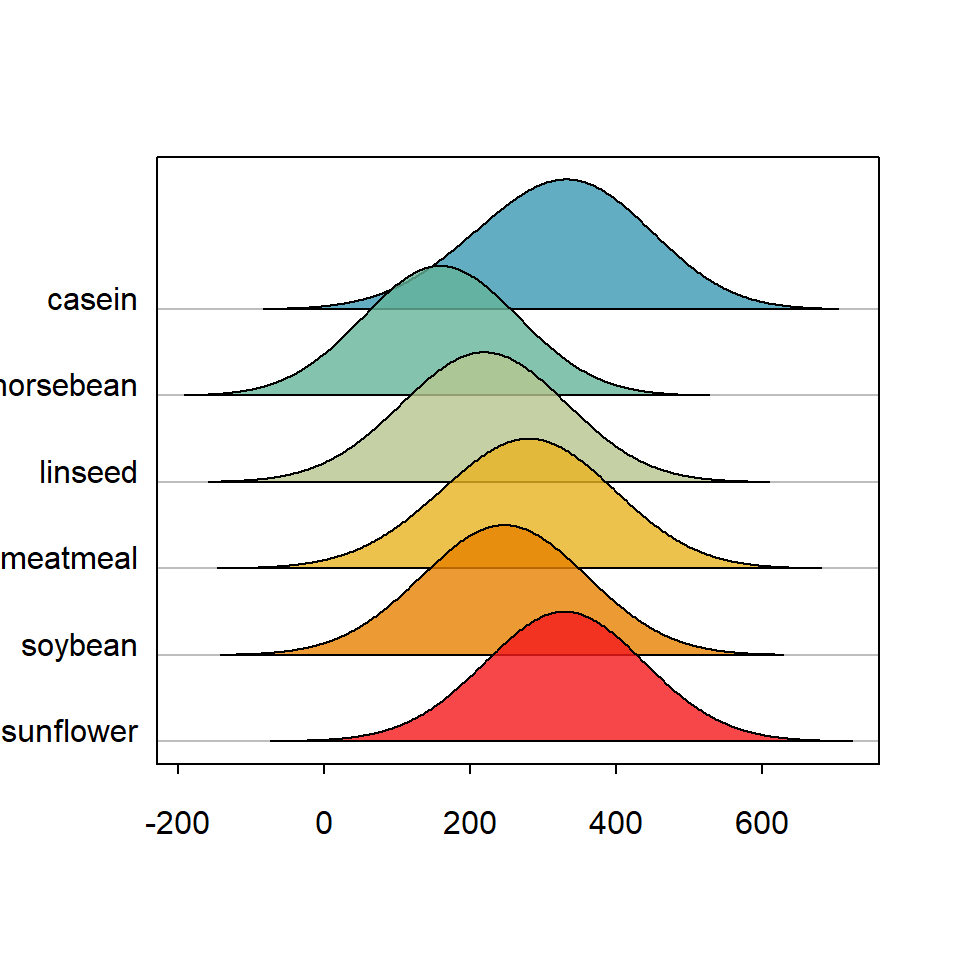
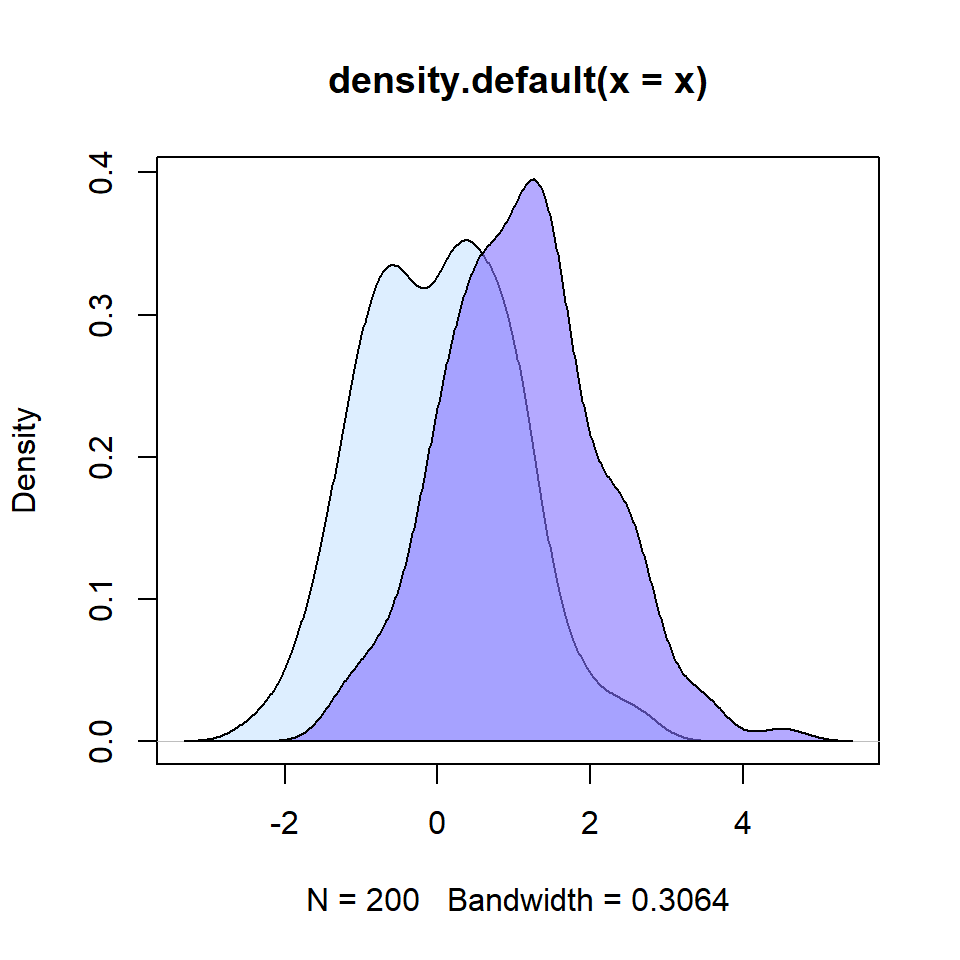
The kernel density estimate for each group is done with density function. The default value to calculate the bandwidth is "nrd0" (see ?density for more details), but you can also specify the value you desire.
library(ridgeline)

ridgeline(chickwts$weight, chickwts$feed,
          bw = 100)
ridgeline color palette
The default color palette is "Zissou" but you can specify any color, vector of colors or palette to colorize the density areas with palette argument. In the following example we are setting the viridis palette with alpha 0.85.
library(ridgeline)

ridgeline(chickwts$weight, chickwts$feed,
          palette = hcl.colors(6, palette = "viridis",
                               alpha = 0.85))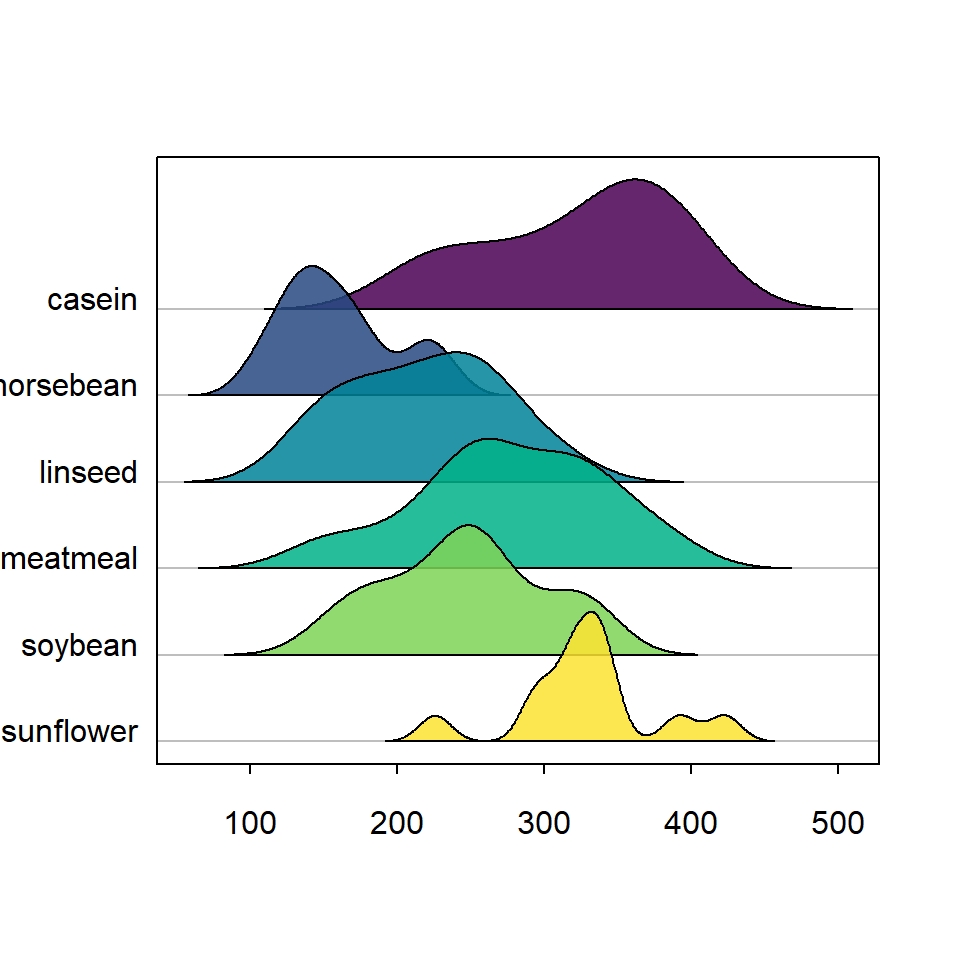
Border
The border color for each density can also be modified making use of border. In this example we are setting the same color as the area color, but you could also set lty = 0. You can also change the width of the border with lwd.
library(ridgeline)

ridgeline(chickwts$weight, chickwts$feed,
          palette = hcl.colors(6, palette = "viridis",
                               alpha = 0.85),
          border = hcl.colors(6, palette = "viridis",
                              alpha = 0.85))
Custom labels
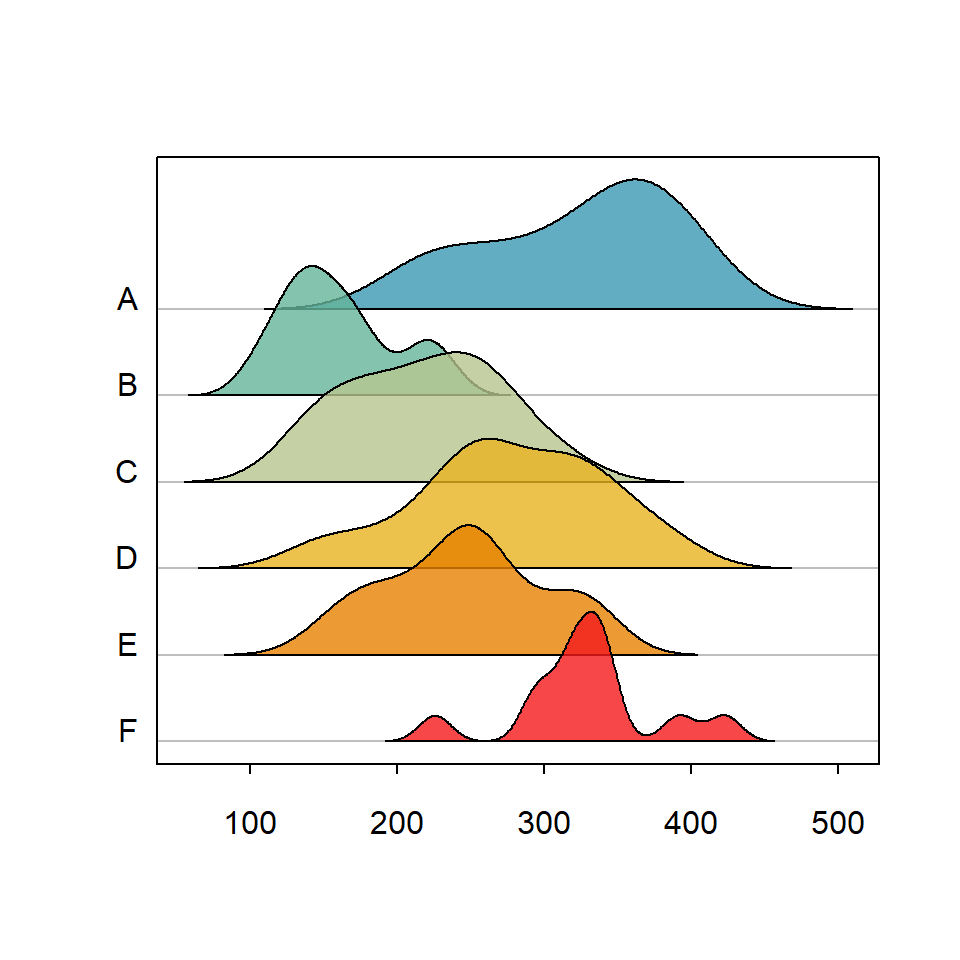
Custom labels
By default the function displays the names of the categorical variable along the Y-axis, but you can use your custom labels passing a vector to labels argument.
library(ridgeline)

ridgeline(chickwts$weight, chickwts$feed,
          labels = LETTERS[1:6])
Displaying the mode
Mode
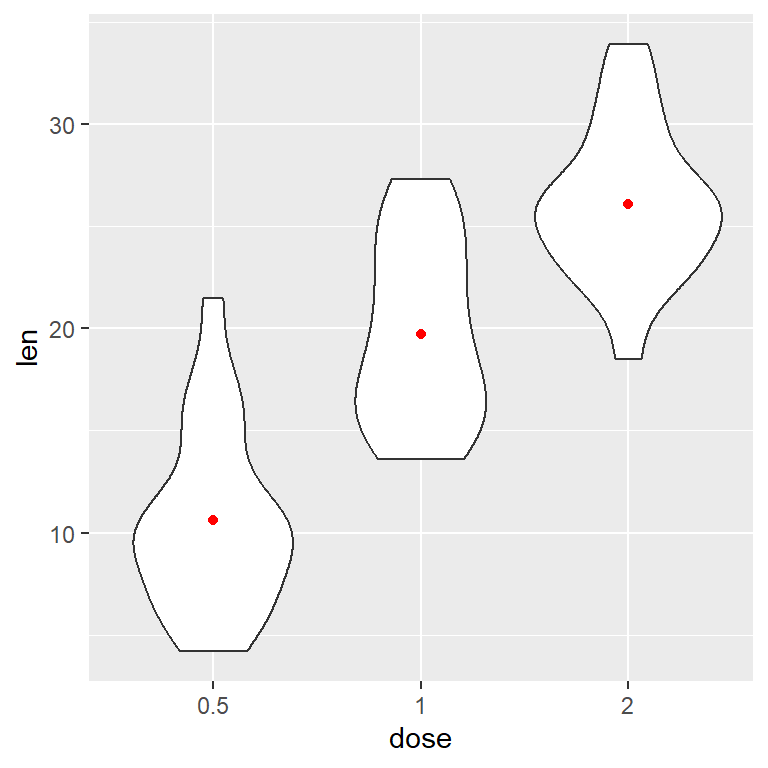
Finally, setting mode = TRUE the mode for each density is highlighted with a dashed line.
library(ridgeline)

ridgeline(chickwts$weight, chickwts$feed,
          mode = TRUE)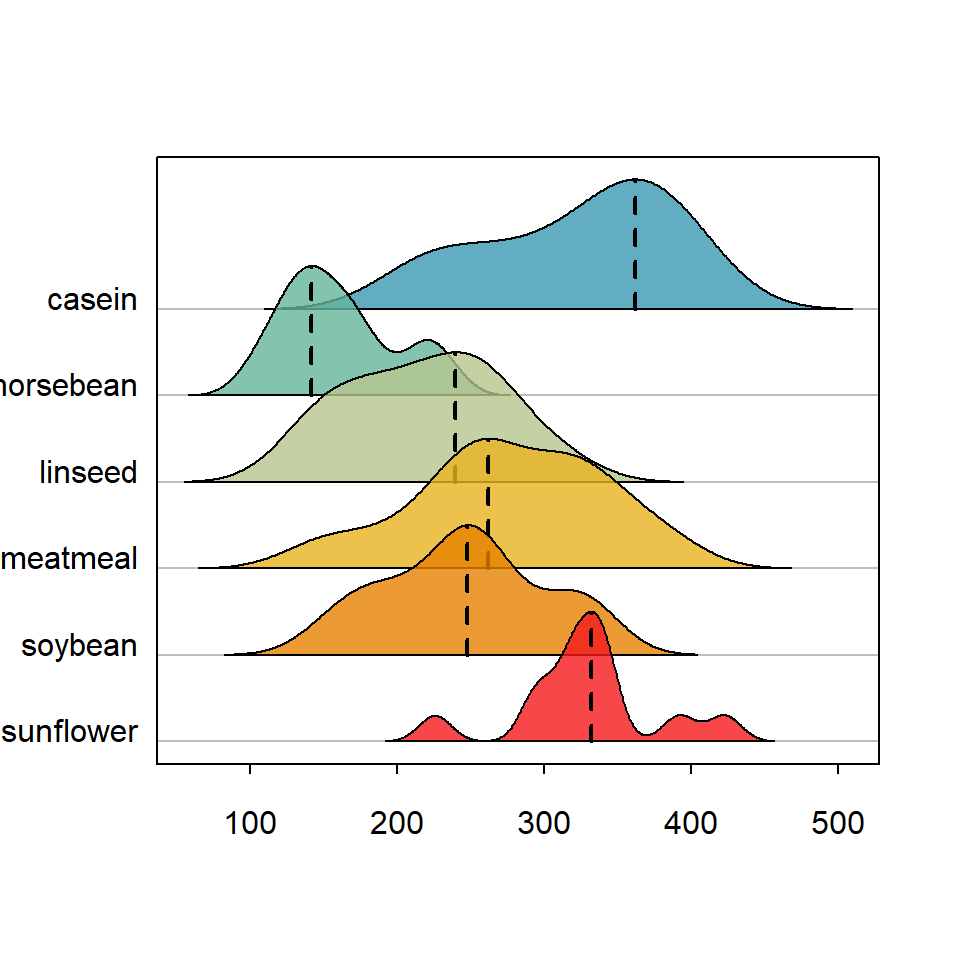

Master Statistics
Learn statistics from the basics to advanced techniques, clearly explained
Go to site