Sample data
In this tutorial we are going to use the following data frame, which contains a numerical variable and a categorical variable representing each group.
# Sample data set
set.seed(1)
df <- data.frame(x = LETTERS[1:10],
                 y = sample(20:35, 10, replace = TRUE))
Basic lollipop chart
Basic lollipop chart
Given a data frame with a categorical and a numerical variable it is possible to create a lollipop chart in ggplot2 combining geom_segment and geom_point.
# install.packages("ggplot2")
library(ggplot2)

ggplot(df, aes(x = x, y = y)) +
  geom_segment(aes(x = x, xend = x, y = 0, yend = y)) +
geom_point() 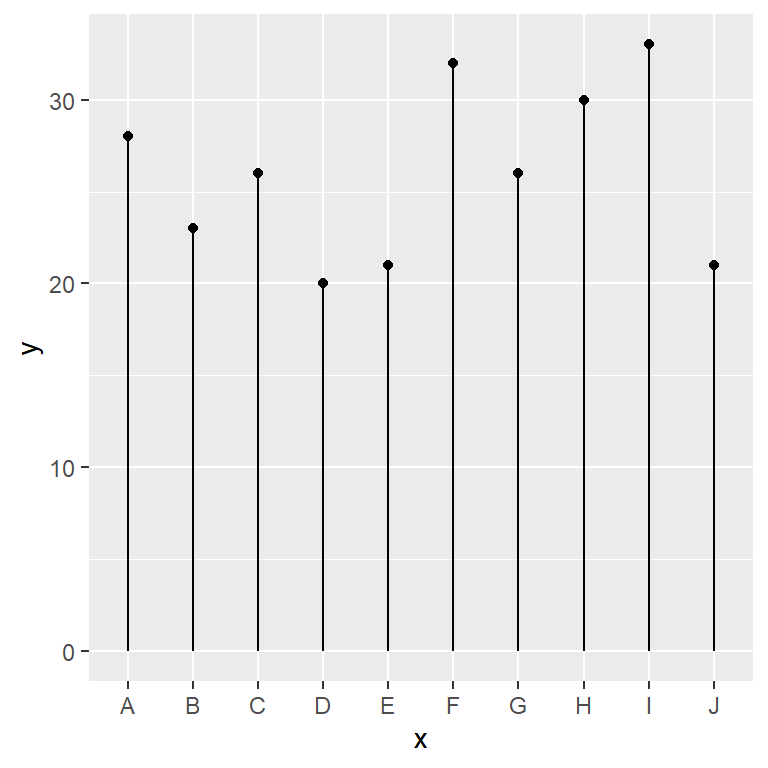
Horizontal lollipop chart
Note that in several scenarios, specially if the labels of the categories are long it is recommended to create a horizontal chart. For that purpose you can use coord_flip or flip the order of the variables inside aes.
# install.packages("ggplot2")
library(ggplot2)

ggplot(df, aes(x = x, y = y)) +
  geom_segment(aes(x = x, xend = x, y = 0, yend = y)) +
  geom_point() +
  coord_flip()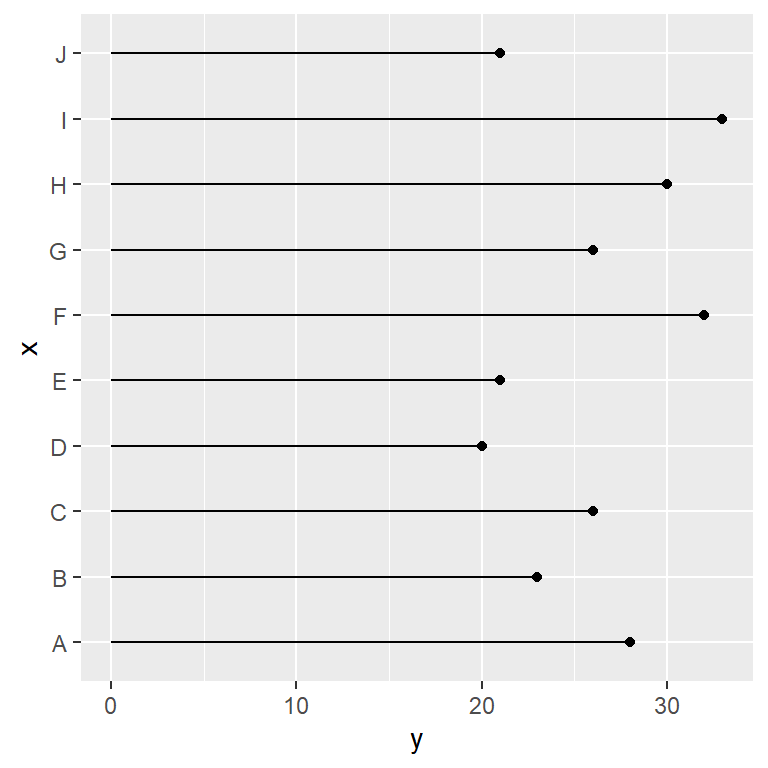
Lollipop customization
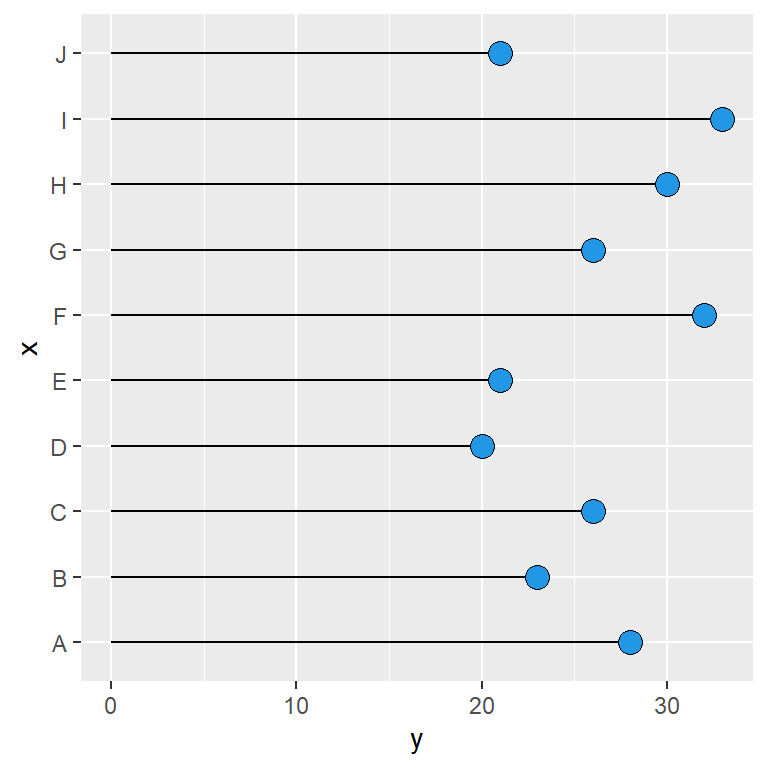
Points
The points can be customized passing arguments to the geom_point function. In the following example we are changing the size, the symbol, the background color and the border of the symbol.
# install.packages("ggplot2")
library(ggplot2)

ggplot(df, aes(x = x, y = y)) +
  geom_segment(aes(x = x, xend = x, y = 0, yend = y)) +
  geom_point(size = 4, pch = 21, bg = 4, col = 1) +
  coord_flip()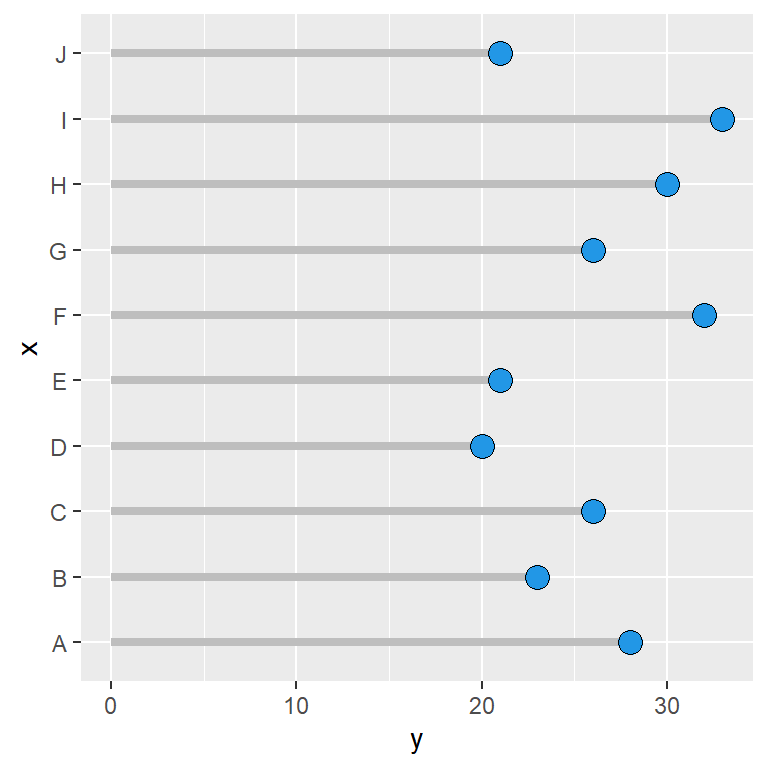
Segments
Similarly to customizing the points you can also customize the segments. In the example below we are setting its color to gray and increasing its width.
# install.packages("ggplot2")
library(ggplot2)

ggplot(df, aes(x = x, y = y)) +
  geom_segment(aes(x = x, xend = x, y = 0, yend = y),
               color = "gray", lwd = 1.5) +
  geom_point(size = 4, pch = 21, bg = 4, col = 1) +
  coord_flip()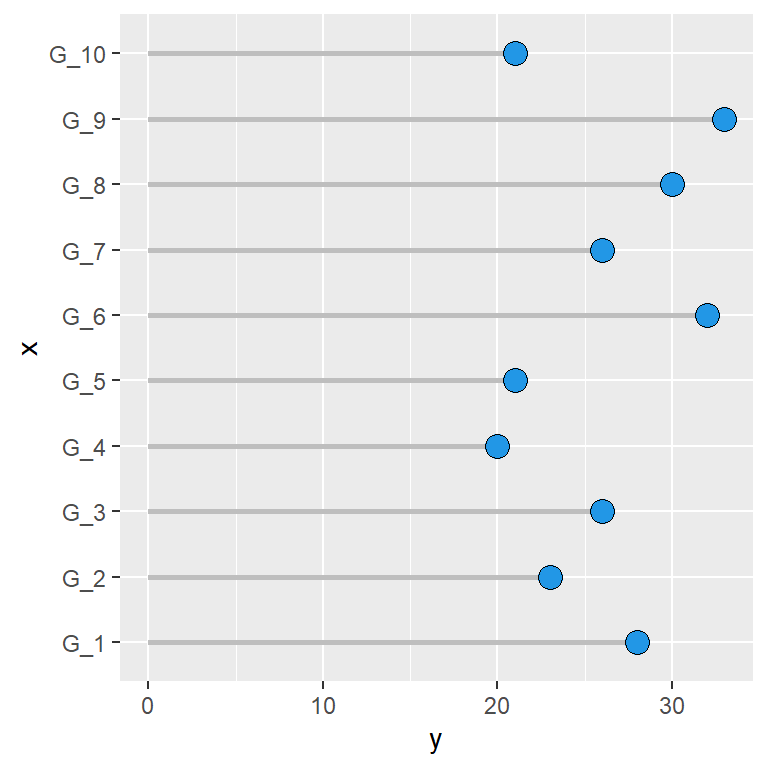
Custom labels
As the X-axis is discrete it is possible to change the labels of the categories with the labels argument of scale_x_discrete.
# install.packages("ggplot2")

ggplot(df, aes(x = x, y = y)) +
  geom_segment(aes(x = x, xend = x, y = 0, yend = y),
               color = "gray", lwd = 1) +
  geom_point(size = 4, pch = 21, bg = 4, col = 1) +
  scale_x_discrete(labels = paste0("G_", 1:10)) +
  coord_flip()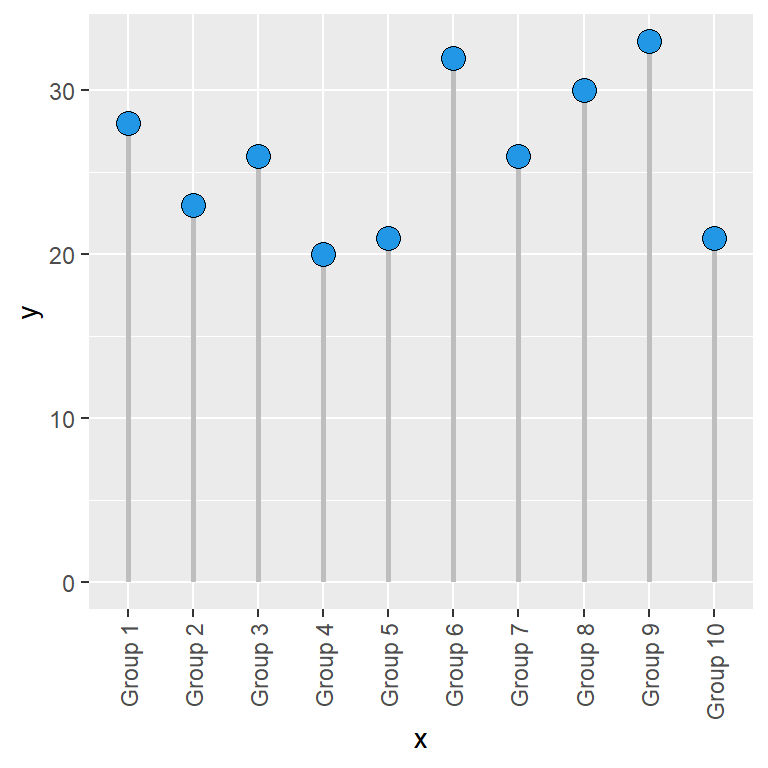
Rotate the labels
If the labels are too long they won’t fit. However, you can rotate the labels with the angle argument of the element_text function for the axis.text.x theme component.
# install.packages("ggplot2")
library(ggplot2)

ggplot(df, aes(x = x, y = y)) +
  geom_segment(aes(x = x, xend = x, y = 0, yend = y),
               color = "gray", lwd = 1) +
  geom_point(size = 4, pch = 21, bg = 4, col = 1) +
  scale_x_discrete(labels = paste("Group", 1:10)) +
  theme(axis.text.x = element_text(angle = 90,
                                   vjust = 0.5, hjust = 1))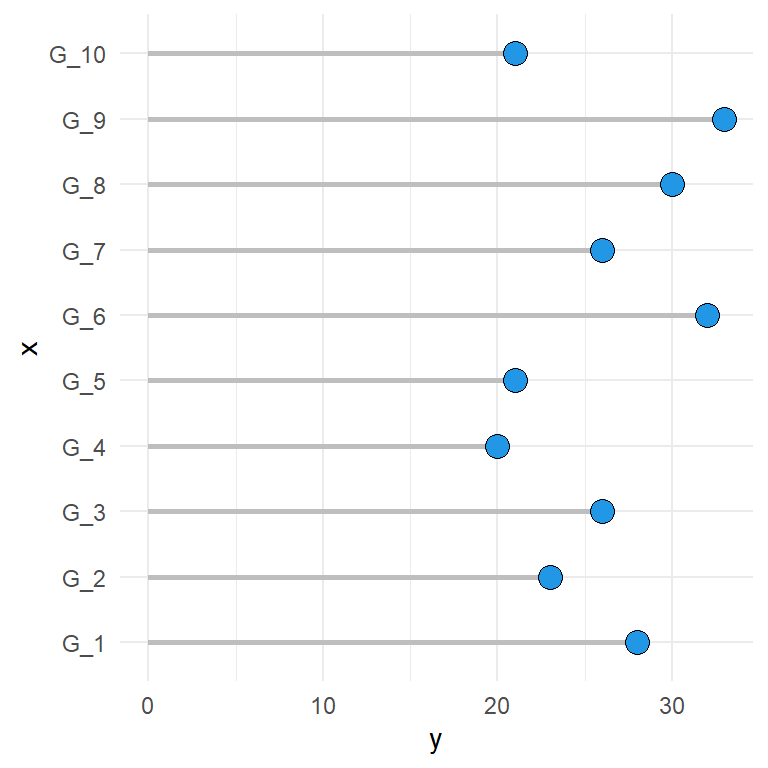
Theme
As in other plots made with ggplot it is possible to change the theme of the plot.
# install.packages("ggplot2")
library(ggplot2)

ggplot(df, aes(x = x, y = y)) +
  geom_segment(aes(x = x, xend = x, y = 0, yend = y),
               color = "gray", lwd = 1) +
  geom_point(size = 4, pch = 21, bg = 4, col = 1) +
  scale_x_discrete(labels = paste0("G_", 1:10)) +
  coord_flip() +
  theme_minimal()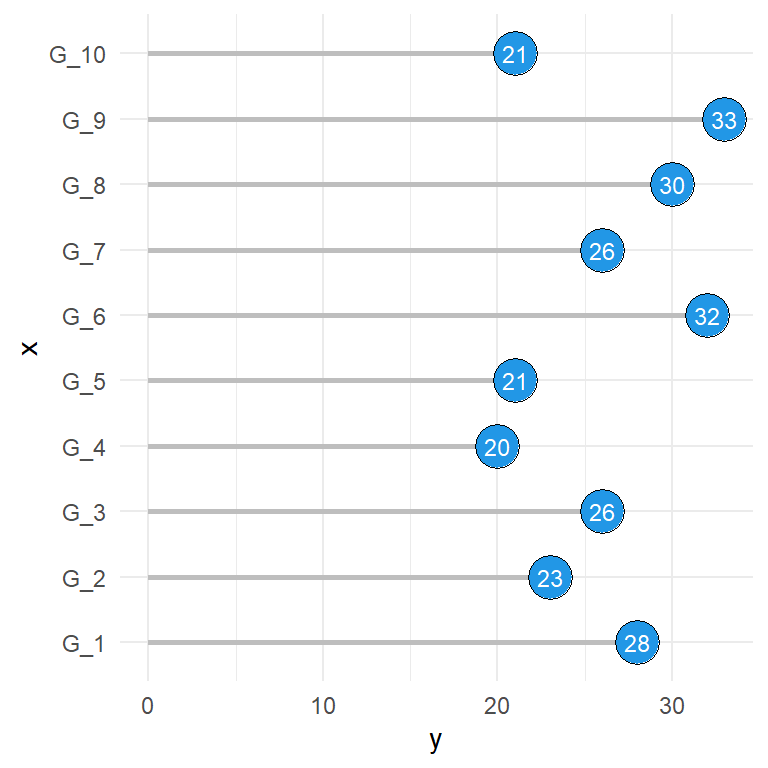
Text
Note that you can also add the corresponding values or other text inside the points making use of geom_text.
# install.packages("ggplot2")
library(ggplot2)

ggplot(df, aes(x = x, y = y)) +
  geom_segment(aes(x = x, xend = x, y = 0, yend = y),
               color = "gray", lwd = 1) +
  geom_point(size = 7.5, pch = 21, bg = 4, col = 1) +
  geom_text(aes(label = y), color = "white", size = 3) +
  scale_x_discrete(labels = paste0("G_", 1:10)) +
  coord_flip() +
  theme_minimal()
Lollipop order
Finally, you can reorder the lollipops reordering the levels of the categorical variable or making use of reorder or an equivalent function.
# install.packages("ggplot2")
library(ggplot2)

ggplot(df, aes(x = reorder(x, -y), y = y)) +
  geom_segment(aes(x = reorder(x, -y),
                   xend = reorder(x, -y),
                   y = 0, yend = y),
               color = "gray", lwd = 1) +
  geom_point(size = 4, pch = 21, bg = 4, col = 1) +
  xlab("Group") +
  ylab("") +
  coord_flip() +
  theme_minimal()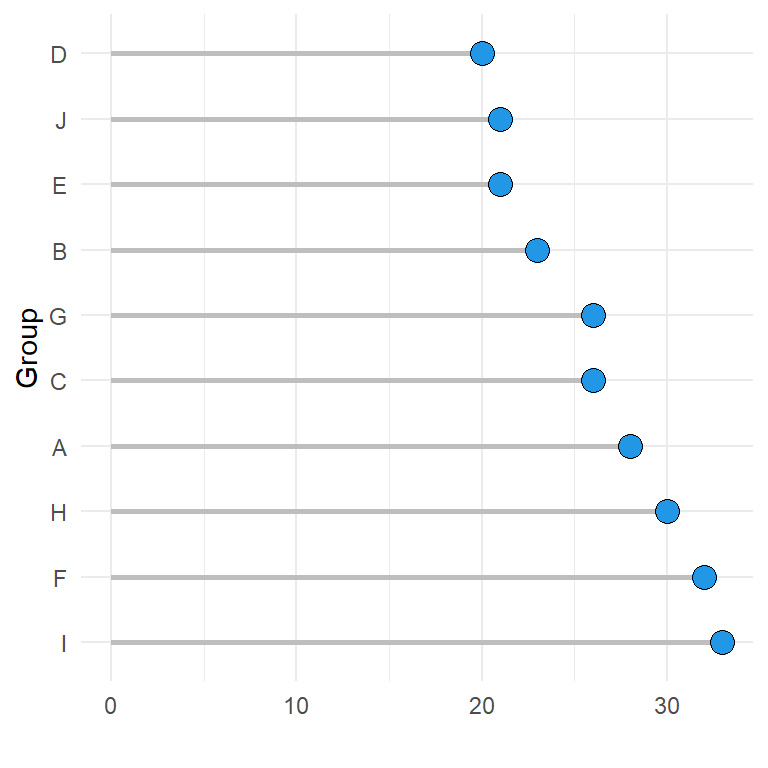

Master Statistics
Learn statistics from the basics to advanced techniques, clearly explained
Go to site