Sample data set
In the examples below we are going to use the iris data set, which consists on different measures about the length and width of the petals and the sepals of flowers of different species.
iris
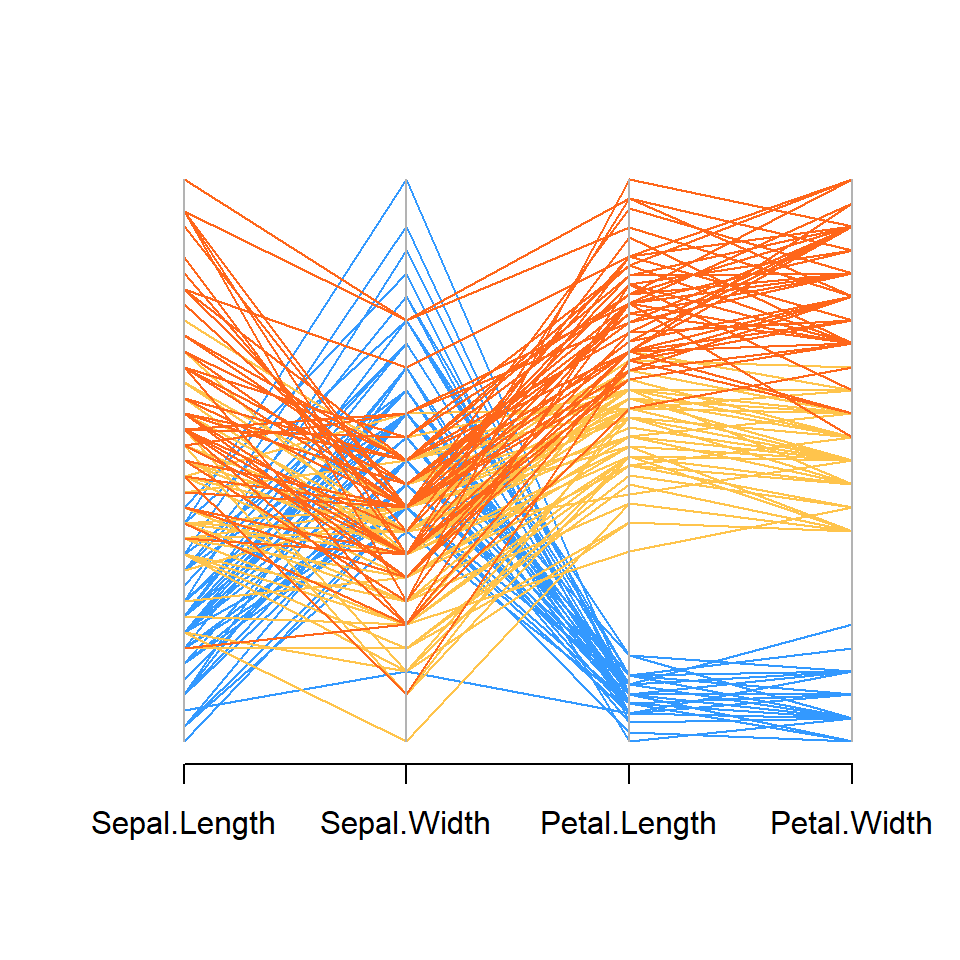
Most basic parallel coordinate plot with GGally
The ggparcoord function from GGally packages allows creating parallel coordinate plots based on ggplot2. To create a basic plot pass the data frame to the function.
# install.packages("GGally")
library(GGally)

ggparcoord(data = iris)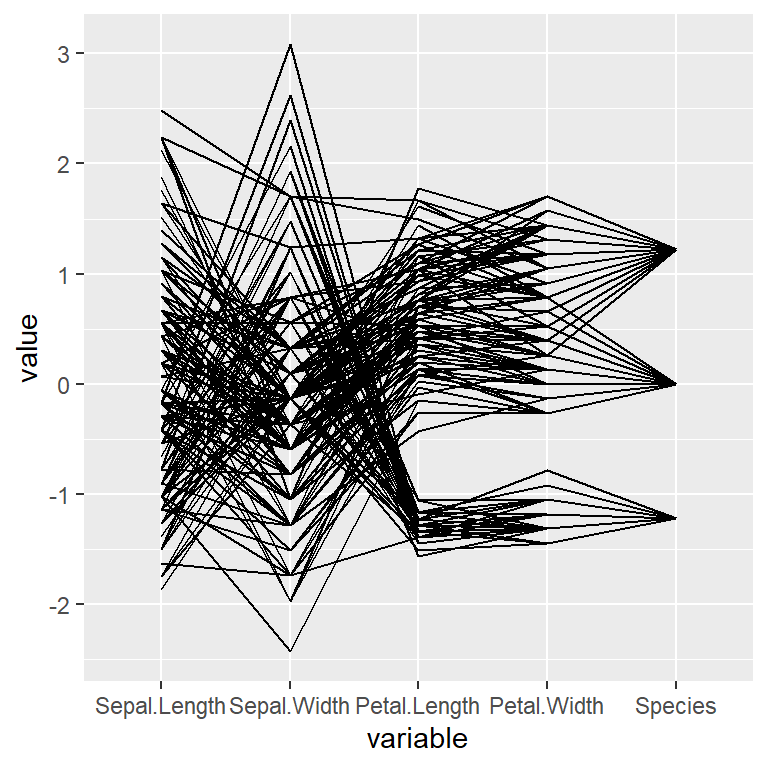
Selecting columns
If you want to select only some columns to be displayed on the X-axis pass a vector of variables to the columns argument.
# install.packages("GGally")
library(GGally)

ggparcoord(data = iris,
           columns = 1:4)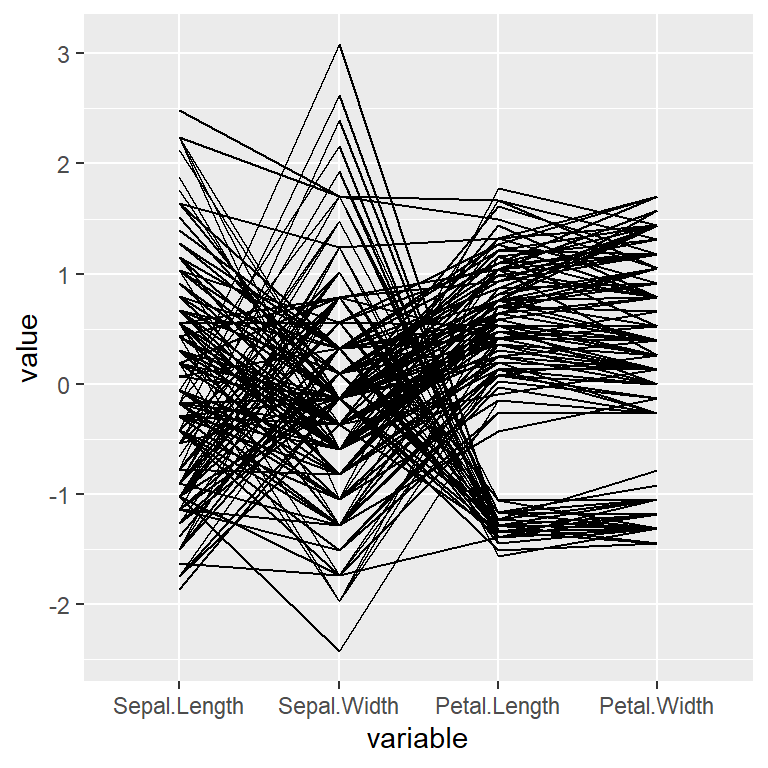
Transparency of the lines
The transparency of the lines can be controlled with alphaLines. If there are many lines it is recommended to decrease the level of transparency.
# install.packages("GGally")
library(GGally)

ggparcoord(data = iris,
           columns = 1:4,
           alphaLines = 0.2)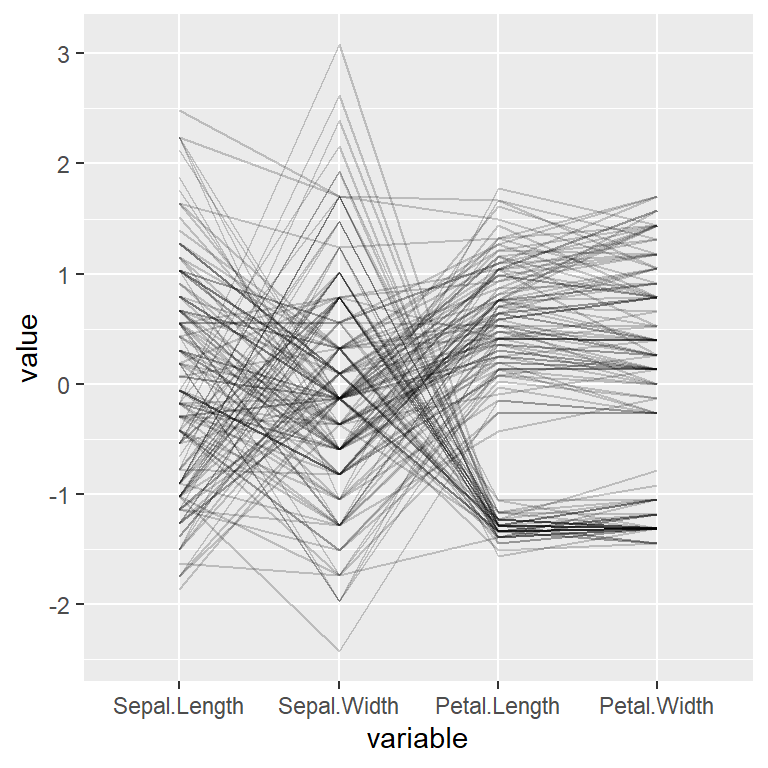
Color by group
If the data set contains a categorical variable representing groups you can pass it to the groupColumn argument to colorize the lines by group.
# install.packages("GGally")
library(GGally)

ggparcoord(data = iris,
           columns = 1:4,
           groupColumn = "Species")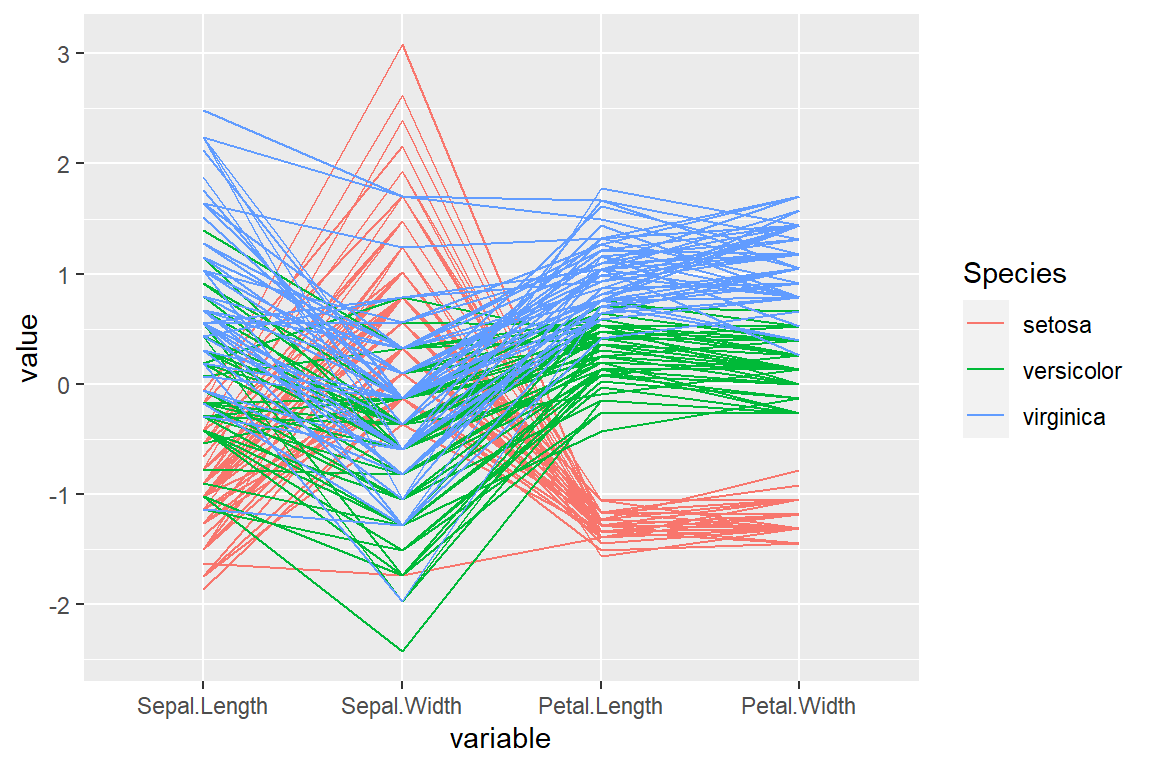
Color customization
As the ggparcoord is based on ggplot you can change the color of the lines with scale_color_manual or scale_color_brewer, for instance.
# install.packages("GGally")
library(GGally)

ggparcoord(data = iris,
           columns = 1:4,
           groupColumn = "Species") +
           scale_color_brewer(palette = "Set2")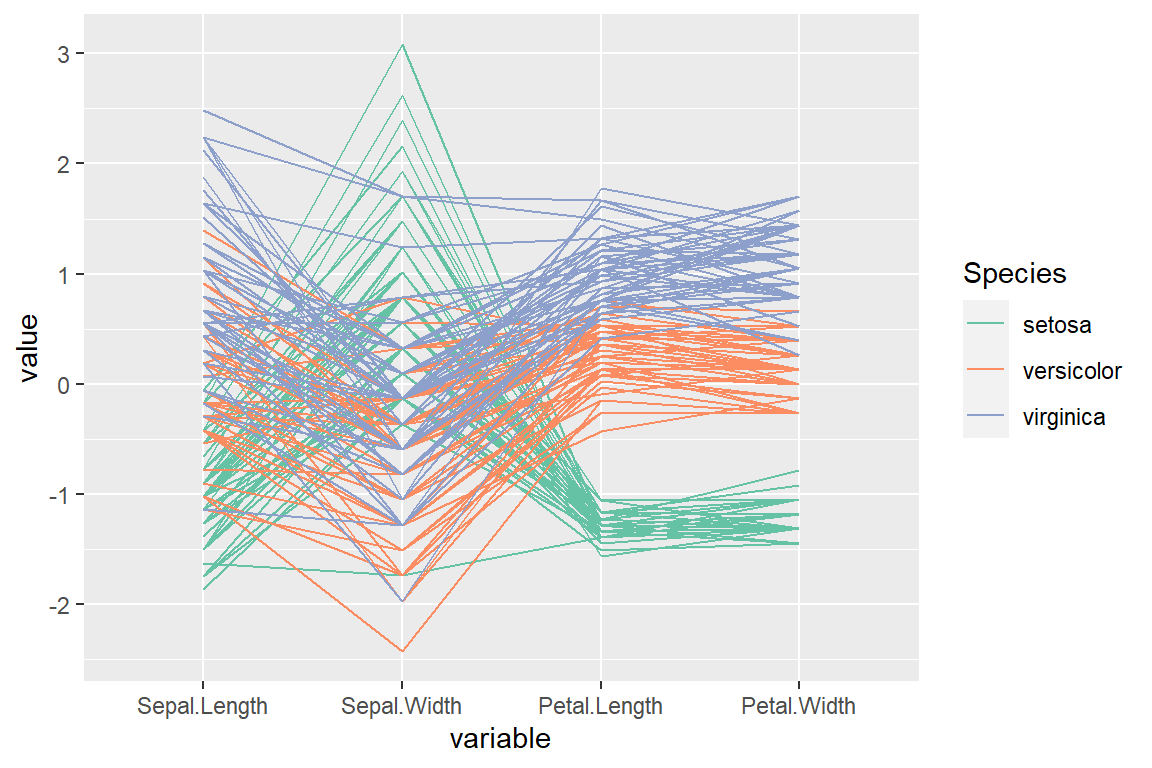
Adding points
The function provides a logical argument named showPoints which can be set to TRUE to plot the points.
# install.packages("GGally")
library(GGally)

ggparcoord(data = iris,
           columns = 1:4,
           groupColumn = "Species",
           showPoints = TRUE) +
           scale_color_brewer(palette = "Set2")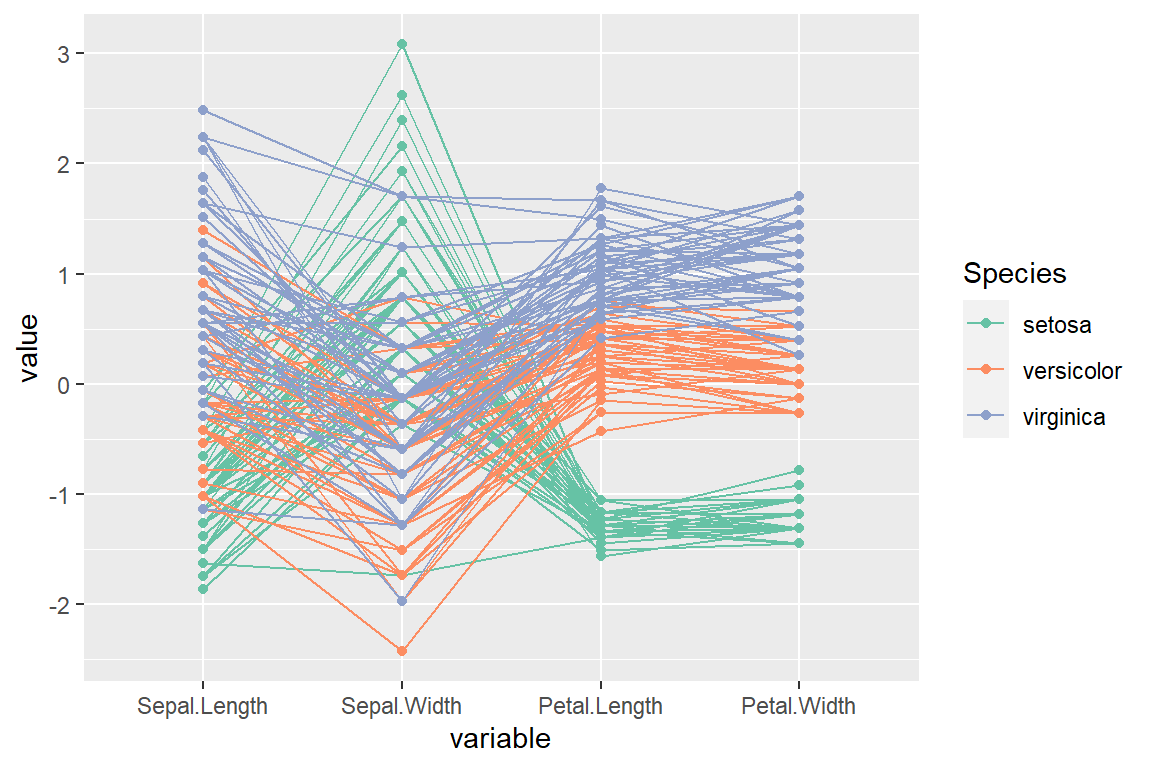
Spline interpolation
The lines can be smoothed via spline interpolation setting splineFactor = TRUE.
# install.packages("GGally")
library(GGally)

ggparcoord(data = iris,
           columns = 1:4,
           groupColumn = "Species",
           splineFactor = TRUE) +
           scale_color_brewer(palette = "Set2")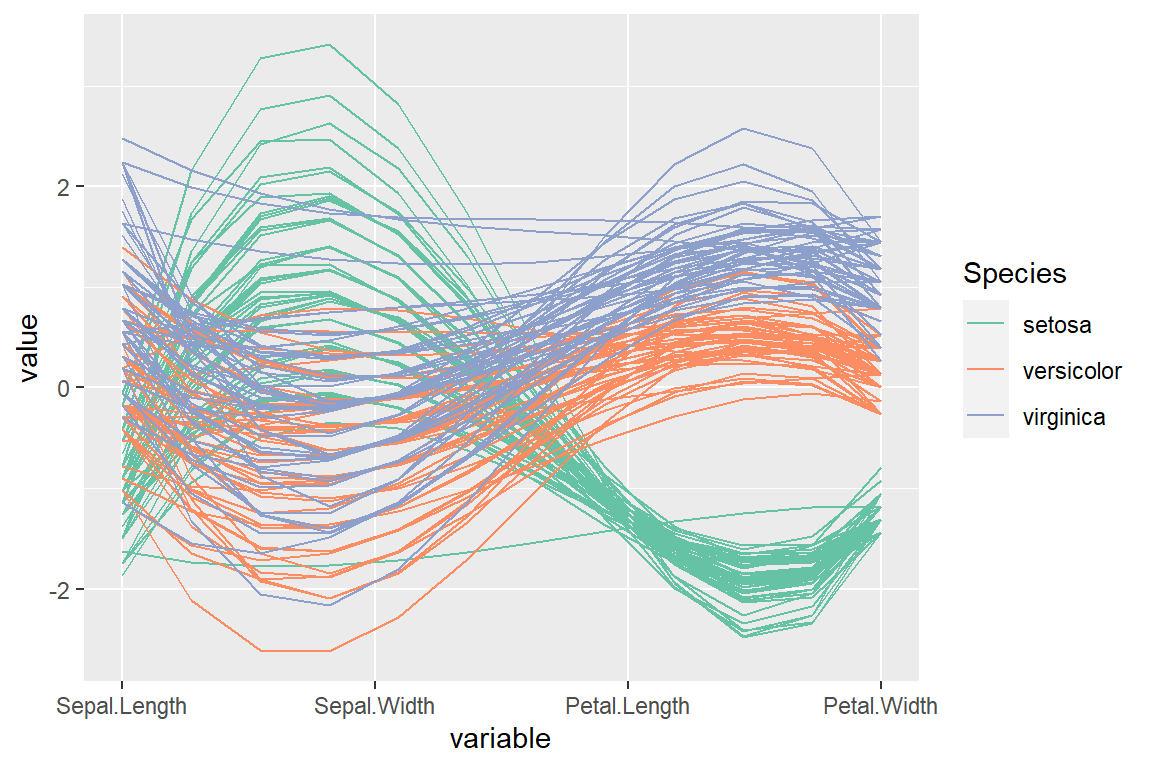
Adding box plots
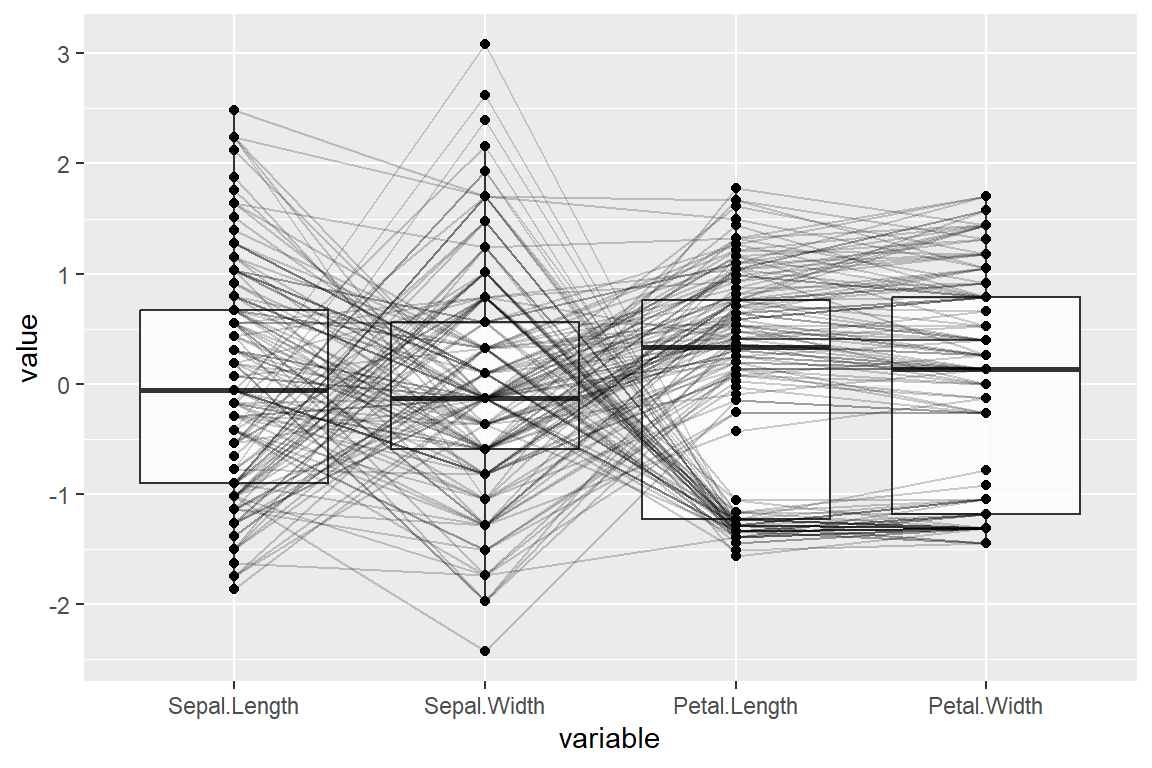
It is possible to add box plots for each variable setting boxplot = TRUE.
# install.packages("GGally")
library(GGally)

ggparcoord(data = iris,
           columns = 1:4,
           alphaLines = 0.2,
           showPoints = TRUE,
           boxplot = TRUE)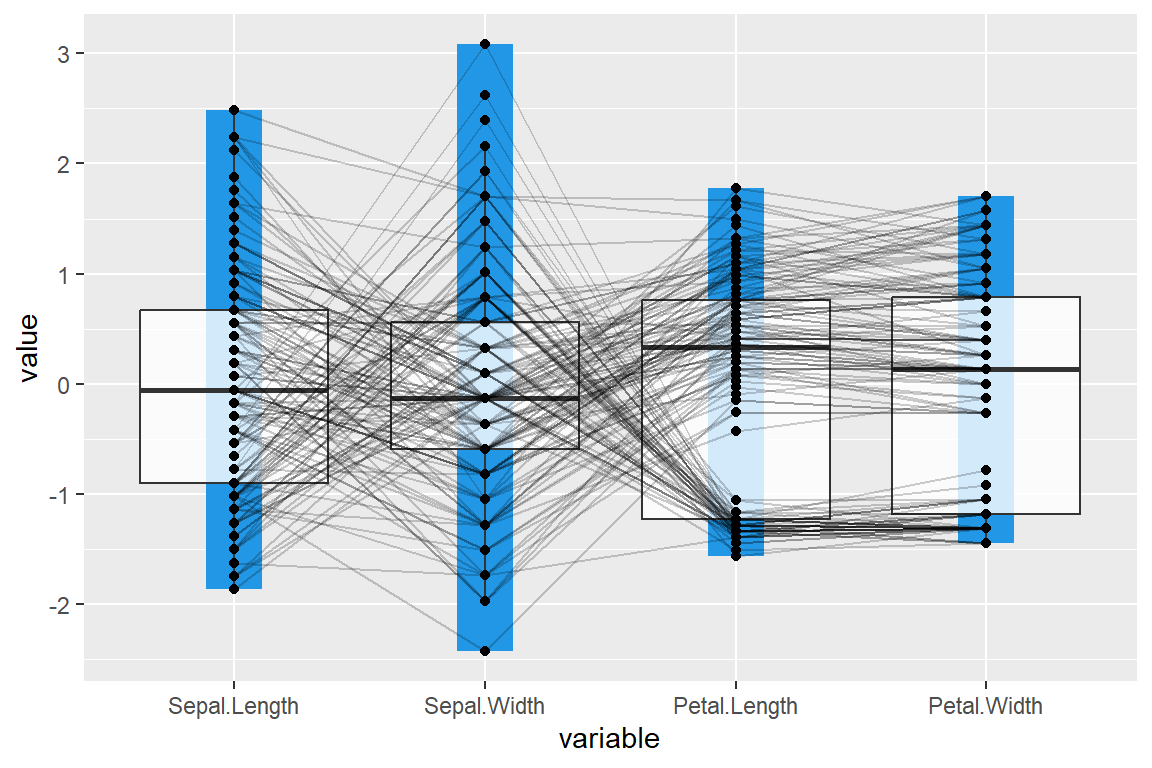
You can also add a box from the maximum to the minimun for each variable.
# install.packages("GGally")
library(GGally)

ggparcoord(data = iris,
           columns = 1:4,
           alphaLines = 0.2,
           showPoints = TRUE,
           boxplot = TRUE,
           shadeBox = 4)
Scaling methods
The function provides several scaling methods that can be selected with the scale argument. The default method is "std" and the other possible options are displayed below. Type ?ggparcoord for additional information.
“robust” scale
# install.packages("GGally")
library(GGally)

ggparcoord(data = iris,
           columns = 1:4,
           groupColumn = "Species",
           scale = "robust") +
           scale_color_brewer(palette = "Set2")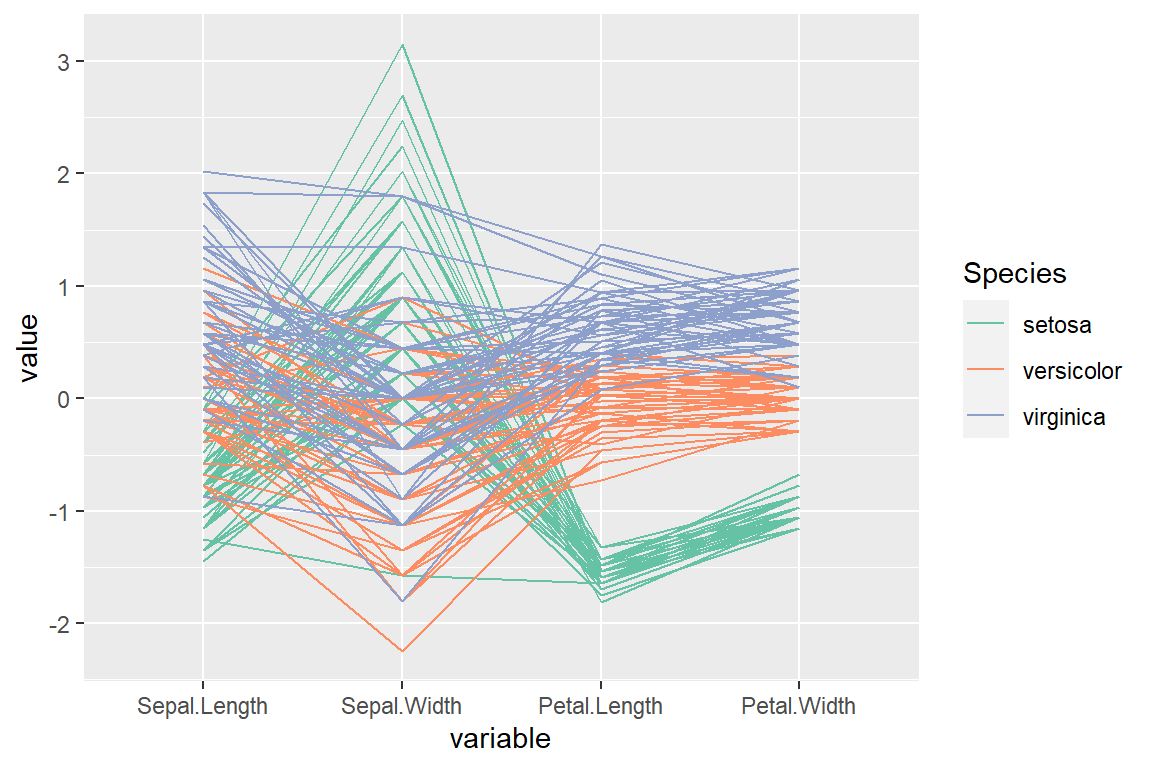
“uniminmax” scale
# install.packages("GGally")
library(GGally)

ggparcoord(data = iris,
           columns = 1:4,
           groupColumn = "Species",
           scale = "uniminmax") +
           scale_color_brewer(palette = "Set2")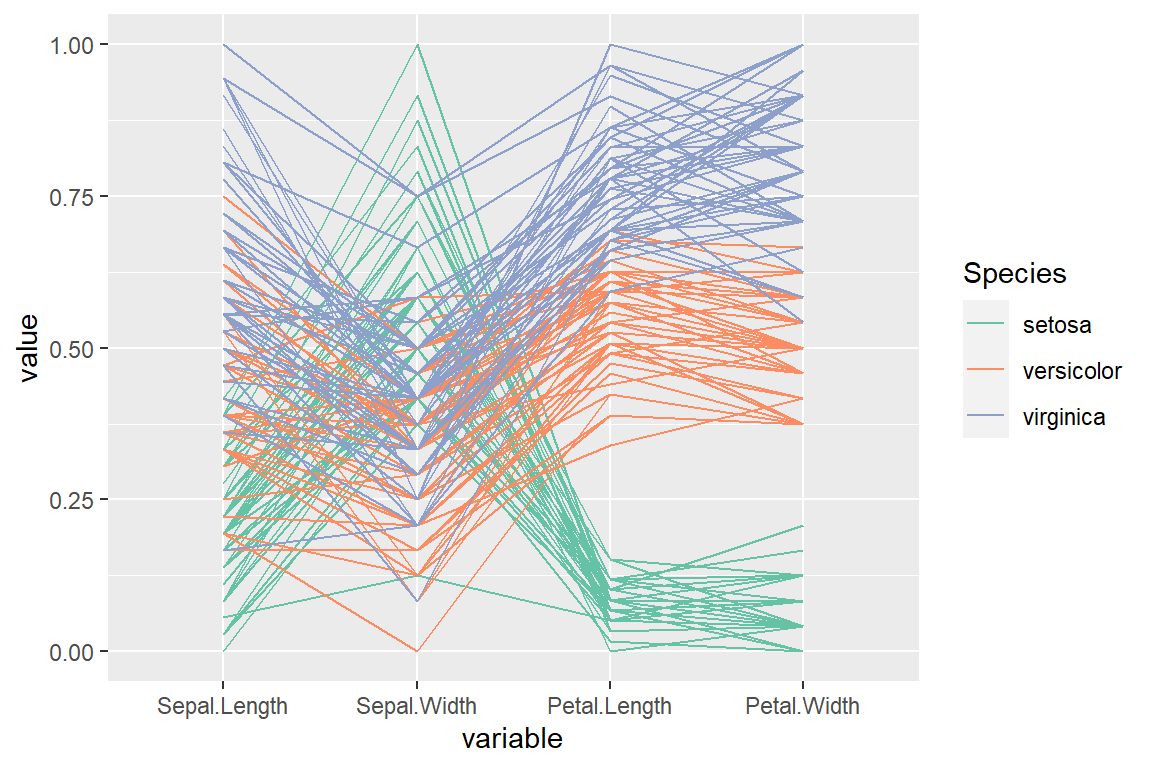
“globalminmax” scale (no scaling)
# install.packages("GGally")
library(GGally)

ggparcoord(data = iris,
           columns = 1:4,
           groupColumn = "Species",
           scale = "globalminmax") +
           scale_color_brewer(palette = "Set2")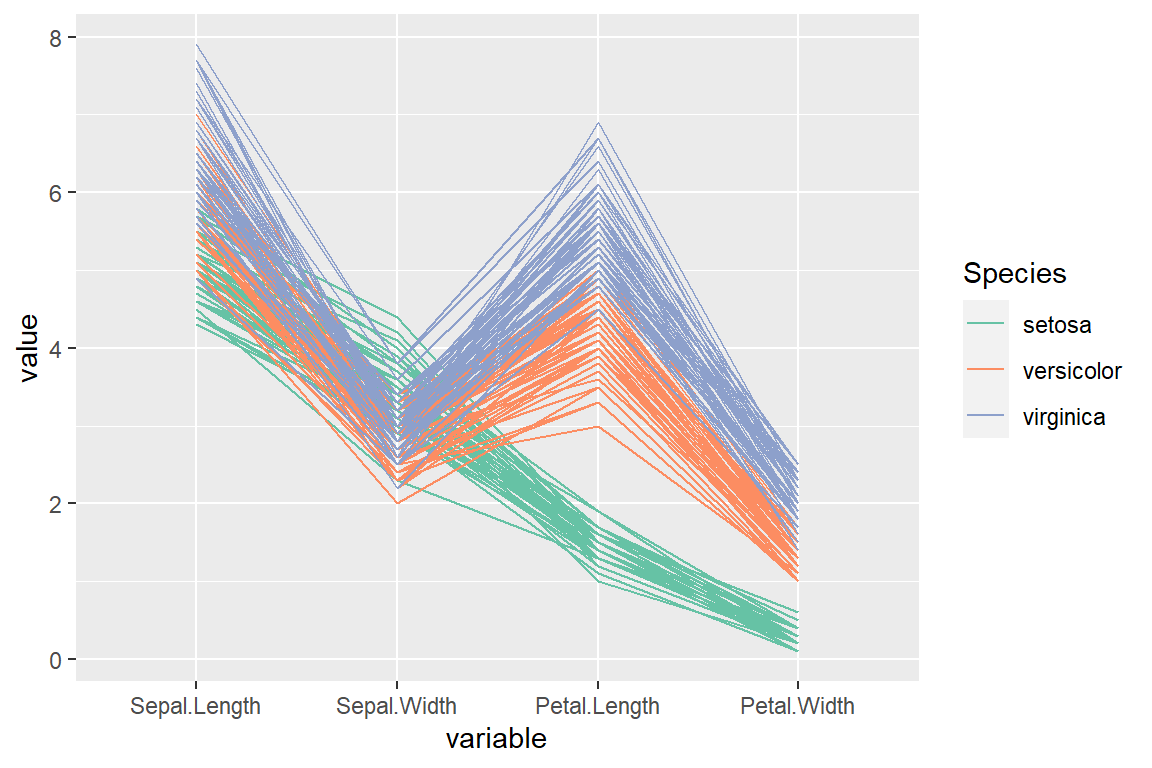
“center” scale
# install.packages("GGally")
library(GGally)

ggparcoord(data = iris,
           columns = 1:4,
           groupColumn = "Species",
           scale = "center") +
           scale_color_brewer(palette = "Set2")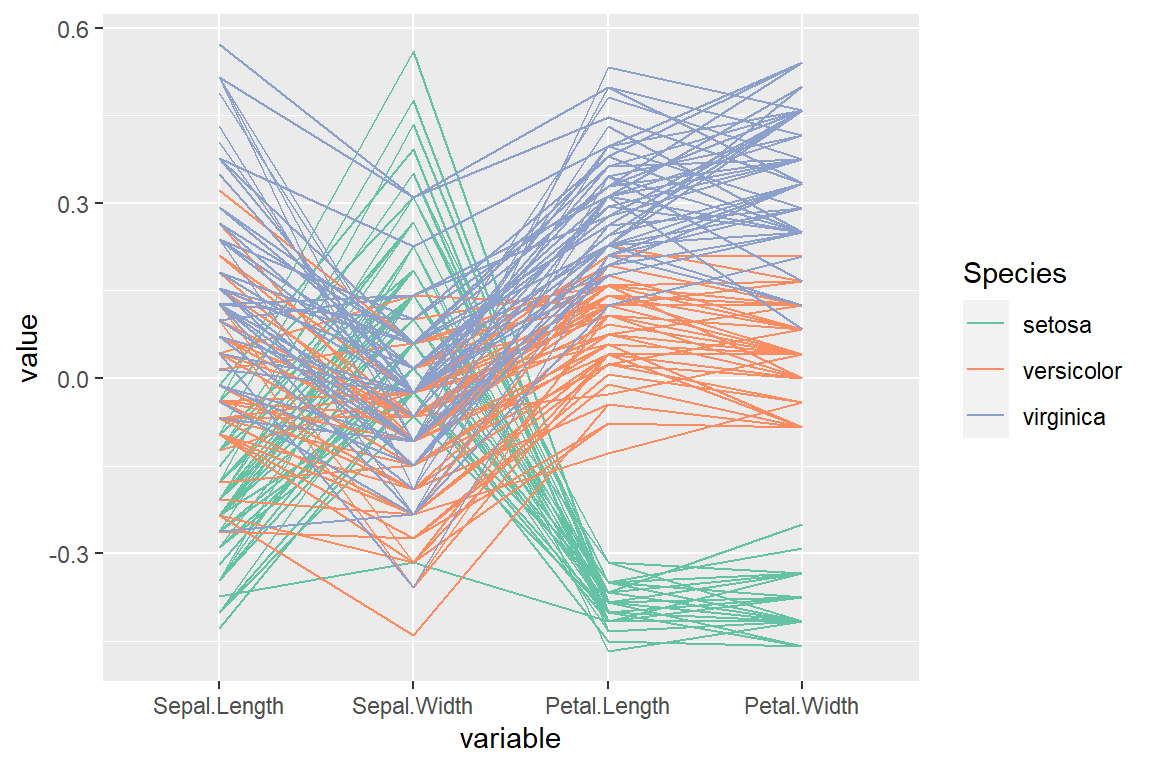
“centerObs” scale
# install.packages("GGally")
library(GGally)

ggparcoord(data = iris,
           columns = 1:4,
           groupColumn = "Species",
           scale = "centerObs") +
           scale_color_brewer(palette = "Set2")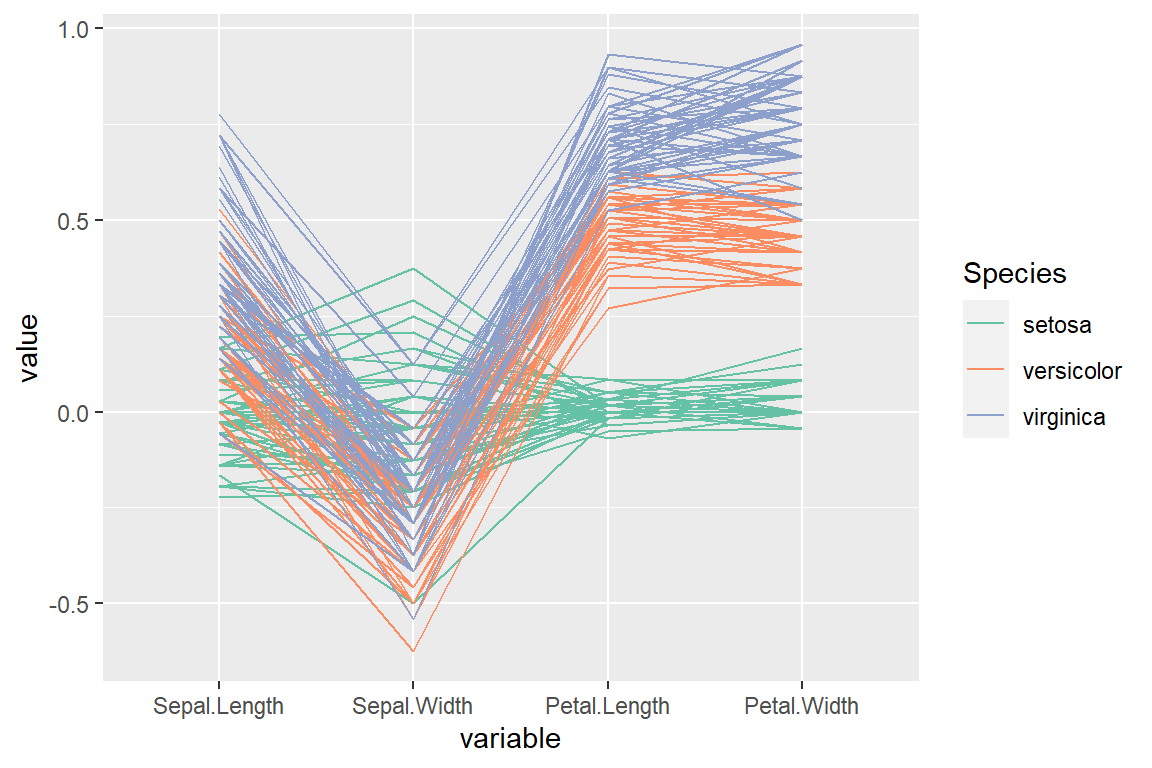
Ordering methods
There are also several methods for ordering the variables displayed on the X-axis. The default ordering is based on the selected columns, but you can also specify a custom order vector or select one of the methods displayed below. Type ?ggparcoord for further details for each mehtod.

“anyClass” order (by their maximum of k F-statistics)
# install.packages("GGally")
library(GGally)

ggparcoord(data = iris,
           columns = 1:4,
           groupColumn = "Species",
           order = "anyClass") +
           scale_color_brewer(palette = "Set2")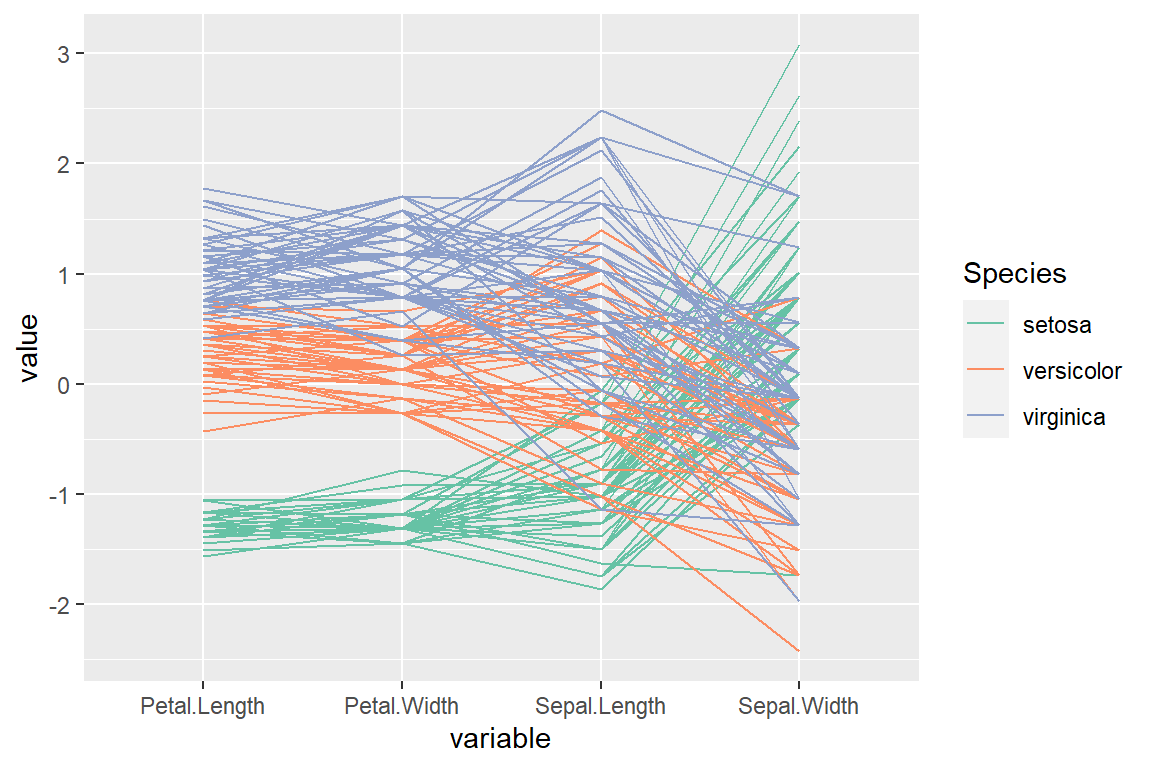
“allClass” order (by their F-statistic from an ANOVA)
# install.packages("GGally")
library(GGally)

ggparcoord(data = iris,
           columns = 1:4,
           groupColumn = "Species",
           order = "allClass") +
           scale_color_brewer(palette = "Set2")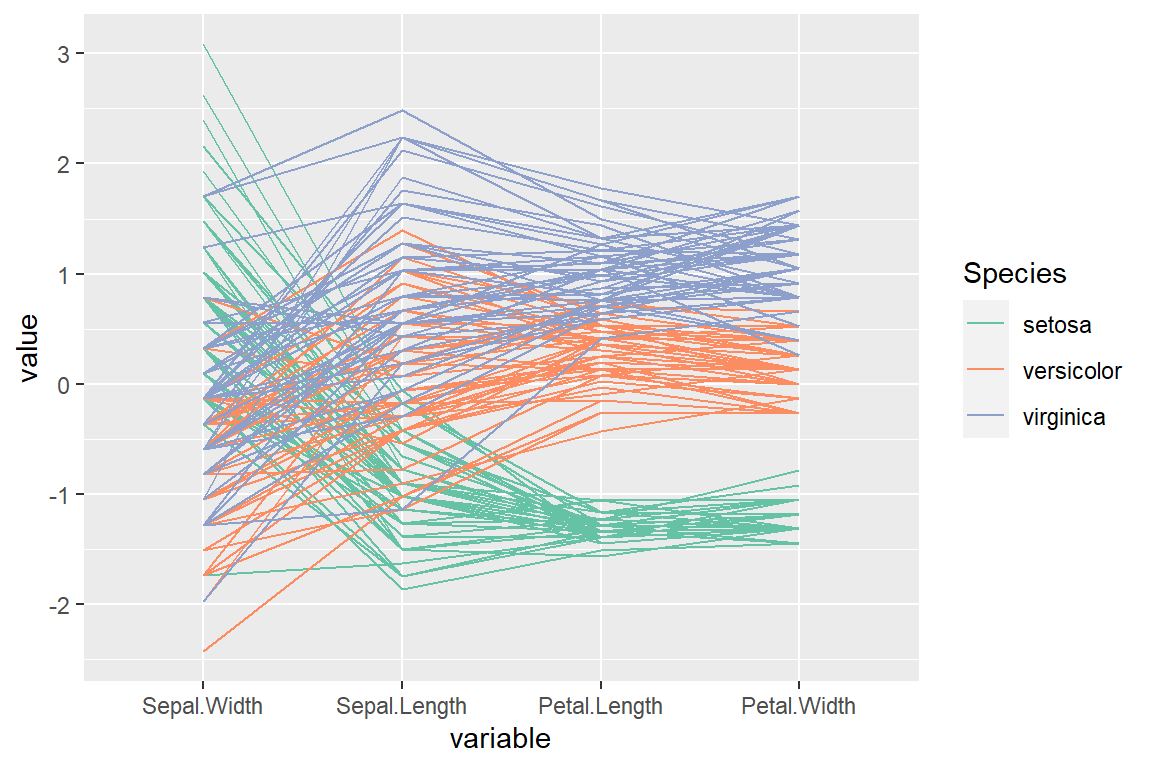
“skewness” order (by their sample skewness)
# install.packages("GGally")
library(GGally)

ggparcoord(data = iris,
           columns = 1:4,
           groupColumn = "Species",
           order = "skewness") +
           scale_color_brewer(palette = "Set2")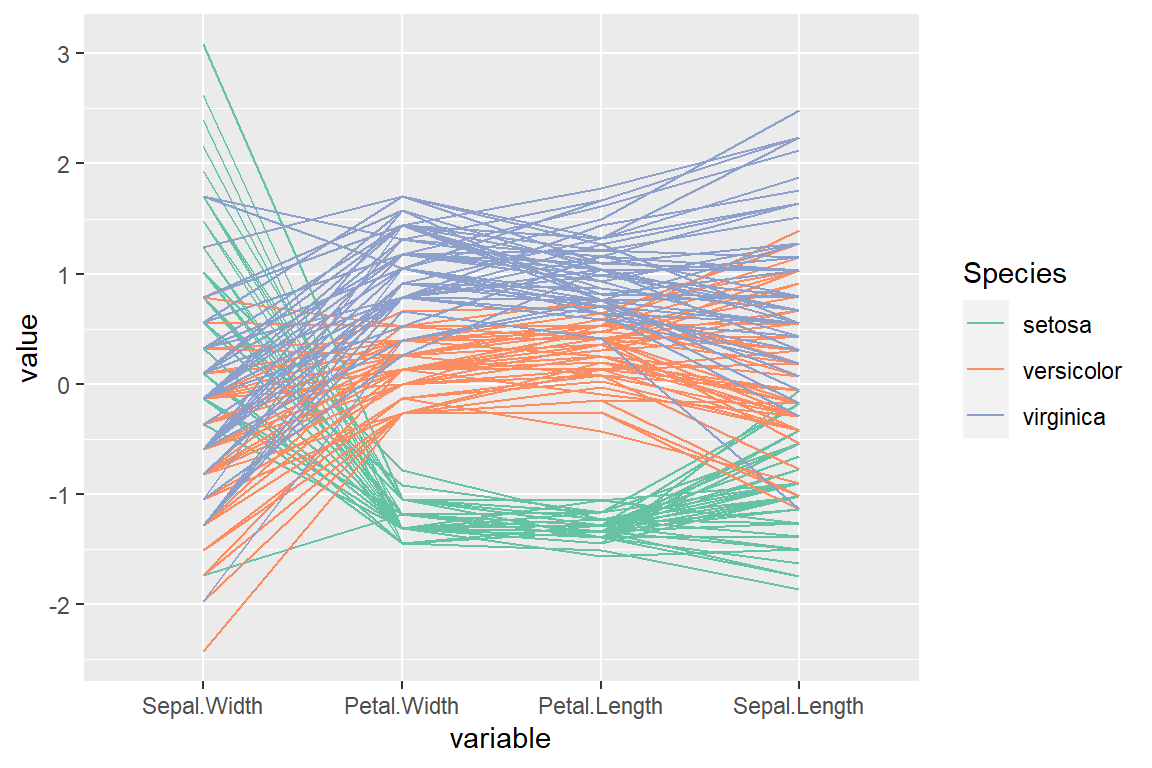
“Outlying” order (by the scagnostic measure)
# install.packages("GGally")
# install.packages("scagnostics")
library(GGally)

ggparcoord(data = iris,
           columns = 1:4,
           groupColumn = "Species",
           order = "Outlying") +
           scale_color_brewer(palette = "Set2")
Parallel coordinates for each group
You can make use of the facet_wrap function to create a parallel coordinates plot for each of the groups.
# install.packages("GGally")
library(GGally)

ggparcoord(data = iris,
           columns = 1:4,
           alphaLines = 0.2,
           boxplot = TRUE,
           groupColumn = "Species",
           order = "Outlying") +
           scale_color_brewer(palette = "Set2") +
  facet_wrap(~ Species)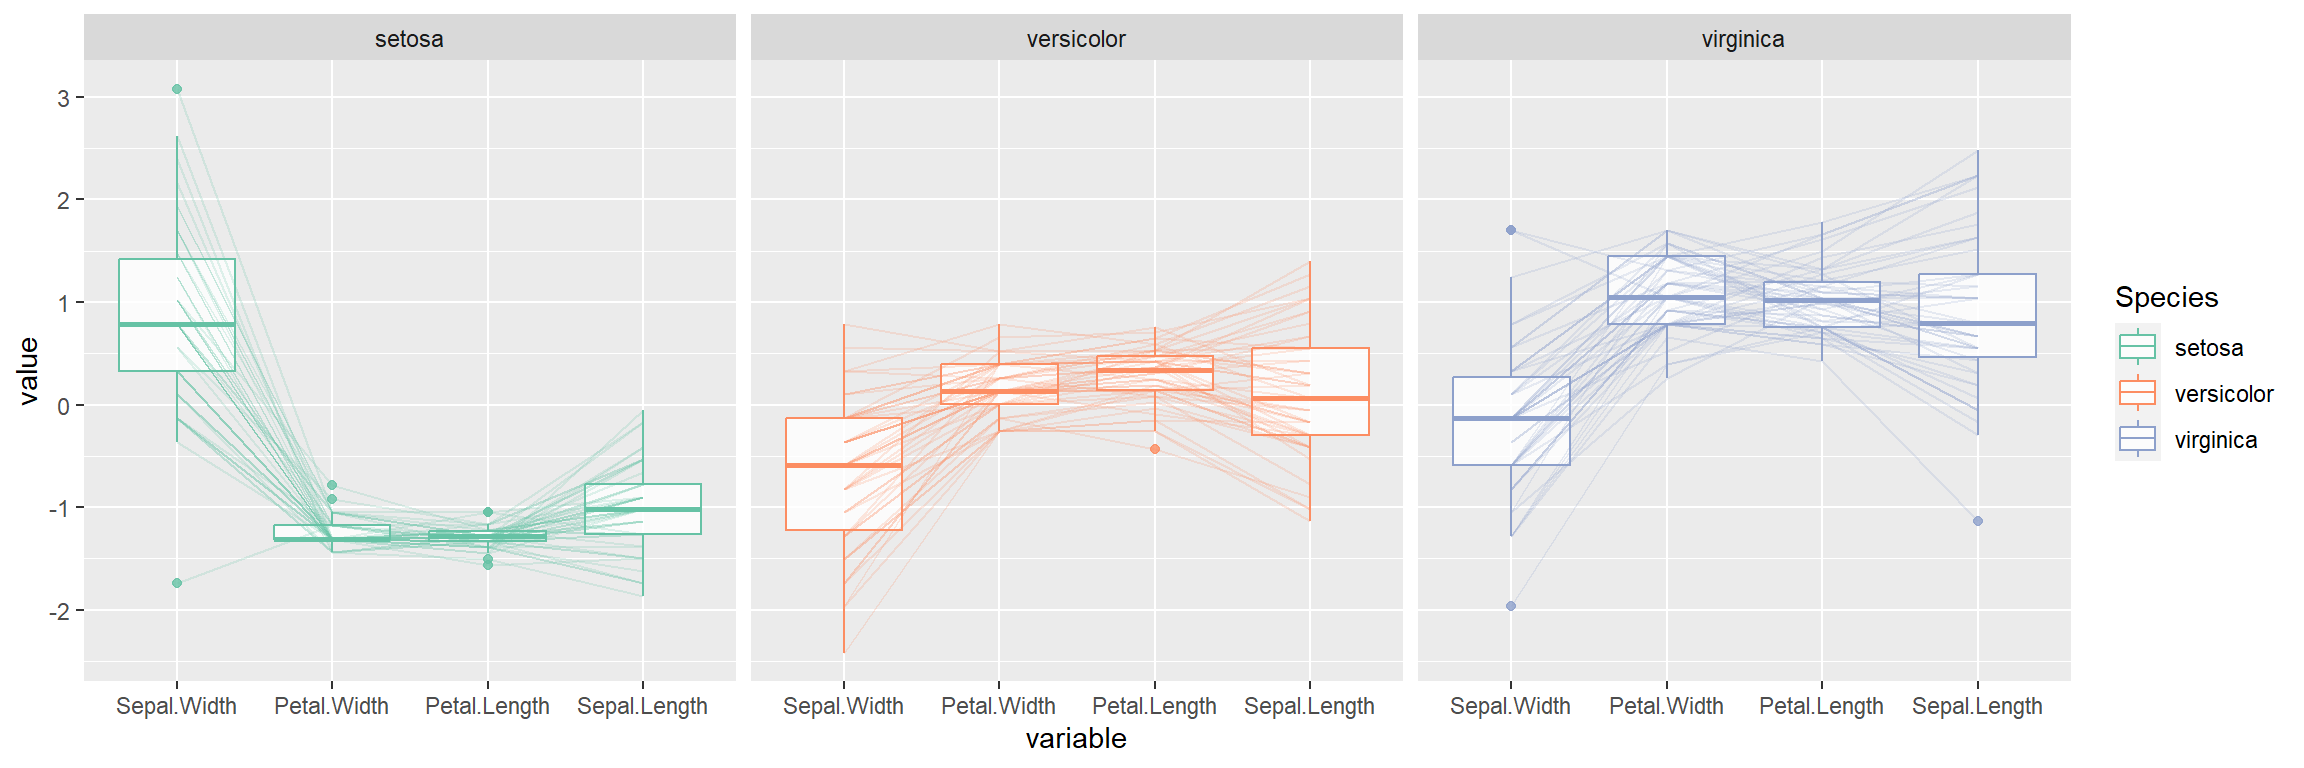

Master Statistics
Learn statistics from the basics to advanced techniques, clearly explained
Go to site