Sample data sets
When you want to create a bar plot in ggplot2 you might have two different types of data sets: when a variable represents the categories and other the count for each category and when you have all the occurrences of a categorical variable, so you want to count how many occurrences exist for each group. In this tutorial we will show you how to deal with both types of data.
Data with category and count
df <- data.frame(group = c("A", "B", "C"),
                 count = c(3, 5, 6))
Only categorical data
df2 <- data.frame(cat = c("A", "A", "A",
                          "B", "B", "B", "B", "B",
                          "C", "C", "C", "C", "C", "C"))
Bar chart with geom_bar
geom_bar
The main function for creating bar plots or bar charts in ggplot2 is geom_bar. By default, this function counts the number of occurrences for each level of a categorical variable.
# install.packages("ggplot2")
library(ggplot2)

ggplot(df2, aes(x = cat)) +
  geom_bar()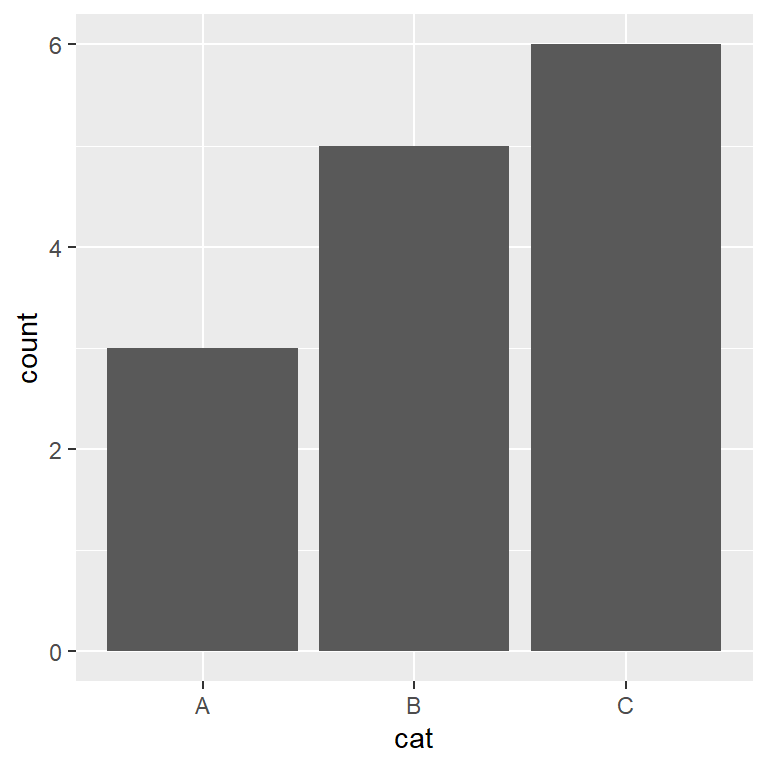
geom_bar with stat “identity”
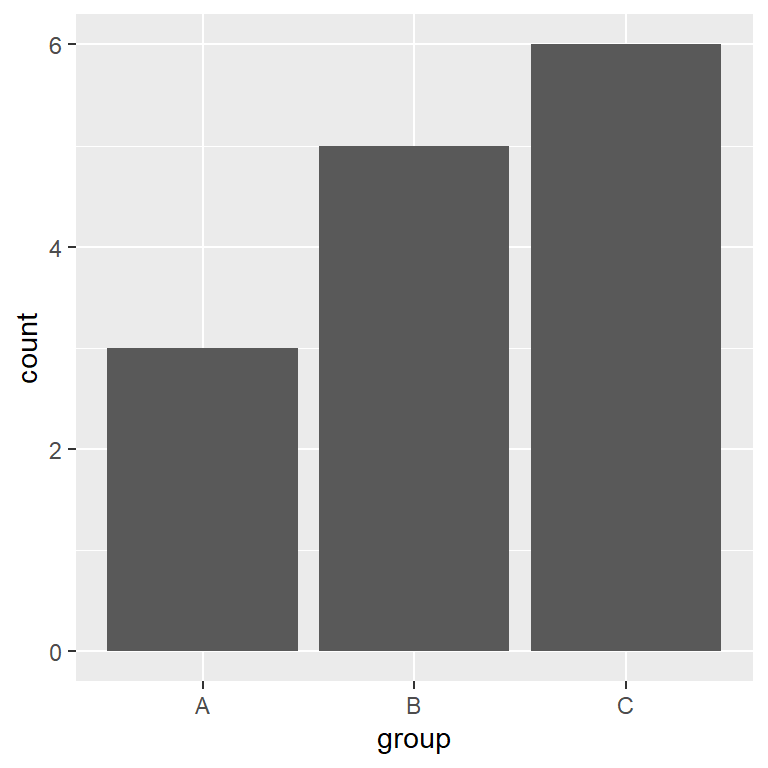
Nonetheless, if your data set already contains the count for each group, as in our sample data set named df, you will need to pass stat = "identity" inside geom_bar.
# install.packages("ggplot2")
library(ggplot2)

ggplot(df, aes(x = group, y = count)) +
  geom_bar(stat = "identity")
Bar chart with geom_col
geom_col
geom_col is the same as geom_bar(stat = "identity"), so if your data contains groups and the count for each group you can just use this function instead.
# install.packages("ggplot2")
library(ggplot2)

ggplot(df, aes(x = group, y = count)) +
  geom_col()
Horizontal bar plot
There are two ways to create a horizontal bar plot: using the coord_flip function to flip the axes or passing the categorical variable to the y argument of aes.
Option 1: using coord_flip
# install.packages("ggplot2")
library(ggplot2)

ggplot(df, aes(x = group, y = count)) +
  geom_bar(stat = "identity") +
  coord_flip()
Option 2: changing the aes variables order
# install.packages("ggplot2")
library(ggplot2)

ggplot(df, aes(x = count, y = group)) +
  geom_bar(stat = "identity")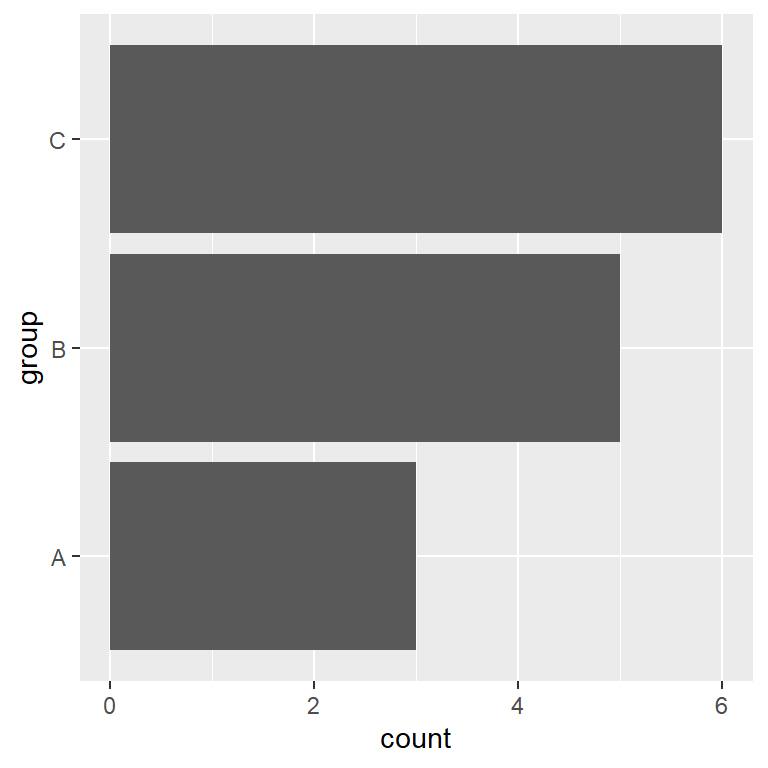
Order of the bars of the bar graph
The default order of the bars depend on the levels of the factor variable. In our example you can check the order of the bars with levels(as.factor(df$group)). However, you reorder the bars in several ways: changing the limits with scale_x_discrete, modifying the levels order with factor or even using the reorder function.
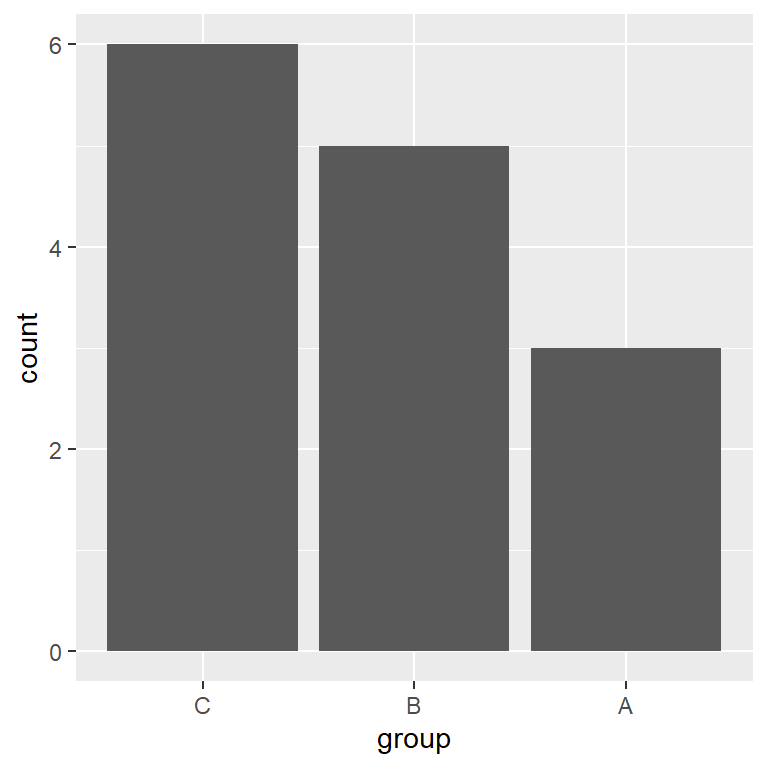
# install.packages("ggplot2")
library(ggplot2)

ggplot(df, aes(x = group, y = count)) +
  geom_bar(stat = "identity") +
  scale_x_discrete(limits = c("C", "B", "A"))

# Or changing the levels of the factor variable
ggplot(df, aes(x = factor(group, levels = c("C", "B", "A")), y = count)) +
  geom_bar(stat = "identity")
Adding labels to the bars
In some scenarios its interesting to add labels to display the count for each bar or any text describing the bars. For that purpose, you can use the geom_text (or geom_label) function and set the labels inside the label argument of aes and changing its vertical alignment with vjust.
Labels inside the bars
# install.packages("ggplot2")
library(ggplot2)

ggplot(df, aes(x = group, y = count)) +
  geom_bar(stat = "identity") +
  geom_text(aes(label = count), vjust = 2, colour = "white")


# Note that if you data is categorical
# you can show the count for each group with ..count..
ggplot(df2, aes(x = cat)) +
  geom_bar() +
  geom_text(aes(label = ..count..), stat = "count", vjust = 2, colour = "white")
Labels over the bars
# install.packages("ggplot2")
library(ggplot2)

ggplot(df, aes(x = group, y = count)) +
  geom_bar(stat = "identity") +
  geom_text(aes(label = count), vjust = -1, colour = "black") +
  ylim(c(0, 6.5)) # Increase the limits of the Y-axis if needed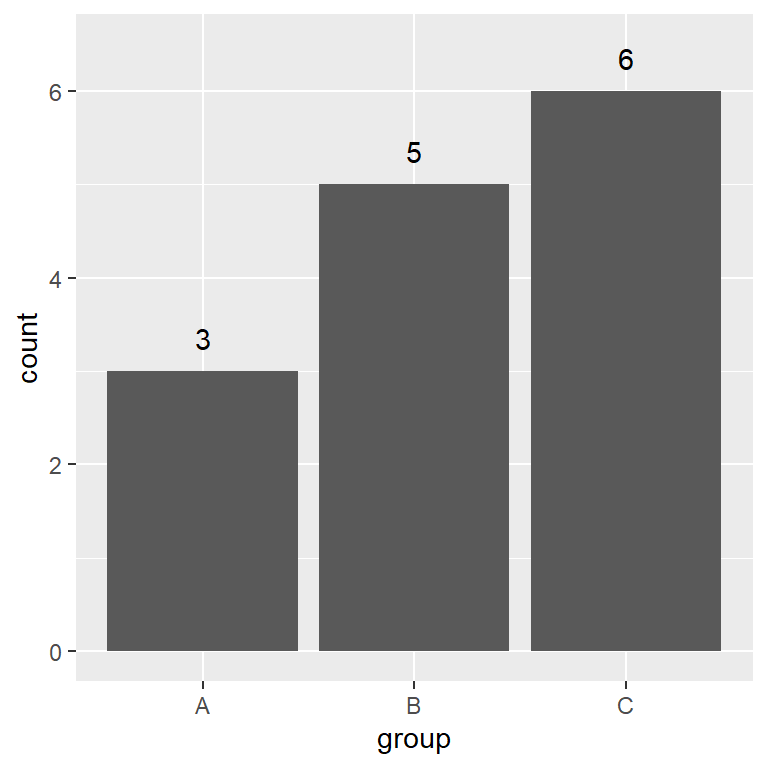
Color customization of the bars
It is possible to change the fill and the border color of the bars. You can set a color for all the bars, a color for each group or set the custom colors you want.
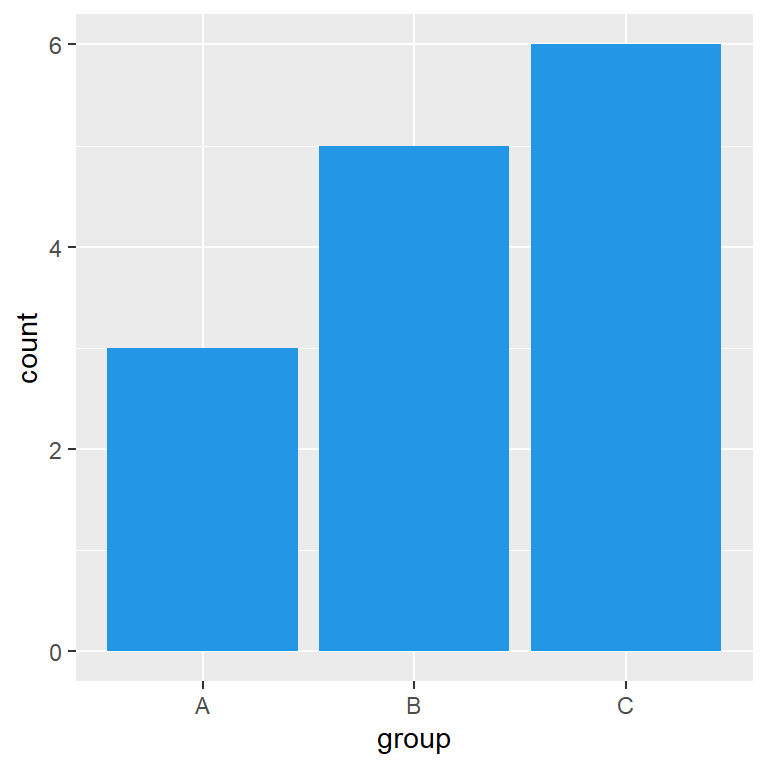
Same color for all bars
By default, all the bars of the graph are gray. You can change this color passing a new color to the fill argument of geom_bar.
# install.packages("ggplot2")
library(ggplot2)

ggplot(df, aes(x = group, y = count)) +
  geom_bar(stat = "identity", fill = 4)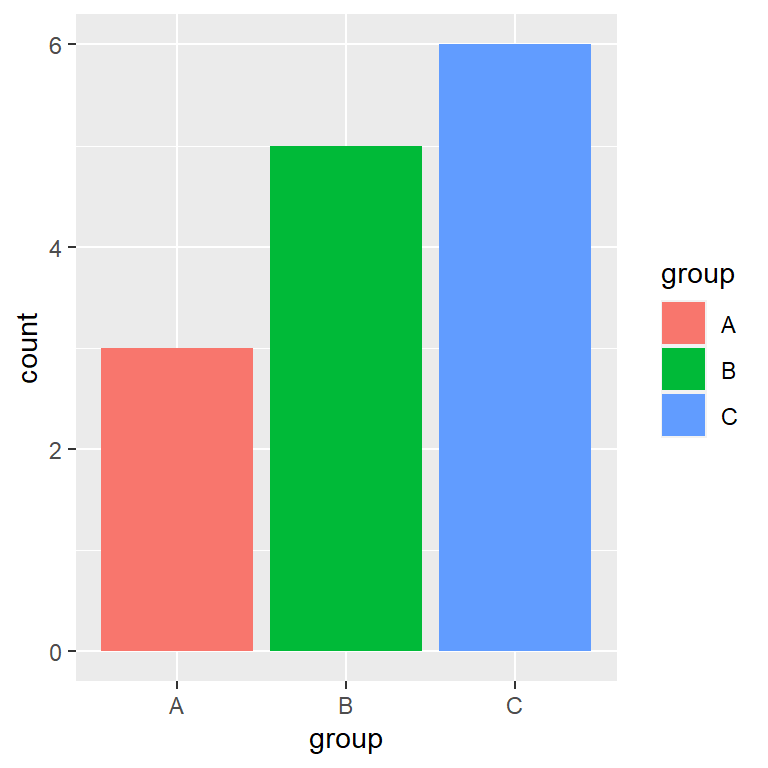
Color by group
Note that you can also set a color for each group of your data. In this scenario, you will need to pass your categorical variable to fill but inside the aes function.
# install.packages("ggplot2")
library(ggplot2)

ggplot(df, aes(x = group, y = count, fill = group)) +
  geom_bar(stat = "identity")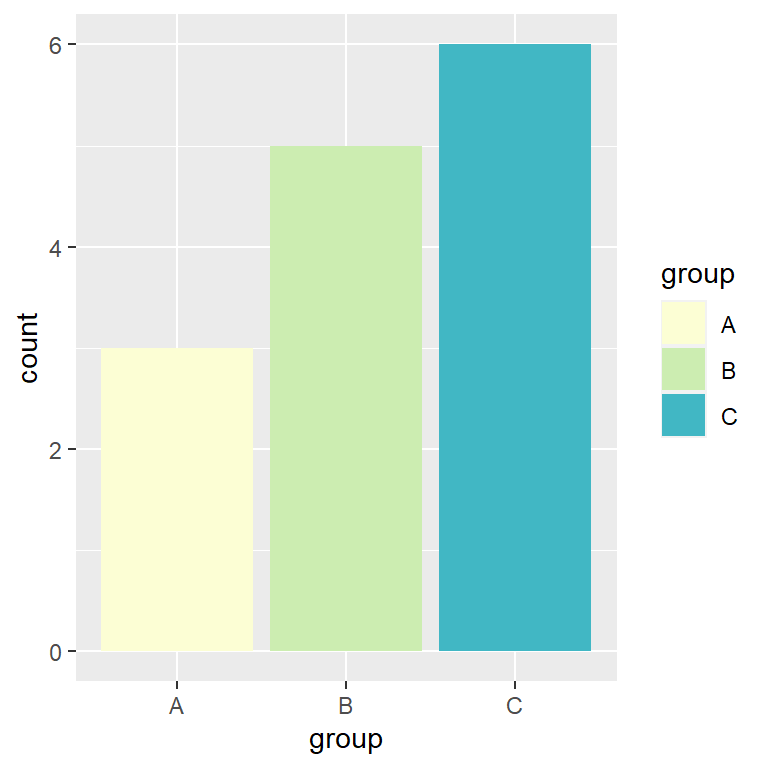
Specify a color for each bar
When filling the colors of the bars by group the colors will be the ones of the default color palette from ggplot2. In order to override these colors you can specify them using other palette or with the scale_fill_manual function, both with an ordered vector of colors or with a named vector, where the names are the group labels.
# install.packages("ggplot2")
library(ggplot2)

ggplot(df, aes(x = group, y = count, fill = group)) +
  geom_bar(stat = "identity") +
  scale_fill_manual(values = c("#FCFED4", "#CCEDB1", "#41B7C4"))

# Or use a named vector with the group labels
ggplot(df, aes(x = group, y = count, fill = group)) +
  geom_bar(stat = "identity") +
  scale_fill_manual(values = c("A" = "#FCFED4", "B" = "#CCEDB1", "C" = "#41B7C4"))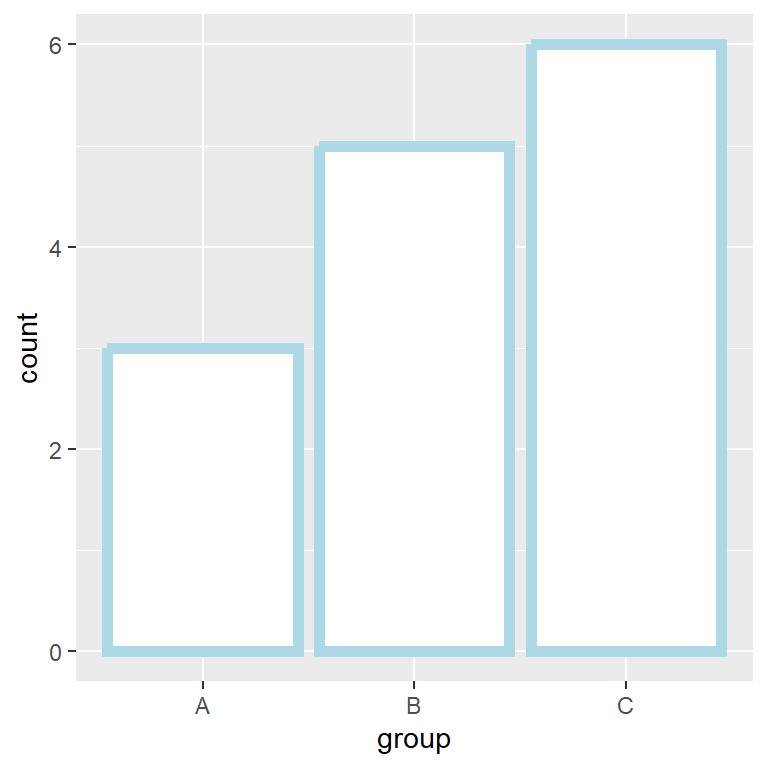
Border color
If you use color instead of fill you can change the border color of the bars the same way you did with the fill color. In addition, you can change the line width and the line type with lwd and linetype, respectively.
# install.packages("ggplot2")
library(ggplot2)

ggplot(df, aes(x = group, y = count)) +
  geom_bar(stat = "identity",
           color = "lightblue",
           lwd = 2, fill = "white")
Border color by group
In case you want to change the color by group pass the categorical variable to the color argument inside aes. Note that if you want to customize the colors you can use the scale_color_manual function.
# install.packages("ggplot2")
library(ggplot2)

ggplot(df, aes(x = group, y = count, color = group)) +
  geom_bar(stat = "identity", lwd = 2, fill = "white")
Legend customization
Legend position
The legend is positioned to the right by default, but you can change it with the legend.position argument of the theme function. Possible values are "right" (default), "bottom", "left", "top" and "none" to remove the legend of the bar plot.
# install.packages("ggplot2")
library(ggplot2)

ggplot(df, aes(x = group, y = count, fill = group)) +
  geom_bar(stat = "identity") +
  theme(legend.position = "bottom")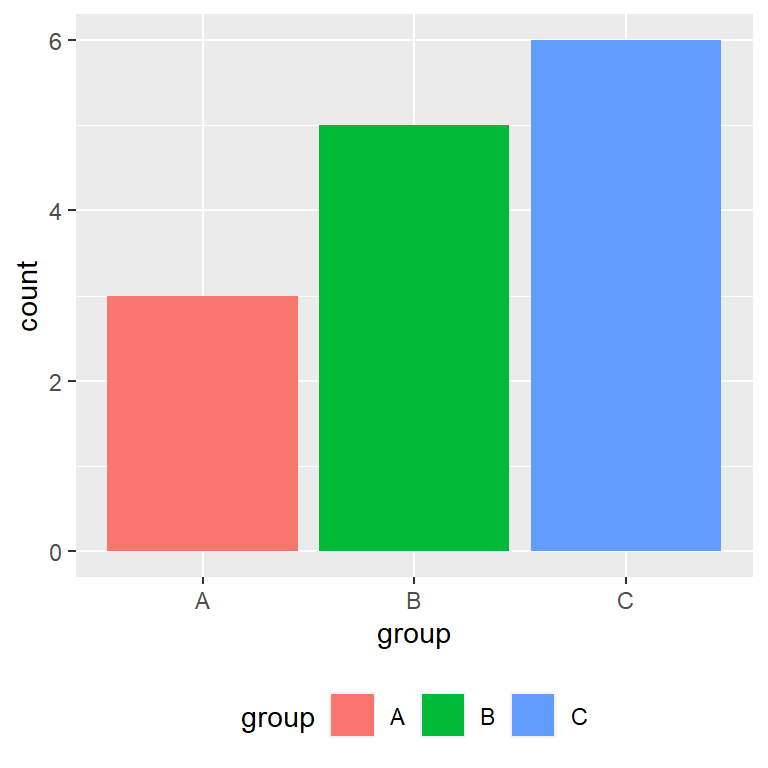
Legend title
The default title of the legend is the name of the categorical variable. To override this name you can use the following line of code:
# install.packages("ggplot2")
library(ggplot2)

ggplot(df, aes(x = group, y = count, fill = group)) +
  geom_bar(stat = "identity") +
  guides(fill = guide_legend(title = "Legend title"))
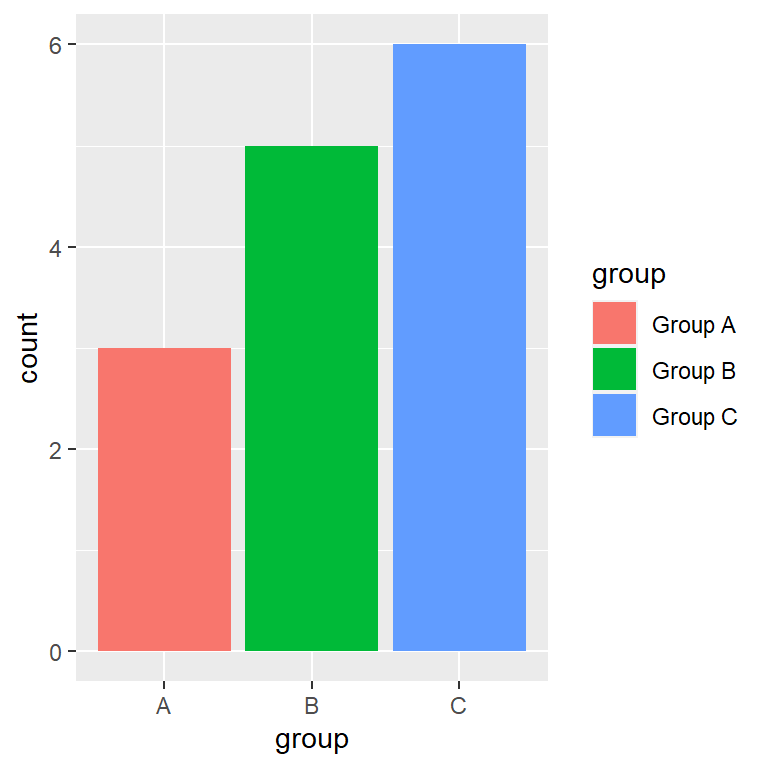
Legend labels
Finally, if you want to set custom names for the legend change the levels of the categorical variable or use the labels argument of scale_fill_hue as follows.
# install.packages("ggplot2")
library(ggplot2)

ggplot(df, aes(x = group, y = count, fill = group)) +
  geom_bar(stat = "identity") +
  scale_fill_hue(labels = c("Group A", "Group B", "Group C"))