Sample data set
Consider the well-known iris data set and divide it between the numerical and the categorical variable.
df <- iris[, 1:4]
groups <- iris[, 5]
Parallel coordinate plot with parcoord
Basic parallel coordiates plot
The parcoord function from MASS package can be used to create a parallel coordinates plot in base R based on the matplot function. You can input a matrix or a data frame.
# install.packages("MASS")
library(MASS)

parcoord(df)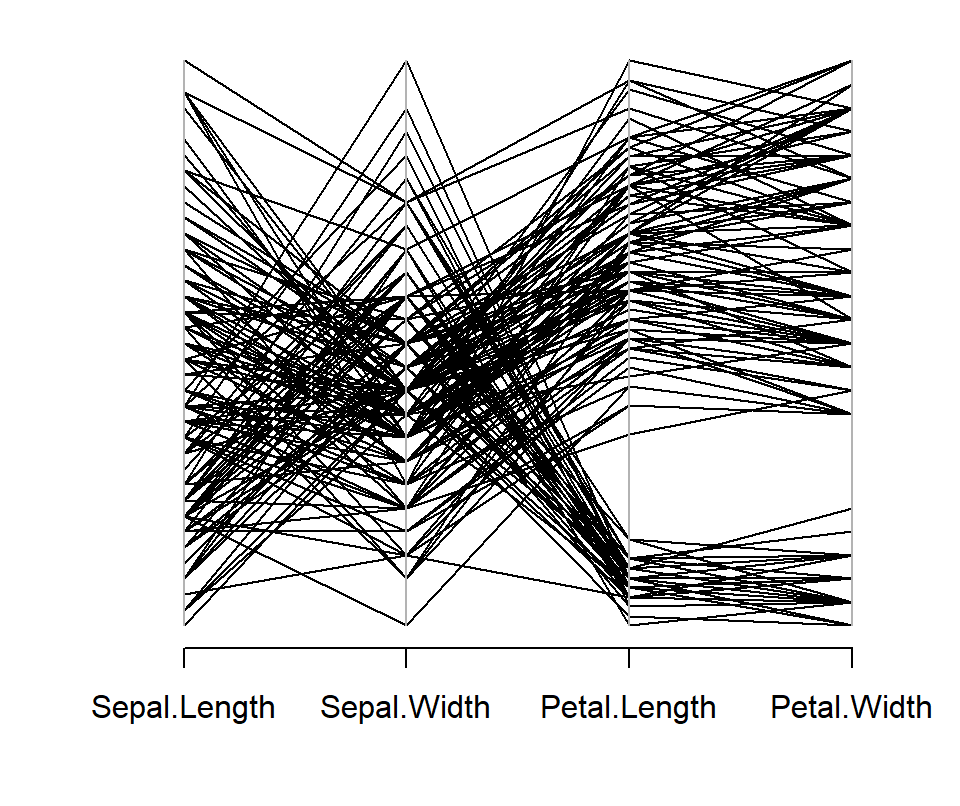
Minimum and maximum values
If you want to show the minimum and maximum values for each axis variable set var.label = TRUE.
# install.packages("MASS")
library(MASS)

parcoord(df, var.label = TRUE)
Lines customization
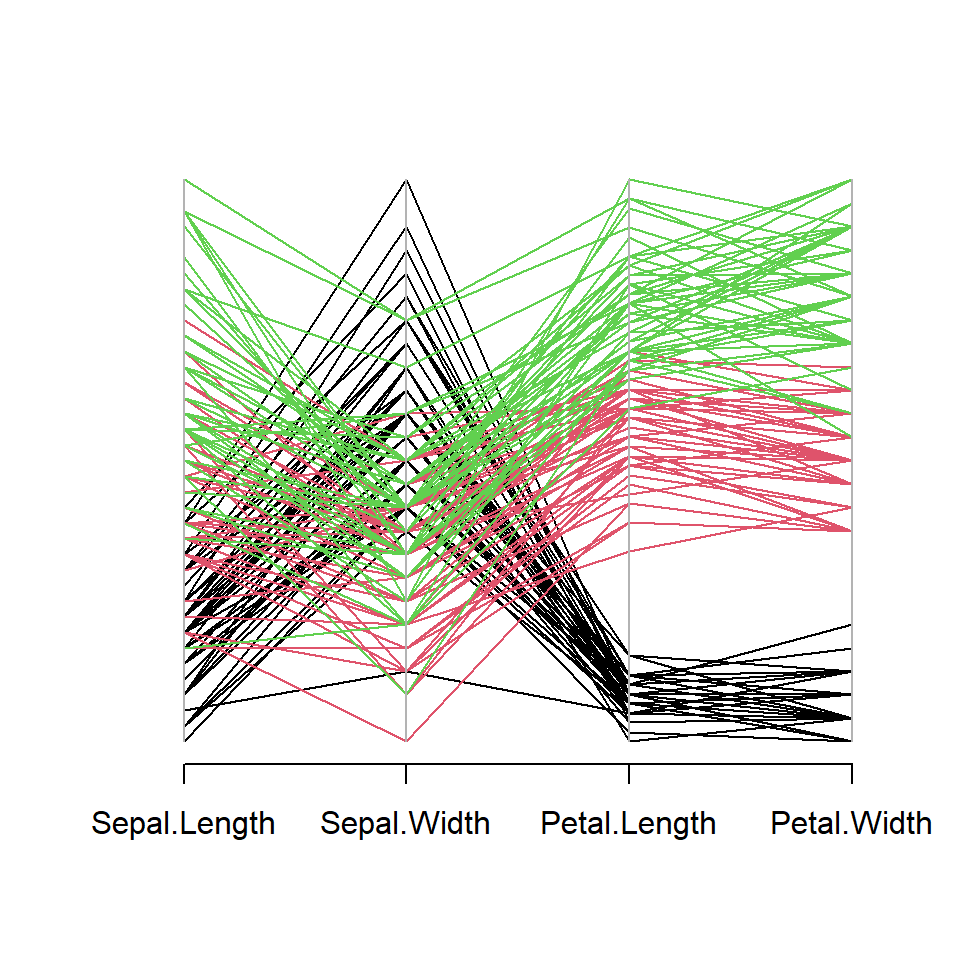
Color by group
The col argument can be used to change the color of the lines. You can pass a single color to change the default black color or specify a color for each row (line) of the data frame. In the following example we are transforming the categorical variable into numeric, so each group will have a different color.
# install.packages("MASS")
library(MASS)

# Categorical variable as colors
cols <- as.numeric(groups)

parcoord(df, col = cols)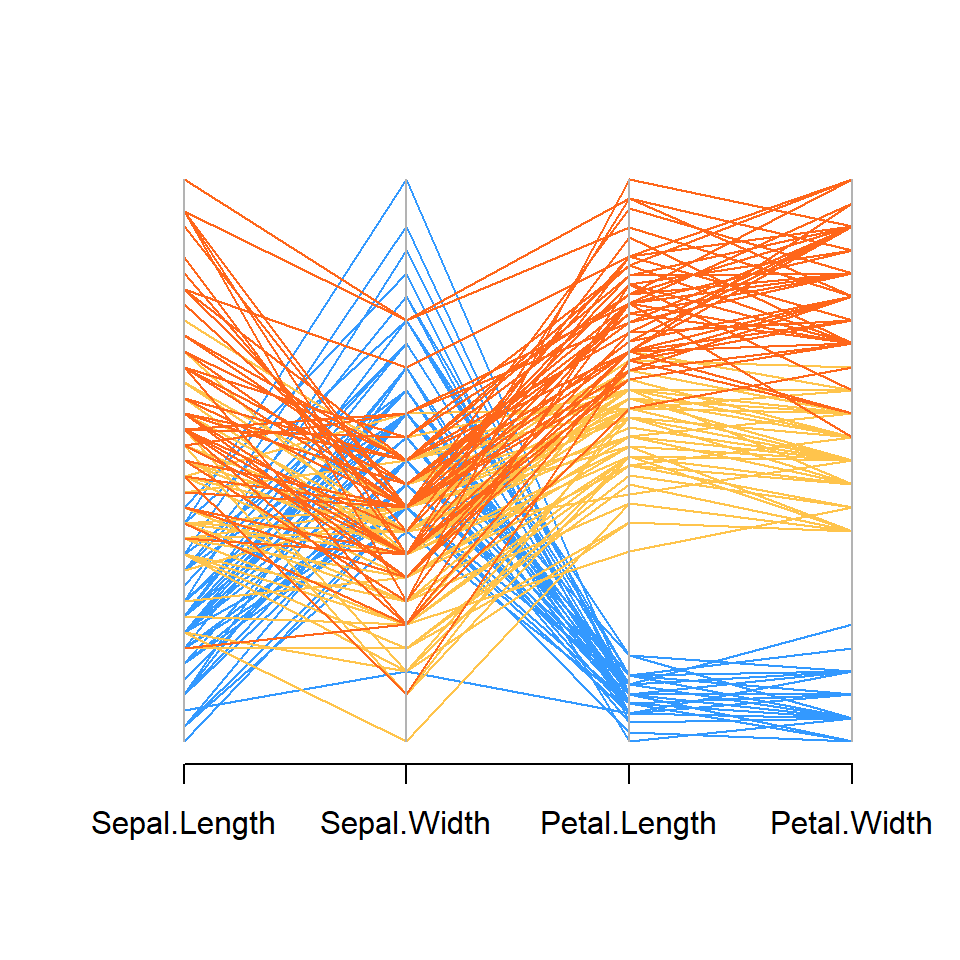
Custom colors
If you prefer setting custom colors you can create a vector with as many colors as groups as shown in the example below.
# install.packages("MASS")
library(MASS)

# Colors
cols <- c("#3399FF", "#FFC44C", "#FF661A")
cols <- cols[factor(groups)]

parcoord(df, col = cols)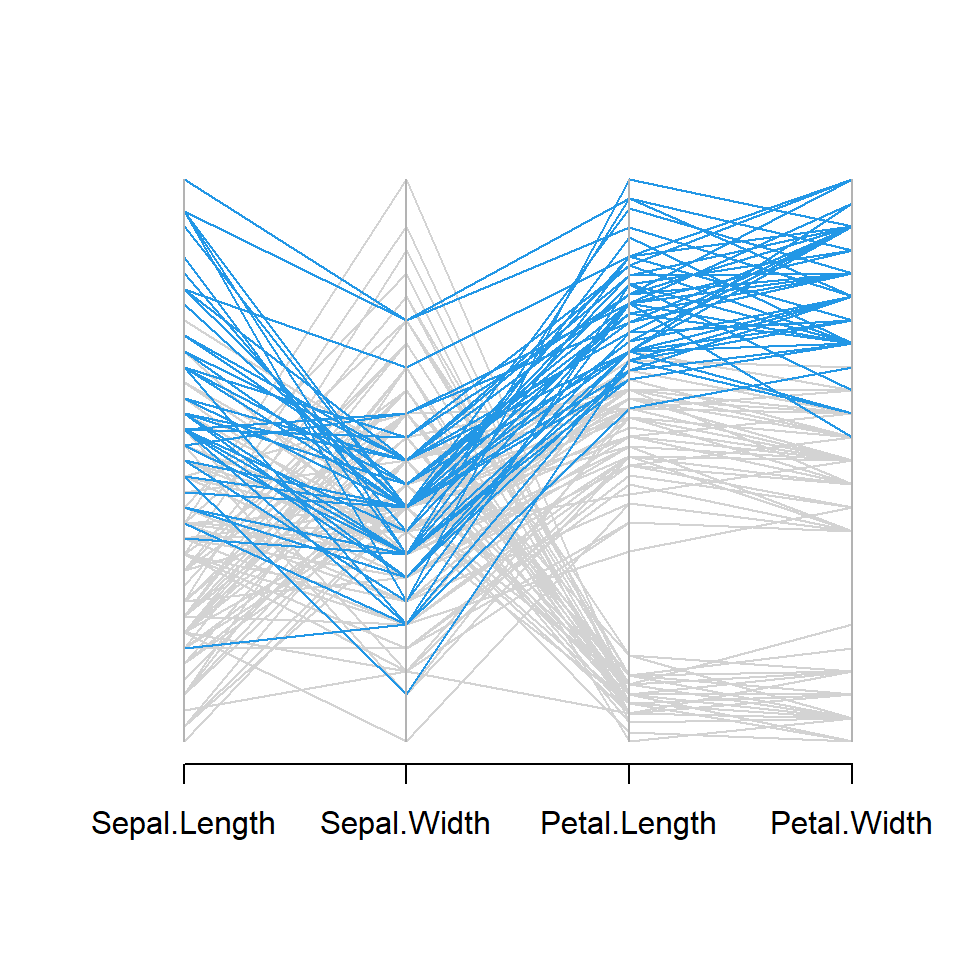
Highlighting a group
Note that the previous approach can be used to highlight specific groups. For instance, in the following example we are highlighting one of the groups with blue lines against gray lines.
# install.packages("MASS")
library(MASS)

# Colors
cols <- c("lightgray", "lightgray", 4)
cols <- cols[factor(groups)]

parcoord(df, col = cols)
Master Statistics
Learn statistics from the basics to advanced techniques, clearly explained
Go to site